http://www.diva-portal.org
Postprint
This is the accepted version of a paper published in Neurobiology of Aging. This paper has been peer-reviewed but does not include the final publisher proof-corrections or journal pagination.
Citation for the original published paper (version of record):
Enache, D., Solomon, A., Cavallin, L., Kåreholt, I., Kramberger, M G. et al. (2016)
CAIDE Dementia Risk Score and biomarkers of neurodegeneration in memory clinic patients without dementia.
Neurobiology of Aging, 42: 124-131
https://doi.org/10.1016/j.neurobiolaging.2016.03.007
Access to the published version may require subscription. N.B. When citing this work, cite the original published paper.
Permanent link to this version:
CAIDE Dementia Risk Score and biomarkers of neurodegeneration in memory clinic
patients without dementia
Daniela Enachea1,b, Alina Solomona1,c,d, Lena Cavallin e,f, Ingemar Kåreholt d,g, Milica Gregoric Krambergera1,h, Dag Aarslanda1,i,j, Miia Kivipeltoa1,c,d,i, Maria Eriksdottera2,i, Bengt Winblada1,i, Vesna Jelica2,i
aDepartment of Neurobiology, Care Sciences and Society, a1Division of Neurogeriatrics,
a2Division of Clinical Geriatrics,Karolinska Institutet, Stockholm, Sweden; bPsychiatry
Southwest, Karolinska University Hospital Huddinge; cInstitute of Clinical
Medicine/Neurology, University of Eastern Finland, Kuopio, Finland; d Aging Research Center, Karolinska Institutet and Stockholm University, Stockholm, Sweden; eDepartment of Clinical Science, Intervention and Technology, Karolinska Institutet, Stockholm, Sweden; fDepartment of Radiology, Karolinska University Hospital, Stockholm, Sweden; gInstitute of Gerontology, School of Health and Welfare , Jönköping University,
Jönköping, Sweden; hDepartment of Neurology, University Medical Centre, Ljubljana, Slovenia; iDepartment of Geriatric Medicine, Memory Clinic, Karolinska University Hospital-Huddinge, Stockholm, Sweden; jCenter for Age-Related Diseases, Psychiatric
Clinic, Stavanger University Hospital, Stavanger, Norway
*Corresponding author:
Daniela Enache, Department of Neurobiology, Care Sciences and Society; Division of Neurogeriatrics, Karolinska Institutet, Novum, 141 86 Stockholm, Sweden; daniela.enache@ki.se
Key words: mild cognitive impairment, subjective cognitive impairment, CAIDE Dementia Risk Score, neurodegeneration, amyloid beta, tau
Abstract
The aim of this study was to explore cross-sectional associations between CAIDE Dementia Risk Score and dementia-related CSF and neuroimaging biomarkers in 724 memory clinic patients without dementia from the Memory Clinic at Karolinska University Hospital Huddinge, Sweden. We additionally evaluated the score’s capacity to predict dementia. Two risk score versions were calculated: one including age, gender, obesity, hyperlipidaemia, and hypertension; and one additionally including APOE ε4 carrier status. CSF was analysed for amyloid β (Aβ), total tau (t-tau), and phosphorylated tau (p-tau). Visual assessments of medial temporal lobe atrophy (MTA), global cortical atrophy-frontal subscale (GCA-F) and Fazekas scale for white matter changes (WMC) were performed. Higher CAIDE Dementia Risk Score (version without APOE) was significantly associated with higher t-tau, more severe MTA, WMC and GCA-F. Higher CAIDE Dementia Risk Score (version with APOE) was associated with reduced Aβ, more severe MTA and WMC. CAIDE Dementia Risk Score version with APOE seemed to predict dementia better in this memory clinic population with short follow-up than the version without APOE.
1. Introduction
Prevention of dementia and Alzheimer’s disease (AD) is a major global public health priority (http//www.who.int, 2015). Modifiable vascular and lifestyle-related risk factors have been shown to increase the risk of dementia (Solomon et al., 2014). Dementia risk scores have been developed in general populations (Kivipelto et al., 2006) (Barnes et al., 2009) (Jefferson et al., 2015), primary care (Barnes et al., 2014) or specialized units (Buratti et al., 2015) for the purpose of identifying at-risk individuals who could benefit from preventive interventions (Ngandu et al., 2015).
The CAIDE Dementia Risk Score was developed in a Finnish population for predicting the risk of dementia 20 years later in middle-aged individuals (Kivipelto et al., 2006). It includes easily measurable factors like age, gender, education, BMI, systolic blood pressure, total cholesterol and physical activity. A second version of the risk score additionally included APOE genotype, but without significantly improved predictive performance compared to the original score. The CAIDE Dementia Risk Score was validated in a large multi-ethnic population from USA followed for 40 years (Exalto et al., 2014). Adding several other factors to the risk score (e.g. central obesity, diabetes mellitus, head trauma, lung function, depressed mood, and smoking) did not improve the prediction capacity of the original score (Exalto et al., 2014).
A higher CAIDE Dementia Risk Score in midlife was shown to relate to more severe white matter changes (WMC) and medial temporal atrophy (MTA) on brain MRI up to 30 years later in a population-based study (Vuorinen et al., 2015). However, the risk score has not been tested in memory clinic patients in relation to markers of neurodegeneration and amyloid beta (Aβ) deposition, or dementia development. AD, the most common form of dementia, is histopathologically characterized by Aβ plaques and neurofibrillary tangles (NFT), and changes can be detected years before dementia diagnosis (Jack et al., 2010).
AD-related biomarkers have been divided into two main categories: markers of brain Aβ deposition (e.g. cerebrospinal fluid (CSF) Aβ42), and markers of neurodegeneration (e.g. CSF t-tau or p-tau, atrophy on structural MRI) (Jack et al., 2013). WMC have been related to small vessel disease, and are known to have effects on cognitive functioning (Prins and Scheltens, 2015). Memory clinic patients with Subjective Cognitive Impairment (SCI) or Mild Cognitive Impairment (MCI) are very heterogeneous groups. SCI patients report subjective changes in cognitive performance without objective measurable impairment (Sperling et al., 2011) (Jessen et al., 2014a). MCI has been defined as both subjective and objective cognitive impairment in patients without dementia (Petersen et al., 2014). The risk for converting to dementia from SCI or MCI has been estimated to 10% and 25-40% respectively, depending on study design, duration of the follow up, and population type (clinic-based or general population) (Maioli et al., 2007) (Jessen et al., 2014b) (Mitchell et al., 2014).
Risk scores including easily available and modifiable risk factors could help identify patients who are most at risk for dementia development, and who may benefit most from preventive interventions. The aim of this study was to explore cross-sectional associations between CAIDE Dementia Risk Score and dementia-related CSF and MRI markers in memory clinic patients without dementia, as well the predictive value of the score for the development of dementia.
2. Methods
2.1. Study population
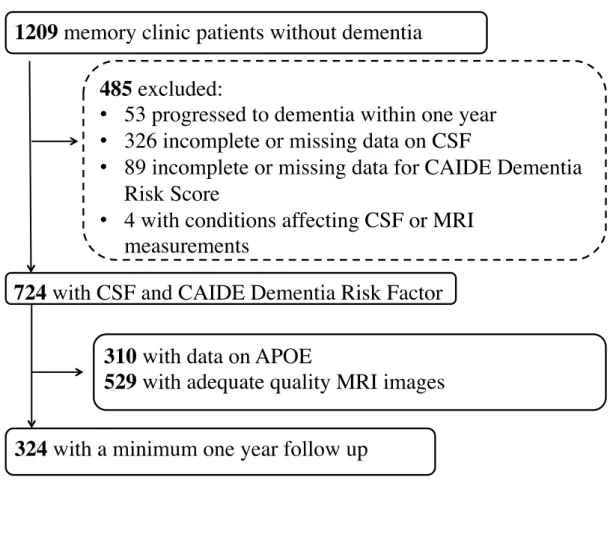
The study included 724 patients (412 with SCI and 312 with MCI) referred to the Memory clinic at the Department of Geriatrics, Karolinska University Hospital Huddinge,
Stockholm, Sweden during 2007-2012. The study was approved by the Regional Ethical Review Board in Stockholm. Written informed consent was obtained from all participants. Inclusion criteria were: age 40 years or older; available data for CAIDE Dementia Risk Score version without APOE genotype; available measurements of CSF biomarkers (total tau – t-tau, tau phosphorylated at threonine 181 – p-tau, and Aβ 1-42); diagnosis of MCI or SCI. Exclusion criteria were: dementia diagnosis at baseline or within one year from baseline; and neurological conditions affecting CSF or MRI assessments (e.g. hydrocephalus, brain tumours, large strokes or multiple sclerosis). Out of 1209 patients without dementia evaluated at the Memory Clinic, 724 fulfilled inclusion criteria (Figure 1). The standard evaluation protocol at the Memory Clinic (described in detail in e.g. Enache, 2015) included interviews with patients and informants, general physical and neurological examination, standardised neuropsychological test-battery assessment of depressive and other psychiatric symptoms, routine blood chemistry, CSF analyses including conventional biomarkers of neurodegeneration (t-tau, p-tau and Aβ 1-42), and brain imaging (MRI or CT scans). Diagnoses were established after consensus meetings using all available information. Dementia diagnoses were made according to International Classification of Diseases 10 revision (ICD 10). MCI was diagnosed according to the Winblad et al 2004 (Winblad et al., 2004) clinical criteria, which require subjective cognitive complaints, impairment on objective cognitive tests, normal global cognitive function, no significant impairment of activities of daily living and no dementia. The diagnosis of SCI was made if the assessments did not show evidence of objective cognitive impairment, i.e. neither dementia nor MCI criteria were fulfilled, although patients and/or informants reported changes in cognitive performance.
According to the standard protocol at the Memory clinic, regular annual follow-up visits for patients with MCI or SCI were planned after the initial assessments and diagnosis only if
clinically indicated (i.e. high risk of cognitive decline as judged by the physician). Follow-up data until March 2015 were collected from patient files. Altogether 324 (44.8%) patients were followed for at least one year (mean 2.9, SD 1.6, range 1-7.8 years). 110 of the 324 patients had SCI at baseline, and 14 (12.7%) developed dementia. 214 of the 324 patients had MCI at baseline, and 86 (40.2%) developed dementia.
2.2. Assessment of CAIDE Dementia Risk Score
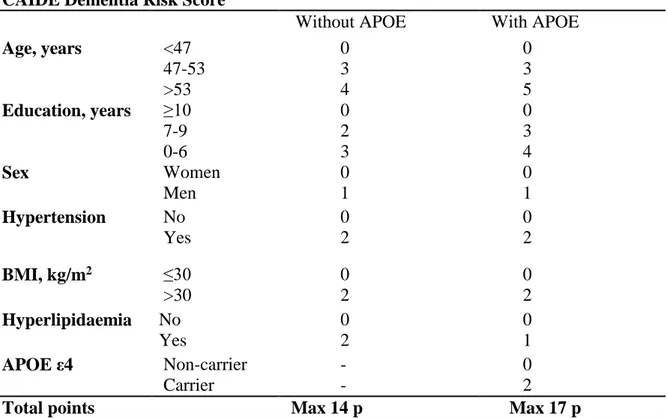
The CAIDE Dementia Risk Score was calculated for each patient using data from the baseline visit (first referral to the Memory Clinic). Points were given for elevated total cholesterol or systolic blood pressure if the patient had a diagnosis and received treatment for hyperlipidaemia or hypertension. No systematically collected data were available for leisure time physical activity, and this variable was not included in the risk score (Exalto et al., 2014). A second version of the risk score was calculated adding points for the presence of the APOE ε4 allele. APOE genotype was analysed from blood leucocytes using polymerase chain reaction and HhaI digestion (Tsukamoto et al., 1993) (Garcia-Ptacek et al., 2014). The maximum number of points for the CAIDE Dementia Risk Score in the present study was 14 (version without APOE) or 17 (version with APOE), one point less than in the original publication (Kivipelto et al., 2006).
2.3. CSF and MRI measurements
CSF samples were obtained in connection to the baseline visit (first referral) at the Memory Clinic. Lumbar puncture was done in the L3/L4 or L4/L5 intervertebral space, using a 25-gauge needle, and collected in 12-ml polypropylene tubes. Samples were centrifuged within two hours. CSF was aliquoted in polypropylene tubes of 0.5 or 1 ml, and stored at −80˚C until further analysis. CSF Aβ1-42, t-tau and p-tau (phosphorylated tau at threonine 181) were
measured by commercially available sandwich enzyme linked immunoabsorbent assays (ELISAs) (Innogenetics, Ghent, Belgium) as previously reported
(Kramberger et al., 2012). Memory Clinic physicians have access to CSF measurements, which may be used as supportive information for differential diagnosis in dementia cases. However, clinical diagnostic criteria always have priority due to lack of established CSF-based criteria for regular clinical practice. In the present study, patients were not selected based on CSF biomarker levels, and a researcher without clinical ties to the Memory Clinic (DE) collected data on primary clinical diagnoses (SCI, MCI, dementia). Medical record comments on CSF markers, and specific diagnostic codes for dementia types (e.g. AD dementia) were not considered. This approach also matches the original design of the CAIDE Risk Score for predicting dementia in general, without focus on specific causes of dementia.
MRI scans were performed either shortly before the referral to the Memory Clinic at different radiology departments in Stockholm region as part of the routine dementia assessment by the general practitioner or at the Department of Radiology, Karolinska University Hospital during the assessment procedure at our Memory clinic. All images were routinely collected in a common electronic database at the Department of Radiology, Karolinska University Hospital-Huddinge. Images related to the baseline visit (first referral) at the Memory Clinic were used in the present study. Because scanners and protocols were not identical in all image sources, only visual assessments were considered.
MRI visual assessments were performed by an experienced rater (LC) who was blinded to all other data. For visual assessment of medial temporal lobe atrophy (MTA), T1-weighted MRI images were oriented to oblique coronal sections. MTA was rated using the 5-point Scheltens scale ranging from 0 (no atrophy) to 4 (severe atrophy) (Scheltens et al., 1992). The MTA visual assessment included hippocampus proper, dentate gyrus, subiculum,
parahippocampal gyrus, entorhinal cortex and surrounding CSF spaces such as the temporal horns and choroid fissure. White matter changes WMC were assessed on transverse FLAIR images according to the modified 4-point Fazekas scale ranging from 0 (no WMC) to 3 (large confluent WMC) (Fazekas et al., 1987). Frontal lobe atrophy was assessed on a FLAIR sequence according to the 4-point scale for global cortical atrophy–frontal subscale (GCA-F) ranging from 0 (no atrophy) to 3 (severe ‘knife blade’ atrophy) (Pasquier et al., 1996). Parietal atrophy (PA) was visually assessed by combining T1 weighted sagittal, T1 weighted coronal and axial FLAIR sequences, using Koedam score (Koedam et al., 2011), a 4 points scale ranging from 0 (no atrophy) to 3 (severe atrophy).
2.4. Statistical analysis
Between-group comparisons were made using parametric (Student’s t-tests) or non-parametric tests (chi-square tests, Mann- Whitney) as appropriate. CAIDE Dementia Risk Score was categorized into three groups of relatively similar size: 0-5 points (lower risk, n=301 patients), 6-7 points (intermediate risk, n=214) and 8-14 points (higher risk, n=209) for the version without APOE; and 0-6 points (lower risk, n=81 patients), 7-8 points (intermediate risk, n=98) and 9-17 points (higher risk, n=131) for the version with APOE. The lower risk category was used as reference in all analyses.
Based on recent studies suggesting that combinations of CSF biomarkers may be more accurate indicators of Alzheimer’s disease(Duits et al., 2014)(Leuzy et al., 2015), the Aβ 1-42/t-tau and Aβ1-42/p-tau181 ratios were calculated. Zero-skewness log-transformation was applied to Aβ1-42, t-tau, p-tau181, and Aβ1-42/t-tau and Aβ1-42/p-tau181 ratios. Linear regression models with CSF markers as dependent variables were used to investigate associations with CAIDE Dementia Risk Score. Results are shown as standardized beta-coefficients
(p-values). Ordinal regression was used to explore associations between visual assessment scales on MRI and CAIDE Dementia Risk Score. MTA was visually assessed for right and left hemisphere separately, and the mean MTA score was used in analyses (Pereira et al., 2014). Due to the smaller number of patients with higher MTA ratings, patients with mean MTA scores 2.5, 3 and 4 were grouped together. Results are shown as OR (95% CI). Stratified analyses were conducted according to diagnosis (SCI or MCI).
The performance of the CAIDE Dementia Risk Score (versions without and with APOE) in predicting dementia was assessed in patients with available follow-up data (n=324). Results are reported as area under the receiver operating characteristics curve (AUC) and 95% confidence interval (95% CI). Sensitivity, specificity, likelihood ratios for positive and negative tests and their 95% confidence intervals were also calculated. To account for missing follow-up data, additional analyses were conducted: 1) assuming that patients without planned follow-up did not develop dementia; and 2) assuming that MCI patients without planned follow-up developed dementia.
The level of statistical significance was set to p<0.05 in all analyses. Statistical analyses were performed with SPSS software version 22.0. Analyses of the performance of the CAIDE Dementia Risk Score in predicting dementia were conducted using the diagt and roctab commands in Stata software version 13, and rocgold was used to compare the risk score versions with and without APOE.
3. Results
Formation of the study population is shown in Figure 1. The study included 724 patients with MCI and SCI, of which 310 had available data on APOE genotype, and 529 had available MRI scans. Characteristics of the study population are shown in Table 2. Median (range) for the CAIDE risk score version without APOE was 6 (0-14), and 301 (41.6%)
patients had lower dementia risk (0-5 points), 214 (29.6%) intermediate risk (6-7 points) and 209 (28.9%) higher dementia risk (8-14 points). Median (range) for the CAIDE risk score version with APOE was 8 (0-17), and 81 (26.1%) patients had lower dementia risk (0-6 points), 98 (31.6%) intermediate risk (7-8 points) and 131 (42.3%) higher dementia risk (9-17 points).
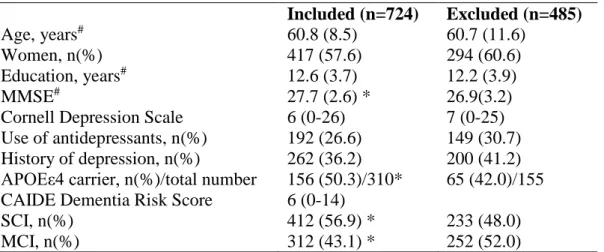
Table 3 shows the characteristics of the study population compared to patients who did not fulfil inclusion criteria. Excluded patients had significantly lower MMSE scores, were less likely to be APOEε4 carriers, less likely to be diagnosed with SCI and more likely to be diagnosed with MCI.
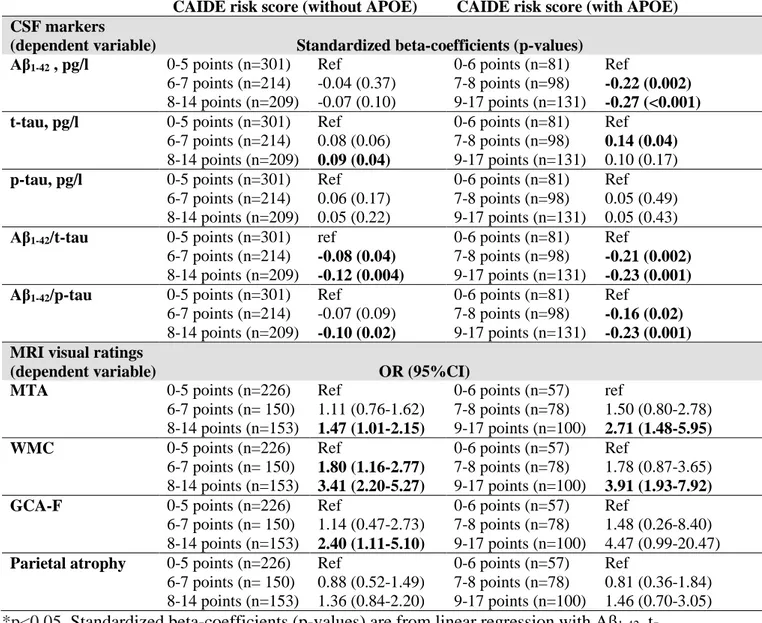
Associations between CAIDE Dementia Risk Score and CSF markers are shown in Table 4. Compared to patients with lower risk (0-5 points) on CAIDE Dementia Risk Score version without APOE, patients with intermediate risk (6-7 points) and higher risk (8-14 points) had higher CSF t-tau and lower Aβ1-42/t-tau and Aβ1-42/p-tau181 ratios. For the CAIDE Dementia Risk Score including APOE genotype, both intermediate (7-8 points) and higher (9-17 points) risk groups had significantly lower CSF Aβ1-42and lower Aβ1-42/t-tau and Aβ1-42 /p-tau181 ratios. The association with higher CSF t-tau was significant for the intermediate but not the higher risk group (Table 4). No significant associations were found with CSF p-tau levels.
Table 4 shows associations between CAIDE Dementia Risk Score and MRI visual ratings. Compared to patients with lower dementia risk (0-5 points) on CAIDE Dementia Risk Score version without APOE, patients with intermediate risk (6-7 points) and higher risk (8-14 points) had significantly more severe WMC. For the CAIDE Dementia Risk Score including APOE genotype, the association with more severe WMC was significant in the higher risk group (9-17 points). More severe MTA was found in the higher risk group compared to the lower risk group for both CAIDE Dementia Risk Score versions (without and with APOE).
Patients in the higher risk group (both risk score versions) were also more likely to have higher GCA-F ratings. No significant associations were found with parietal atrophy ratings. Additional analyses were conducted stratifying for diagnosis group (SCI and MCI separately) (data not shown). In SCI patients, no significant associations were found between CAIDE Dementia Risk Score versions and CSF markers. However, the higher risk group (both risk score versions) had significantly more severe WMC. In MCI patients, the intermediate and higher risk groups according to both CAIDE Dementia Risk Score versions had more severe Aβ and tau pathology (CSF markers). Patients with MCI and higher dementia risk according to both risk score versions had significantly more severe WMC on MRI.
The performance of CAIDE Dementia Risk Score versions in predicting dementia in patients with planned follow-up after at least one year is shown in Table 5. AUCs (95% CIs) were 0.64 (0.56-0.73) for the version with APOE, 0.58 (0.56-0.73) for the version without APOE, and 0.61 (0.53-0.68) for APOE alone. Comparison of ROC areas was conducted in 168 patients with verified follow-up and available data on both APOE and CAIDE score: CAIDE Dementia Risk Score version with APOE seemed to be significantly better than the version without APOE (p=0.049); neither version was significantly different than APOE alone (p>0.4). The version with APOE had good sensitivity in predicting dementia, but poor specificity. Results from additional analyses accounting for missing follow-up data are shown in supplementary tables S1 and S2.
4. Discussion
This is the first study assessing associations of CAIDE Dementia Risk Score with CSF and MRI markers for neurodegeneration and amyloid deposition, as well as the performance of the risk score in predicting dementia in memory clinic patients with SCI and MCI. A higher
risk level according to the CAIDE Dementia Risk Score (version with APOE) was associated with lower Aβ1-42, higher t-tau, lower Aβ1-42/t-tau and Aβ1-42/p-tau181 ratios, and more severe MTA and WMC at baseline. The CAIDE Dementia Risk Score version without APOE showed a similar pattern of associations, although these were somewhat weaker, and the relation to Aβ1-42 was not significant. In addition, an association with frontal lobe atrophy was found only for the risk score version without APOE. Neither risk score version had any relation to p-tau levels and parietal atrophy. These results are in line with recent findings from a population-based study where higher CAIDE Dementia Risk Score in midlife was associated with more severe WMC and MTA up to 30 years later
(Vuorinen et al., 2015).
Aβ deposition and NFT are the histopathological hallmarks of AD. According to Braak & Baak stages, extracellular Aβ deposition begins in the frontal lobe, while NFT appear first subcortically in the entorhinal cortex and medial temporal lobe (Braak and Braak, 1991). The hypothetical model of dynamic biomarkers in AD suggests that Aβ and tau pathologies can begin independently from each other, and both are necessary but not sufficient to produce clinical symptoms of AD (Jack et al., 2013). Other pathologies (e.g. small vessel disease, Lewy body accumulation) (Nelson et al., 2010), genetic factors, and brain resilience or cognitive reserve are also important. CSF t-tau and p-tau, and MTA on MRI are considered markers of neurodegeneration, and they have been associated with NFT burden (Jack et al., 2013). Atrophy of the medial temporal lobe is a common finding in sporadic AD, while more pronounced frontal or parietal lobe atrophy tend to be present primarily in atypical forms of AD, or early onset AD (Lam et al., 2013). Importantly, Aβ and tau often coexists with cerebrovascular pathology, particularly small vessel disease (Prins and Scheltens, 2015), and interactions between the two pathology types have been described (Kester et al., 2014). WMC are common at older ages, are often found in AD (Prins and
Scheltens, 2015), and may potentiate the effects of cortical atrophy on cognitive impairment (Zi et al., 2014).
Because CAIDE Dementia Risk Score is mainly based on vascular risk factors, the association with WMC is not surprising. In addition, midlife hypertension and hypercholesterolemia have been associated with increased risk of AD neuropathology in previous population-based autopsy studies (Petrovitch et al.) (Toledo et al., 2013), while obesity has been related to lower brain volumes on MRI (Willette and Kapogiannis, 2015). Cardiovascular risk factors, confluent white matter lesions, MTA and central atrophy have been shown to increase the AD-likelihood of SCI subjects (Garcia-Ptacek et al., 2014). The association of lower Aβ1-42 with higher CAIDE Dementia Risk Score including APOE (but not the risk score version without APOE) could be explained by the well-known contribution of the APOE ε4 allele to Aβ deposition and neurodegeneration (Liu et al., 2013). APOE ε4 seems to be related to increased Aβ deposition independently of cognitive performance (e.g. normal cognition or MCI) (Risacher et al., 2013).
Although the APOE ε4 allele is the strongest known genetic risk factor for dementia, adding APOE genotype to the midlife CAIDE Dementia Risk Score did not improve the ability to predict dementia 20 years later in the general population (Kivipelto et al., 2006). However, in the present study the CAIDE Dementia Risk Score version with APOE seemed to perform better than the version without APOE in predicting dementia in memory clinic patients with SCI and MCI. The ability of the CAIDE Dementia Risk Score to predict dementia short-term (up to seven years) in memory clinic patients was nevertheless lower than the ability to predict dementia long-term (20-40 years) in a middle-aged general population where AUC (95%CI) was 0.77 (0.71–0.83) (Kivipelto et al., 2006) (Exalto et al., 2014). Although performance of CAIDE Risk Score versions did not seem to be different from APOE alone
in the present study, the CAIDE Risk Score version including APOE has the advantage of additionally including modifiable risk factors that can be targeted with preventive interventions (e.g. lifestyle and vascular risk monitoring).
In the present study cut-offs were 1 point lower than in the original publication (Kivipelto et al., 2006), but they were chosen to be higher than for points given for age alone. Sensitivity remained high in the memory clinic population (above 80% for the version including APOE), but specificity was lower. The risk score may thus be useful for identifying individuals with higher dementia risk who could benefit more from preventive lifestyle interventions and vascular and metabolic risk management, similarly to the selection of participants in the successful FINGER prevention trial (Ngandu et al., 2015).
Risk profiles for dementia have been shown to differ between midlife and older ages (Kivipelto et al., 2006) (Barnes et al., 2009). Blood pressure, BMI and cholesterol tend to decline after midlife in individuals who develop dementia later on (Solomon et al., 2014). The CAIDE Dementia Risk Score was formulated based on a midlife risk profile (mean population age around 50 years) (Kivipelto et al., 2006). The Memory clinic at Karolinska University Hospital Huddinge is known to have a relatively young population of patients (Andersson, 2007), with a mean age of 61 years in the present study. However, patients in most memory clinics tend to be older, and a late-life risk score for shorter-term dementia prediction may work better in this type of population (e.g. modifying the list of vascular and lifestyle factors included in the score, and the number of points given to each factor). The present study has a number of methodological limitations. First, associations between CAIDE Dementia Risk Score, CSF and MRI markers could only be evaluated cross-sectionally at baseline because data on risk factors prior to the memory clinic referral were not available. Second, physical activity was not routinely assessed, and could not be used for calculating CAIDE Dementia Risk Score according to the original versions. Reduced
physical activity has been associated with Aβ deposition and neurodegeneration (Brown et al., 2013). However, the CAIDE Dementia Risk Score version used in the present study is the same as in a previous validation study which did not include physical activity (Exalto et al., 2014). Third, the study population consisted of memory clinic patients, who have a more advanced stage of Aβ pathology, neuronal injuries, or small vessel pathology, and an increased prevalence of the APOE ε4 allele compared to the general population (Garcia-Ptacek et al., 2014). Associations with CSF markers of Aβ deposition and neurodegeneration cannot thus be extrapolated to the general population based on the present study. However, the associations with MTA and WMC on MRI found in memory clinic patients are in line with a previous population-based longitudinal study (Vuorinen et al., 2015). Fourth, follow-up data on dementia development after more than one year was available only for patients considered to have a high risk of cognitive and functional decline after the initial comprehensive assessments. According to the routine Memory clinic protocol, if follow-up beyond one year is not considered necessary in a patient with SCI or MCI, the general practitioner (or referring physician) is instructed to send a new referral if there are signs of cognitive decline. We have tried to account for missing data by conducting additional analyses of dementia prediction performance based on this protocol (assuming that patients without follow-up did not develop dementia), and also considering the progression of MCI to dementia (assuming that all MCI patients without planned follow-up developed dementia). CAIDE Dementia Risk Score is not used for risk assessment at the Memory clinic, thus circularity was avoided.
5. Conclusions
A higher CAIDE Dementia Risk Score, particularly the version including APOE genotype, tends to identify patients who are more likely to have brain pathology (e.g.
neurodegeneration, Aβ deposition, and/or cerebrovascular changes). This suggests that the previously shown ability of the CAIDE Dementia Risk Score to predict dementia may be explained by its links to AD/neurodegenerative and/or cerebrovascular pathological processes. The CAIDE Dementia Risk Score version including APOE seems to be better at predicting dementia up to 7 years later in memory clinic patients compared to the version without APOE. The risk score does not perform as well in a memory clinic setting as it does in the general population, particularly due to lower specificity. However, high sensitivity could make the risk score useful for identifying patients with higher risk who may benefit most from preventive lifestyle interventions. This is particularly important in a memory clinic setting because no therapeutic measures are currently available for patients with SCI or MCI. However, the risk score should not be used as a diagnostic tool (it was not designed to predict or diagnose specific types of dementia), or for excluding dementia development within short-term. An adjusted prediction model for use in older memory clinic patients with SCI and MCI should be formulated in future studies to test whether the dementia prediction performance of the CAIDE Risk Score can be improved.
Acknowledgements
The authors thank all participants in this study. The study was supported by Demensfonden Forskningsstipendier, Stiftelsen Dementia, Gun och Bertil Stohnes stiftelse, Sheikha Salama bint Hamdan Al Nahyan Foundation, Academy of Finland (grants 287490 and 294061), CIMED and EiT Health.
Table 1. CAIDE Dementia Risk Score versions used in the study
CAIDE Dementia Risk Score
Without APOE With APOE
Age, years <47 47-53 >53 0 3 4 0 3 5 Education, years ≥10 7-9 0-6 0 2 3 0 3 4 Sex Women Men 0 1 0 1 Hypertension No Yes 0 2 0 2 BMI, kg/m2 ≤30 >30 0 2 0 2 Hyperlipidaemia No Yes 0 2 0 1 APOE ε4 Non-carrier Carrier - - 0 2
Total points Max 14 p Max 17 p
CAIDE: Cardiovascular Risk Factors, Aging and Dementia Study, BMI: body mass index, APOE: apolipoprotein E genotype
Table 2. Baseline characteristics of the study population
All (n=724) APOE genotype available (n=310)
Age, years* 60.8 (8.5) 61.2 (7.7)
Women, n (%) 417 (57.6) 193 (62.3)
Education, years* 12.5 (3.7) 12.5 (3.7)
CAIDE Dementia Risk Score 6 (0-14) 8 (0-17)
Hyperlipidaemia, n(%) 201 (27.8) 97 (31.3) Hypertension, n(%) 246 (34.0) 108 (34.8) BMI, kg/m2* 26.2 (4.1) 26.3 (4.2) MMSE* 27.7 (2.6) 27.6 (2.6) APOE ε4 carrier, n(%) - 156 (50.3) SCI, n (%) 412 (56.9) 163 (52.6) MCI, n(%) 312 (43.1) 147 (47.4)
Cornell Depression Scale 6 (0-26) 6 (0-24)
Antidepressant treatment, n (%) 192 (26.5) 79 (25.5) History of depression, n (%) 261 (36.0) 109 (35.2) CSF markers Aβ1-42, ng/L 855 (56-1920) 821.5 (56-1680) t-tau, ng/L 240.5 (41-1030) 254 (41-1030) p-tau, ng/L 51 (16-183) 53 (16-183) Aβ1-42/t-tau * 3.91 (2.3) 3.70 (2.5) Aβ1-42/p-tau181 18.22 (8.9) 16.90 (8.8)
MRI visual ratings n=529 n=235
MTA 1 (0-4) 1 (0-4) GCA-F 0 (0-1) 0 (0-1) Parietal atrophy 0 (0-2) 0 (0-2) WMC 1 (0-3) 1 (0-3) Follow-up Planned follow-up, n (%) 324(44.8) 168 (54.2)
Follow up years mean (SD) 2.90 (1.6) 3.00 (1.6)
Conversion to dementia n (%) 100 (13.8) 55 (17.7)
Values are medians (range) unless otherwise specified. *Values are means (SD). CAIDE: Cardiovascular Risk Factors, Aging and Dementia Study, BMI: body mass index, SCI: subjective cognitive impairment, MCI: mild cognitive impairment, MMSE: Mini-mental State Examination, APOE: apolipoprotein E genotype, Aβ1-42: amyloid β1-42, t-tau: total tau, p-tau181: phosphorylated tau at threonine 181, MTA: medial temporal lobe atrophy (mean MTA scores of both hemispheres) , GCA-F : global cortical atrophy frontal subscale, parietal atrophy: Koedam score for parietal atrophy, WMC: white matter changes measured with Fazekas scale for white matter changes
Table 3. Included versus excluded patients Included (n=724) Excluded (n=485) Age, years# 60.8 (8.5) 60.7 (11.6) Women, n(%) 417 (57.6) 294 (60.6) Education, years# 12.6 (3.7) 12.2 (3.9) MMSE# 27.7 (2.6) * 26.9(3.2)
Cornell Depression Scale 6 (0-26) 7 (0-25)
Use of antidepressants, n(%) 192 (26.6) 149 (30.7)
History of depression, n(%) 262 (36.2) 200 (41.2)
APOEε4 carrier, n(%)/total number 156 (50.3)/310* 65 (42.0)/155
CAIDE Dementia Risk Score 6 (0-14)
SCI, n(%) 412 (56.9) * 233 (48.0)
MCI, n(%) 312 (43.1) * 252 (52.0)
Values are medians (range) unless otherwise specified. #Values are means (SD). *p<0.05; P-values for the comparisons between excluded and included patients were based on t-test, Mann-Whitney, Chi Squared tests as appropriate. SCI: subjective cognitive impairment, MCI: mild cognitive impairment, MMSE: Mini-mental State Examination, APOE: apolipoprotein E genotype, CAIDE: Cardiovascular Risk Factors, Aging and Dementia Study
Table 4. Associations of CAIDE Dementia Risk Score with CSF and MRI markers at
baseline
CAIDE risk score (without APOE) CAIDE risk score (with APOE)
CSF markers
(dependent variable) Standardized beta-coefficients (p-values)
Aβ1-42 , pg/l 0-5 points (n=301) Ref 0-6 points (n=81) Ref
6-7 points (n=214) -0.04 (0.37) 7-8 points (n=98) -0.22 (0.002)
8-14 points (n=209) -0.07 (0.10) 9-17 points (n=131) -0.27 (<0.001)
t-tau, pg/l 0-5 points (n=301) Ref 0-6 points (n=81) Ref
6-7 points (n=214) 0.08 (0.06) 7-8 points (n=98) 0.14 (0.04)
8-14 points (n=209) 0.09 (0.04) 9-17 points (n=131) 0.10 (0.17)
p-tau, pg/l 0-5 points (n=301) Ref 0-6 points (n=81) Ref
6-7 points (n=214) 0.06 (0.17) 7-8 points (n=98) 0.05 (0.49) 8-14 points (n=209) 0.05 (0.22) 9-17 points (n=131) 0.05 (0.43)
Aβ1-42/t-tau 0-5 points (n=301) ref 0-6 points (n=81) Ref
6-7 points (n=214) -0.08 (0.04) 7-8 points (n=98) -0.21 (0.002)
8-14 points (n=209) -0.12 (0.004) 9-17 points (n=131) -0.23 (0.001)
Aβ1-42/p-tau 0-5 points (n=301) Ref 0-6 points (n=81) Ref
6-7 points (n=214) -0.07 (0.09) 7-8 points (n=98) -0.16 (0.02)
8-14 points (n=209) -0.10 (0.02) 9-17 points (n=131) -0.23 (0.001)
MRI visual ratings
(dependent variable) OR (95%CI)
MTA 0-5 points (n=226) Ref 0-6 points (n=57) ref
6-7 points (n= 150) 1.11 (0.76-1.62) 7-8 points (n=78) 1.50 (0.80-2.78) 8-14 points (n=153) 1.47 (1.01-2.15) 9-17 points (n=100) 2.71 (1.48-5.95)
WMC 0-5 points (n=226) Ref 0-6 points (n=57) Ref
6-7 points (n= 150) 1.80 (1.16-2.77) 7-8 points (n=78) 1.78 (0.87-3.65) 8-14 points (n=153) 3.41 (2.20-5.27) 9-17 points (n=100) 3.91 (1.93-7.92)
GCA-F 0-5 points (n=226) Ref 0-6 points (n=57) Ref
6-7 points (n= 150) 1.14 (0.47-2.73) 7-8 points (n=78) 1.48 (0.26-8.40) 8-14 points (n=153) 2.40 (1.11-5.10) 9-17 points (n=100) 4.47 (0.99-20.47)
Parietal atrophy 0-5 points (n=226) Ref 0-6 points (n=57) Ref
6-7 points (n= 150) 0.88 (0.52-1.49) 7-8 points (n=78) 0.81 (0.36-1.84) 8-14 points (n=153) 1.36 (0.84-2.20) 9-17 points (n=100) 1.46 (0.70-3.05)
*p<0.05, Standardized beta-coefficients (p-values) are from linear regression with Aβ1-42, t-tau and p- t-tau as dependent variable. Odds Ratios and 95% Confidence interval (OR and 95% CI) are from ordinal logistic regression with MTA, WMC, CGA-F and parietal atrophy as dependent variable. CAIDE: Cardiovascular Risk Factors, Aging and Dementia Study, Aβ1-42: amyloid β1-42, t-tau: total tau, p-tau181: phosphorylated tau at threonine 181 MTA: medial temporal lobe atrophy (mean MTA scores of both hemispheres), GCA-F global cortical atrophy frontal subscale, parietal atrophy – Koedam score for parietal atrophy, WMC: white matter changes measured with Fazekas scale for white matter changes, APOE: apolipoprotein E genotype
Table 5. Performance of the CAIDE Dementia Risk Score in predicting dementia
Cut-off Sensitivity (95%CI) Specificity (95%CI) LR + (95%CI) LR- (95%CI) AUC (95%CI) CAIDE Dementia Risk Score (version without APOE)
4/5 82.0 (73.1-89.0) 26.3 (20.7-32.6) 1.11 (0.99-1.26) 0.68 (0.43-1.10)
0.58 (0.51-0.65) 5/6 70.0 (60.0-78.8) 41.5 (35.0-48.3) 1.20 (1.01-1.42) 0.72 (0.52-1.01)
6/7 51.0 (40.8-61.1) 60.3 (53.5-66.7) 1.28 (1.00-1.65) 0.81 (0.65-1.02) 7/8 39.0 (29.4-49.3) 72.8 (66.4-78.5) 1.43 (1.03-1.98) 0.84 (0.70-1.00)
CAIDE Dementia Risk Score (version with APOE)
5/6 96.4 (87.5-99.6) 15.0 (9.0-23.0) 1.13 (1.03-1.24) 0.24 (0.06-1.01) 0.64 (0.56-0.73) 6/7 92.7 (82.4-98.0) 27.4 (19.5-36.6) 1.28 (1.12-1.46) 0.27 (0.10-0.71) 7/8 83.6 (71.2-92.2) 42.5 (33.2-51.2) 1.45 (1.19-1.77) 0.39 (0.20-0.73) 8/9 60.0 (45.9-73.0) 61.1 (51.4-70.1) 1.54 (1.12-2.11) 0.66 (0.46-0.93) APOE alone 0/1 69.1 (55.2-80.9) 52.2 (42.6-61.7) 1.45 (1.11-1.88) 0.59 (0.38-0.91) 0.61 (0.53-0.68) CAIDE: Cardiovascular Risk Factors, Aging and Dementia Study, LR+: likelihood ratio for positive test, LR-: likelihood ratio for negative test, APOE: apolipoprotein E genotype
References:
Andersson, C., 2007. Predictors of cognitive decline in memory clinic patients.
Barnes, D.E., Beiser, A.S., Lee, A., Langa, K.M., Koyama, A., Preis, S.R., Neuhaus, J., McCammon, R.J., Yaffe, K., Seshadri, S., Haan, M.N., Weir, D.R., 2014.
Development and validation of a brief dementia screening indicator for primary care. Alzheimers. Dement. 10, 656–665.e1. doi:10.1016/j.jalz.2013.11.006
Barnes, D.E., Covinsky, K.E., Whitmer, R.A., Kuller, L.H., Lopez, O.L., Yaffe, K., 2009. Predicting risk of dementia in older adults: The late-life dementia risk index.
Neurology 73, 173–9. doi:10.1212/WNL.0b013e3181a81636
Braak, H., Braak, E., 1991. Neuropathological stageing of Alzheimer-related changes. Acta Neuropathol. 82, 239–259.
Brown, B.M., Peiffer, J.J., Taddei, K., Lui, J.K., Laws, S.M., Gupta, V.B., Taddei, T., Ward, V.K., Rodrigues, M.A., Burnham, S., Rainey-Smith, S.R., Villemagne, V.L., Bush, A., Ellis, K.A., Masters, C.L., Ames, D., Macaulay, S.L., Szoeke, C., Rowe, C.C., Martins, R.N., 2013. Physical activity and amyloid-β plasma and brain levels: results from the Australian Imaging, Biomarkers and Lifestyle Study of Ageing. Mol. Psychiatry 18, 875–81. doi:10.1038/mp.2012.107
Buratti, L., Balestrini, S., Altamura, C., Viticchi, G., Falsetti, L., Luzzi, S., Provinciali, L., Vernieri, F., Silvestrini, M., 2015. Markers for the risk of progression from mild cognitive impairment to Alzheimer’s disease. J. Alzheimers. Dis. 45, 883–90. doi:10.3233/JAD-143135
Duits, F.H., Teunissen, C.E., Bouwman, F.H., Visser, P.-J., Mattsson, N., Zetterberg, H., Blennow, K., Hansson, O., Minthon, L., Andreasen, N., Marcusson, J., Wallin, A., Rikkert, M.O., Tsolaki, M., Parnetti, L., Herukka, S.-K., Hampel, H., De Leon, M.J., Schröder, J., Aarsland, D., Blankenstein, M.A., Scheltens, P., van der Flier, W.M., 2014. The cerebrospinal fluid “Alzheimer profile”: easily said, but what does it mean? Alzheimers. Dement. 10, 713–723.e2. doi:10.1016/j.jalz.2013.12.023
Enache, D., Depression in Alzheimer’s disease : biomarkers and treatment. In: Assessment program, Karolinska Institutet: Publishing Inc, Sweden; 2015, pages 46-50
Exalto, L.G., Quesenberry, C.P., Barnes, D., Kivipelto, M., Biessels, G.J., Whitmer, R.A., 2014. Midlife risk score for the prediction of dementia four decades later. Alzheimers. Dement. 10, 562–70. doi:10.1016/j.jalz.2013.05.1772
Fazekas, F., Chawluk, J., Alavi, A., Hurtig, H., Zimmerman, R., 1987. MR signal
abnormalities at 1.5 T in Alzheimer’s dementia and normal aging. Am. J. Roentgenol. 149, 351–356. doi:10.2214/ajr.149.2.351
Garcia-Ptacek, S., Cavallin, L., Kåreholt, I., Kramberger, M.G., Winblad, B., Jelic, V., Eriksdotter, M., 2014. Subjective cognitive impairment subjects in our clinical practice. Dement. Geriatr. Cogn. Dis. Extra 4, 419–30. doi:10.1159/000366270 Jack, C.R., Knopman, D.S., Jagust, W.J., Petersen, R.C., Weiner, M.W., Aisen, P.S.,
Shaw, L.M., Vemuri, P., Wiste, H.J., Weigand, S.D., Lesnick, T.G., Pankratz, V.S., Donohue, M.C., Trojanowski, J.Q., 2013. Tracking pathophysiological processes in Alzheimer’s disease: an updated hypothetical model of dynamic biomarkers. Lancet. Neurol. 12, 207–16. doi:10.1016/S1474-4422(12)70291-0
Petersen, R.C., Trojanowski, J.Q., 2010. Hypothetical model of dynamic biomarkers of the Alzheimer’s pathological cascade. Lancet Neurol. 9, 119–28.
doi:10.1016/S1474-4422(09)70299-6
Jefferson, A.L., Beiser, A.S., Himali, J.J., Seshadri, S., O’Donnell, C.J., Manning, W.J., Wolf, P.A., Au, R., Benjamin, E.J., 2015. Low cardiac index is associated with incident dementia and Alzheimer disease: the Framingham Heart Study. Circulation 131, 1333–9. doi:10.1161/CIRCULATIONAHA.114.012438
Jessen, F., Amariglio, R.E., van Boxtel, M., Breteler, M., Ceccaldi, M., Chételat, G., Dubois, B., Dufouil, C., Ellis, K.A., van der Flier, W.M., Glodzik, L., van Harten, A.C., de Leon, M.J., McHugh, P., Mielke, M.M., Molinuevo, J.L., Mosconi, L., Osorio, R.S., Perrotin, A., Petersen, R.C., Rabin, L.A., Rami, L., Reisberg, B., Rentz, D.M., Sachdev, P.S., de la Sayette, V., Saykin, A.J., Scheltens, P., Shulman, M.B., Slavin, M.J., Sperling, R.A., Stewart, R., Uspenskaya, O., Vellas, B., Visser, P.J., Wagner, M., 2014a. A conceptual framework for research on subjective cognitive decline in preclinical Alzheimer’s disease. Alzheimers. Dement. 10, 844–52. doi:10.1016/j.jalz.2014.01.001
Jessen, F., Wolfsgruber, S., Wiese, B., Bickel, H., Mösch, E., Kaduszkiewicz, H., Pentzek, M., Riedel-Heller, S.G., Luck, T., Fuchs, A., Weyerer, S., Werle, J., van den Bussche, H., Scherer, M., Maier, W., Wagner, M., 2014b. AD dementia risk in late MCI, in early MCI, and in subjective memory impairment. Alzheimers. Dement. 10, 76–83. doi:10.1016/j.jalz.2012.09.017
Kester, M.I., Goos, J.D.C., Teunissen, C.E., Benedictus, M.R., Bouwman, F.H., Wattjes, M.P., Barkhof, F., Scheltens, P., van der Flier, W.M., 2014. Associations between cerebral small-vessel disease and Alzheimer disease pathology as measured by cerebrospinal fluid biomarkers. JAMA Neurol. 71, 855–62.
doi:10.1001/jamaneurol.2014.754
Kivipelto, M., Ngandu, T., Laatikainen, T., Winblad, B., Soininen, H., Tuomilehto, J., 2006. Risk score for the prediction of dementia risk in 20 years among middle aged people: a longitudinal, population-based study. Lancet. Neurol. 5, 735–41.
doi:10.1016/S1474-4422(06)70537-3
Koedam, E.L.G.E., Lehmann, M., van der Flier, W.M., Scheltens, P., Pijnenburg, Y.A.L., Fox, N., Barkhof, F., Wattjes, M.P., 2011. Visual assessment of posterior atrophy development of a MRI rating scale. Eur. Radiol. 21, 2618–25. doi:10.1007/s00330-011-2205-4
Kramberger, M.G., Jelic, V., Kåreholt, I., Enache, D., Eriksdotter Jönhagen, M., Winblad, B., Aarsland, D., 2012. Cerebrospinal Fluid Alzheimer Markers in Depressed Elderly Subjects with and without Alzheimer’s Disease. Dement. Geriatr. Cogn. Dis. Extra 2, 48–56. doi:10.1159/000334644
Lam, B., Masellis, M., Freedman, M., Stuss, D.T., Black, S.E., 2013. Clinical, imaging, and pathological heterogeneity of the Alzheimer’s disease syndrome. Alzheimers. Res. Ther. 5, 1. doi:10.1186/alzrt155
Leuzy, A., Carter, S.F., Chiotis, K., Almkvist, O., Wall, A., Nordberg, A., 2015. Concordance and Diagnostic Accuracy of [11C]PIB PET and Cerebrospinal Fluid Biomarkers in a Sample of Patients with Mild Cognitive Impairment and Alzheimer’s Disease. J. Alzheimers. Dis. 45, 1077–88. doi:10.3233/JAD-142952
Alzheimer disease: risk, mechanisms and therapy. Nat. Rev. Neurol. 9, 106–18. doi:10.1038/nrneurol.2012.263
Maioli, F., Coveri, M., Pagni, P., Chiandetti, C., Marchetti, C., Ciarrocchi, R., Ruggero, C., Nativio, V., Onesti, A., D’Anastasio, C., Pedone, V., 2007. Conversion of mild cognitive impairment to dementia in elderly subjects: a preliminary study in a memory and cognitive disorder unit. Arch. Gerontol. Geriatr. 44 Suppl 1, 233–41. doi:10.1016/j.archger.2007.01.032
Mitchell, A.J., Beaumont, H., Ferguson, D., Yadegarfar, M., Stubbs, B., 2014. Risk of dementia and mild cognitive impairment in older people with subjective memory complaints: meta-analysis. Acta Psychiatr. Scand. 130, 439–51.
doi:10.1111/acps.12336
Nelson, P.T., Abner, E.L., Schmitt, F.A., Kryscio, R.J., Jicha, G.A., Smith, C.D., Davis, D.G., Poduska, J.W., Patel, E., Mendiondo, M.S., Markesbery, W.R., 2010. Modeling the association between 43 different clinical and pathological variables and the
severity of cognitive impairment in a large autopsy cohort of elderly persons. Brain Pathol. 20, 66–79. doi:10.1111/j.1750-3639.2008.00244.x
Ngandu, T., Lehtisalo, J., Solomon, A., Levälahti, E., Ahtiluoto, S., Antikainen, R.,
Bäckman, L., Hänninen, T., Jula, A., Laatikainen, T., Lindström, J., Mangialasche, F., Paajanen, T., Pajala, S., Peltonen, M., Rauramaa, R., Stigsdotter-Neely, A.,
Strandberg, T., Tuomilehto, J., Soininen, H., Kivipelto, M., 2015. A 2 year multidomain intervention of diet, exercise, cognitive training, and vascular risk monitoring versus control to prevent cognitive decline in at-risk elderly people (FINGER): a randomised controlled trial. Lancet 385, 2255–63. doi:10.1016/S0140-6736(15)60461-5
Pasquier, F., Leys, D., Weerts, J.G., Mounier-Vehier, F., Barkhof, F., Scheltens, P., 1996. Inter- and intraobserver reproducibility of cerebral atrophy assessment on MRI scans with hemispheric infarcts. Eur. Neurol. 36, 268–72.
Pereira, J.B., Cavallin, L., Spulber, G., Aguilar, C., Mecocci, P., Vellas, B., Tsolaki, M., Kłoszewska, I., Soininen, H., Spenger, C., Aarsland, D., Lovestone, S., Simmons, A., Wahlund, L.-O., Westman, E., 2014. Influence of age, disease onset and ApoE4 on visual medial temporal lobe atrophy cut-offs. J. Intern. Med. 275, 317–30.
doi:10.1111/joim.12148
Petersen, R.C., Caracciolo, B., Brayne, C., Gauthier, S., Jelic, V., Fratiglioni, L., 2014. Mild cognitive impairment: a concept in evolution. J. Intern. Med. 275, 214–28. doi:10.1111/joim.12190
Petrovitch, H., White, L.R., Izmirilian, G., Ross, G.W., Havlik, R.J., Markesbery, W., Nelson, J., Davis, D.G., Hardman, J., Foley, D.J., Launer, L.J.,. Midlife blood pressure and neuritic plaques, neurofibrillary tangles, and brain weight at death: the HAAS. Honolulu-Asia aging Study. Neurobiol. Aging 21, 57–62.
Prins, N.D., Scheltens, P., 2015. White matter hyperintensities, cognitive impairment and dementia: an update. Nat. Rev. Neurol. 11, 157–65. doi:10.1038/nrneurol.2015.10 Risacher, S.L., Kim, S., Shen, L., Nho, K., Foroud, T., Green, R.C., Petersen, R.C., Jack,
C.R., Aisen, P.S., Koeppe, R.A., Jagust, W.J., Shaw, L.M., Trojanowski, J.Q., Weiner, M.W., Saykin, A.J., 2013. The role of apolipoprotein E (APOE) genotype in early mild cognitive impairment (E-MCI). Front. Aging Neurosci. 5, 11.
Scheltens, P., Leys, D., Barkhof, F., Huglo, D., Weinstein, H.C., Vermersch, P., Kuiper, M., Steinling, M., Wolters, E.C., Valk, J., 1992. Atrophy of medial temporal lobes on MRI in “probable” Alzheimer’s disease and normal ageing: diagnostic value and neuropsychological correlates. J. Neurol. Neurosurg. Psychiatry 55, 967–72. Solomon, A., Mangialasche, F., Richard, E., Andrieu, S., Bennett, D.A., Breteler, M.,
Fratiglioni, L., Hooshmand, B., Khachaturian, A.S., Schneider, L.S., Skoog, I., Kivipelto, M., 2014. Advances in the prevention of Alzheimer’s disease and dementia. J. Intern. Med. 275, 229–50. doi:10.1111/joim.12178
Sperling, R.A., Aisen, P.S., Beckett, L.A., Bennett, D.A., Craft, S., Fagan, A.M., Iwatsubo, T., Jack, C.R., Kaye, J., Montine, T.J., Park, D.C., Reiman, E.M., Rowe, C.C.,
Siemers, E., Stern, Y., Yaffe, K., Carrillo, M.C., Thies, B., Morrison-Bogorad, M., Wagster, M. V, Phelps, C.H., 2011. Toward defining the preclinical stages of Alzheimer’s disease: recommendations from the National Institute on Aging-Alzheimer's Association workgroups on diagnostic guidelines for Aging-Alzheimer's disease. Alzheimers. Dement. 7, 280–92. doi:10.1016/j.jalz.2011.03.003 Toledo, J.B., Arnold, S.E., Raible, K., Brettschneider, J., Xie, S.X., Grossman, M.,
Monsell, S.E., Kukull, W.A., Trojanowski, J.Q., 2013. Contribution of
cerebrovascular disease in autopsy confirmed neurodegenerative disease cases in the National Alzheimer’s Coordinating Centre. Brain 136, 2697–706.
doi:10.1093/brain/awt188
Tsukamoto, K., Watanabe, T., Matsushima, T., Kinoshita, M., Kato, H., Hashimoto, Y., Kurokawa, K., Teramoto, T., 1993. Determination by PCR-RFLP of apo E genotype in a Japanese population. J. Lab. Clin. Med. 121, 598–602.
Vuorinen, M., Spulber, G., Damangir, S., Niskanen, E., Ngandu, T., Soininen, H.,
Kivipelto, M., Solomon, A., 2015. Midlife CAIDE dementia risk score and dementia-related brain changes up to 30 years later on magnetic resonance imaging. J.
Alzheimers. Dis. 44, 93–101. doi:10.3233/JAD-140924
WHO | First WHO Ministerial Conference on Global Action Against Dementia, n.d. Willette, A.A., Kapogiannis, D., 2015. Does the brain shrink as the waist expands? Ageing
Res. Rev. 20, 86–97. doi:10.1016/j.arr.2014.03.007
Winblad, B., Palmer, K., Kivipelto, M., Jelic, V., Fratiglioni, L., Wahlund, L.-O.,
Nordberg, A., Bäckman, L., Albert, M., Almkvist, O., Arai, H., Basun, H., Blennow, K., De Leon, M., DeCarli, C., Erkinjuntti, T., Giacobini, E., Graff, C., Hardy, J., Jack, C., Jorm, A., Ritchie, K., Van Duijn, C., Visser, P., Petersen, R.C., 2004. Mild
cognitive impairment--beyond controversies, towards a consensus: report of the International Working Group on Mild Cognitive Impairment., in: Journal of Internal Medicine. pp. 240–246.
Zi, W., Duan, D., Zheng, J., 2014. Cognitive impairments associated with periventricular white matter hyperintensities are mediated by cortical atrophy. Acta Neurol. Scand. 130, 178–187. doi:10.1111/ane.12262