POTENTIAL FOR DEMAND RESPONSE
A case study- describing the potential for electricity demand response in
Swedish grocery stores.
OSCAR ERIKSSON
ISHO SHONY
The School of Business, Society and Engineering Course: Degree Project in Industrial Engineering and Management
Course code: ERA402
Subject: Industrial economics and engineering Course Credits: 30 ECTS
Program: Master of Science in Engineering – Industrial Engineering and Management
Supervisor: Angelina Sundström, Mälardalen University Supervisor Fredrik Wallin, Mälardalen University Examiner: Peter Ekman, Mälardalen University Datum: 2016-05-27
E-post:
Isy11001@student.mdh.se Oen09004@student.mdh.se
Abstract – “Potential for demand response - A case study, describing the potential for electricity demand response in Swedish grocery stores”
Date: May 27th 2016
Level: Degree Project in Industrial Engineering and Management, 30 ECTS Institution: School of Business, Society and Engineering, Mälardalen University
Authors: Oscar Eriksson Isho Shony
900831-0519 910520-6719
Title: Potential for demand response - A case study, describing the potential for electricity demand response in Swedish grocery stores
Tutor: Angelina Sundström, Fredrik Wallin at Future Energy Center, Mälardalen University
Keywords: Electricity, Demand response (DR), Grocery stores, ICA
Research questions: How does the characteristics of technical equipment in combination with operational conditions influence the potential for electricity demand response in grocery stores?
Purpose: The purpose with this study is to describe the potential for demand response in grocery stores by identifying technical characteristics and investigating the operational conditions within the businesses.
Method: The study was of qualitative character in form of case study with ICA Gruppen as study-object. Three data sources have been used for gathering the empirical material: interviews, observations and documents. Interviews were conducted with ICA’s energy strategist and four store managers representing the four different store formats: ICA Nära, ICA Supermarket, ICA Kvantum and ICA Maxi. Two parameters were of interest concerning the observations, defrosting of refrigeration systems and temperatures in freezers and refrigerators. The documents received from the respondents were in form of internal energy-reports including key-indicators over electricity consumption.
Conclusion: The analysis indicate that the technical prerequisites enable the
application of DR activities in a large scale while the core business and operation of the stores act as boundaries, determining which of the DR activities could be implemented and to what extent such activities are allowed to cause disruption to the business. Furthermore, the study identified potential DR actions that can be implemented to promote DR utilizing available controlling systems in refrigeration, lighting, and HVAC-system.
Sammanfattning – –”Potential för förbrukningsflexibilitet- Fallstudie, potential för elförbrukningsflexibilitet inom livsmedelsbutiker”
Datum: 26 maj, 2016
Nivå: Examensarbete i industriell ekonomi, 30 ECTS Institution: Akademin för Ekonomi, Samhälle och Teknik, EST,
Mälardalens Högskola
Författare: Oscar Eriksson Isho Shony
900831-0519 910520-6719
Titel: Potential för förbrukningsflexibilitet- Fallstudie, potential för elförbrukningsflexibilitet inom livsmedelsbutiker.
Handledare: Angelina Sundström, Fredrik Wallin på Future Enegy Center, Mälardalens Högskola
Nyckelord: Elektricitet, Elförbrukningsflexibilitet, livsmedelsbutiker, ICA Frågeställning: Hur formar egenskaper hos tekniska system i kombination med
driftförhållanden potentialen för elförbrukningsflexibilitet i livsmedelsbutiker?
Syfte: Syftet med uppsatsen är att beskriva potentialen för elförbrukningsflexibilitet i livsmedelsbutiker genom att identifiera tekniska egenskaper och undersöka
driftsförhållanden inom verksamheten.
Metod: Studien var av kvalitativ karaktär i form av fallstudie där ICA utgjorde studie-objektet. Datainsamlingen baserades på tre data källor: intervjuer, observation och dokument. Respondenter som intervjuades var bestående av ICAs energi strateg och fyra butikschefer en från respektive butiksformat: ICA Nära, Supermarket, Kvantum och Maxi. Gällande observationer fokus låg på avfrostning av kylsystem och temperaturer i kyl- och frysdiskarna. Interna energi-rapporter med nyckeltal över butikernas elanvändning utgjorde en kompletterande källa för datainsamlingen.
Slutsats: Studien visade att de tekniska egenskaperna ger upphov till elförbrukningsflexibilitetpotential där driftförhållanden avgör till vilken utsträckning denna potential tillåts att påverka kärnverksamheten. Studien resulterade i en kartläggning av möjliga åtgärder som kan implementeras inom ramen för elförbrukningsflexibilitet baserad på tillgängliga
PREFACE
We would like to attribute special thanks to all who participated and contributed to this study. Firstly, we owe our deepest gratitude to all Store Managers for all inputs received and for the ability to observe their operations. We are also very thankful to ICA’s Energy
Strategist for received inputs and continuous support during the study.
Special thanks to Fredrik Wallin and Tommy Kovala at Future Energy Center, Mälardalen University, whom gave us the idea for this study and provided valuable feedback during the process. Also, a special thanks to our supervisor Angelina Sundström whom guided us throughout our thesis with her patience and knowledge.
Finally yet importantly, we would like to thank our colleges and friends for helping us to resolve the problems and provide us with many good ideas.
We dedicate this thesis to our families who have been tireless in providing us with their love and moral support during the difficult times and different phases of our life.
Västerås May 27th, 2016
Oscar Eriksson Isho Shony
TABLE OF CONTENTS 1 Introduction ... 1 Problem statement ... 3 Purpose ... 4 Research question... 4 Disposition ... 5 2 Theoretical framework ... 6 Demand response ... 6 2.1.1 DR-programs ... 7 2.1.2 DR-approach ...8 2.1.3 Load characterization ... 9 2.1.4 Degree of control ... 10 2.1.5 Benefits ... 11 2.1.6 Driving forces ... 12 2.1.7 Challenges ... 12 Grocery stores ... 13 2.2.1 Store formats ... 13 2.2.2 Electricity consumption ... 14 Technical characteristics ... 15 2.3.1 Commercial refrigeration ... 15 2.3.2 Lighting ... 22 2.3.3 HVAC-system ... 25 Operational characteristics ... 26 2.4.1 Opening hours ... 27 2.4.2 Operating time ... 27 2.4.3 Food legislation ... 27 2.4.4 Illumination requirements ... 28
2.4.5 Ventilation and air quality regulations ... 29
DR-controlling strategies ... 29
2.5.1 HVAC- controlling strategies ... 29
2.5.2 Lightning-controlling strategies... 32
Summary ... 35
3 Methodology ... 37
Research approach ... 37
Theoretical framework ... 37
Research design ...38
Selected grocery stores ... 39
Data collection ... 40
Presentation of interviewees ... 41
Semi –structured interviews ... 41
3.7.1 Operationalization of the questions in the interview guide-key person ... 42
3.7.2 Operationalization of the questions in the interview guide -Store managers ... 43
Observations ... 44
Documents ... 46
Analysis of empirical data ... 46
Research quality ... 47
4 The ica perspective on demand response potential ... 49
Energy strategist overview ... 49
4.1.1 Store formats ... 49 4.1.2 Range of goods ...50 4.1.3 Opening hours ...50 4.1.4 Energy policy ...50 4.1.5 Electrical equipment ... 51 4.1.6 Electricity consumption ... 51 4.1.7 Operation time ... 52 4.1.8 Controlling systems ... 53
Store formats profiles ... 54
4.2.1 Key-indicators ... 54
4.2.2 Design and control of the lighting system ... 55
4.2.3 Refrigeration management ... 56
4.2.4 Maintenance and control of the HVAC system ... 57
4.2.6 Refrigeration a system with continuous character ... 60
4.2.7 Two starting up methods for HVAC system ... 60
4.2.8 Demand Response-actions ... 61 Observations ... 63 5 Analysis ... 67 Refrigeration system... 67 Lighting system ... 69 HVAC-system ... 71 Demand response-actions ... 73 Summary ... 76
6 Conclusions and discussion ... 77
Further research ... 79
LIST OF FIGURES
Figure 1-visualization of electrical load curve(own). ... 9
Figure 2-Peak Clipping (Goswami & Kreith, 2015). Figure 3-Load shifting (Goswami & Kreith, 2015). 10 Figure 4-Distribution of specific electricity usage in grocery stores (Swedish Energy Agency, 2010). ... 15
Figure 5- System design-direct system (Arias et al., 2004). ... 16
Figure 6-System design-completely indirect system (Arias etal., 2004) ... 17
Figure 7-System design for plug-in counter (Monica Axell, 2004). ... 17
Figure 8-Visualization of typical freezer room (Monica Axell, 2004). ... 18
Figure 9-Typical horizontal refrigerator with doors (Monica Axell, 2004). ... 18
Figure 10-Distribution of the different light sources in grocery stores in percentage (Swedish Energy Agency, 2010). ... 22
Figure 11-Analog lighting dimming system 1-to-10 VDC (Wall, 2001). ... 24
Figure 12-Analog versus Digital ballast with DALI (Wall, 2001)... 24
Figure 13-Heat recovery system design (Arias & Lundqvist, 2006). ... 26
Figure 14- Theoretical Framework Summary ... 35
Figure 15 Percentage of sales in 2014. Change in share compared to last year available in brackets (DLF,DELFI,HUI-Dagligvarukartan, 2015). ... 39
Figure 16- Each profile's share of total sales (DLF,DELFI,HUI-Dagligvarukartan, 2015)... 40
Figure 17-Visualization of data sources used for empirical gathering(own). ... 41
Figure 18-Homescreen of the software iwmac(ICA Supermarket). ... 45
Figure 19-The figure illustrates the procedure for analysis and conclusions in chapters 5 and 6(own). ... 46
Figure 20-Distribution of specific electricity usage in the average ICA store (Energy-Strategist). ... 52
Figure 21-Annual average electricity productions for all store formats in same graph (Store managers). ... 55
LIST OF TABLES
Table 1- Benefits associated with DR (Albadi & El-Saadany, 2008)... 12
Table 2- Electricity to commercial refrigeration (Swedish Energy Agency, 2010). ... 18
Table 3- Installed capacity of different light sources (Swedish Energy Agency, 2010) ... 23
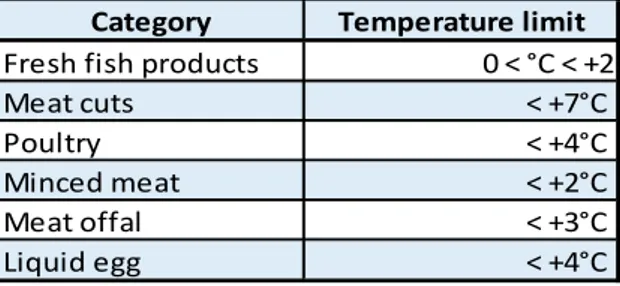
Table 4- Temperature limits given by food legislation (Swedish food retail, 2007). ... 28
Table 5- Temperature limits for products of animal origin (Djupfrysningsbyrån, 2007). ... 28
Table 6-- Summary of topics, questions and related sections in theoretical framework for interview with key person. ... 43
Table 7- Summary of topics, questions and related sections in theoretical framework for interviews with store managers. ... 44
Table 8- Details on observations oriented toward temperatures of refrigerators and freezers. ... 45
Table 9- Detail on observation of defrosting of refrigeration system. ... 46
Table 10- Store chains in ICA Group AB (ICA Group AB, 2015). ...50
Table 11- Electricity consumption per m2 and year for ICA’s different store formats years 2007 and 2014 (Energy-Strategist). ... 52
Table 12--Key indicators on investigated store formats ( store managers). ... 54
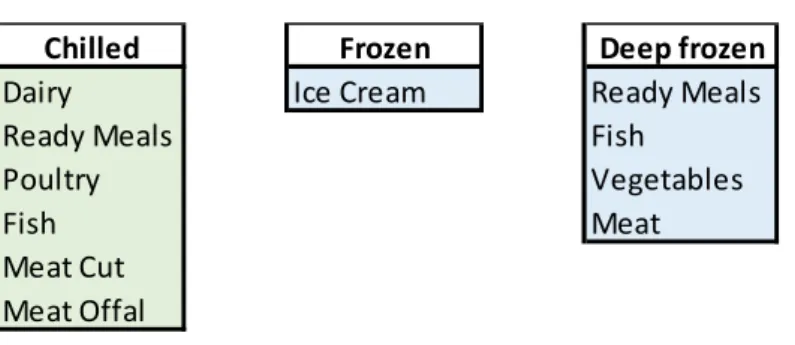
Table 13- Product types and categories available in the investigated store formats(own). ... 63
Table 14- Refrigeration unit 9 in ICA Supermarket. ... 64
Table 15- Refrigeration unit 2 in ICA Nära. ... 64
Table 16- Refrigeration unit 12 in ICA Supermarket. ... 64
Table 17- Average temperature for respective product category per store format(own). ... 65
Table 18- Brief summary of analysis. ... 76 APPENDIX LIST
Appendix 1…... Interview guide for key person Appendix 2…... Interview guide for store managers Appendix 3…... Results of observations – Temperatures Appendix 4…... Results of observations – Defrosting ABBREVIATIONS
Abbreviation Explanation DSM Demand Side Management
DR Demand Response
EE Energy Efficiency EC Energy Conservation
1
1 INTRODUCTION
The European electricity markets have experienced several changes during the last 30 years. Many details can be identified to explain this development, but it is especially three main reasons that have led to the design of today’s electricity markets. Firstly, the liberalization of electricity markets that took place in 90th century in many European countries, including
Sweden, opened up the markets and changed the conditions for producers, retailers and
consumers of electricity. Consumers could select freely among large numbers of suppliers which led to a more competitive market. Secondly, technical development on the distribution side with new technologies for measuring and providing consumers with real time data is another
breakpoint that set trace on the electricity market. These technologies resulted in greater opportunities for the consumers such as to subscribe hourly-rate-agreement as a new option. The last reason is the penetration of renewable sources in electricity production mix during the last years. Renewable energy sources take an increasing share in the production mix both in Sweden and in other parts of the World. (Swedish Energy Markets Inspectorate, 2014; Meeus & Konrad Purchala, 2005)
Governments have invested in renewable electricity to address many of issues available on the political agenda, but the most important ones are to reduce emissions, increase energy security and avoid high fuel costs (Pina, Silva, & Ferrão, 2012). Increased share of renewable energy sources such as wind- and solar power means partly new conditions for the electricity market and imposes many challenges for the future. High volatility and lower grade of predictability associated with renewable sources sets the functionality of the power system at risk (Swedish Energy Markets Inspectorate, 2010; Georgilakis, 2008). The fact that electricity systems require continuous balance between demand and supply in real time leads to further hassle. Achieving balance is not a simple task and depends on various factors. Slight happenings such as an outage in a generation unit or sudden load changes can put the whole system in danger. (Albadi & El-Saadany, 2008)
A future with a power system mainly based on sustainable energy sources will cause even bigger challenges for the supply side in order to regulate the balance. The available options for
regulating the system on the supply side has no sustainable dimension and cannot form the basis for the future electricity system. Reserves based on conventional fuels or trading with
neighboring electricity markets via interconnection (no guarantees for origin of sources) cannot ensure the penetration of renewables sources and protect the balance of the electricity system (Finn & Fitzpatrick, 2014). Many researchers have therefore highlighted the importance of working on the other part of the equation, the demand side. (Kirschen, 2003)
2 Demand Side Management (DSM) is a term that has been discussed and researched extensively during the last years (Finn & Fitzpatrick, 2014; Palensky & Dietrisch, 2011; Strbac, 2008). The term includes programs, activities and mechanisms that make use of available energy in a more efficient way without installing new generation or investing in transmission infrastructure (Mohsenian-Rad, Wong, Jatskevich, Schober, & Leon-Garcia, 2010). Energy Efficiency, Demand Response and Energy Conservation are typical demand-side options associated with DSM (Boshell & Veloza, 2008). With new and efficient technologies electricity usage can be reduced which creates higher efficiency for the electricity system. Demand response (DR) is more oriented toward reacting on different market and price signals in form of “load management” or “load shifting” that enable consumers to shift electricity consumption from “peak-periods” (expensive) towards “off-peak periods” (cheaper) utilizing the real-time electricity price. At the same time, the power utility avoids to invest in new generation to meet the peak demand (Bayod-Rujula, 2009). Energy conservation is more related to the behavioral dimension to reduce electricity usage based on different choices that consumers can make in their daily life. (Boshell & Veloza, 2008)
There are many benefits with DSM and the most important ones are: obtaining higher system- efficiency, managing supply-demand balance in system with large share of renewables,
economical benefits in form of investments resulting in higher efficiency for the system and active consumers that are an important part of price-decision-making. At the same time many challenges appear in the formation of DSM systems and must be handled in order to create a comprehensive perspective for the future. The most important challenge to deal with is the absence of information and communication technology infrastructure that allows the
establishment of the various DSM-programs. Another issue is the lack of understanding of the benefits obtained with DSM. There is a need of clarity regarding the available potential in the various segments of electricity-consumers and functioning business models that allow this development to take place. Further challenges are in form of an inappropriate market structure where some parts must be adapted and other changed for full implementation of DSM. The operational complexity connected with the introduction of DSM- programs has also been
pointed out as a barrier there advanced controlling systems and technological-known consumers are key ingredients for a successful concept. (Strbac, 2008)
The heterogeneity of electricity-consumers is a factor that must be taken into account and is of high importance in order to manage many of earlier mentioned challenges concerning DSM. Consumers of electricity are usually divided into three segments: residential, commercial and industrial. The demand profile for these segments varies in many respects. To identify the characteristics, patterns and needs of each group is essential and required to clarify to what extent the various DSM programs can be applied for respective group. (Encinas, Alfonso, lvarez, Perez-Navarro, & Garcıa-Franco, 2007)
3
Problem statement
DSM is not a new phenomenon, research in the area started some 30 years ago (Lampropoulos, Kling, Ribeiro, & Berg, 2013). Despite that, knowledge about the potential for DSM in different market segments is limited. Factors like time, response infrastructure and electricity price have led to passivity regarding the introduction of DSM. (Strbac, 2008)
Since DR is a branch of DSM it has also suffered from passivity and low amount of
implementation due to the lack of incitements. The strongest incitement for implementing DR is the financial benefits (Lindberg et al., 2014). Reasonably, the possible finical gain gets larger the more electricity there is to be managed at the demand side. The manageable electricity usage is also related to the characteristics of the process that is investigated. A process that is highly flexible in its use of electricity is more likely to have good potential for DR (Palensky & Dietrisch, 2011).Previous studies have shown that households’ interest for DR depends on available types of incentives and price levels (Bartusch & Alvehag, 2014). The relationship between avail and discomfort is not balanced with today’s electricity prices, financial benefits for shifting or refrain activities at times when electricity prices are high have not been large enough in order for households to proceed with DR. (Swedish Energy Markets Inspectorate, 2014)
Neither have Swedish industries, which count for a large part of the total electricity use in
Sweden, implemented DSM and particularly not DR profoundly. The reason is primarily that the alternative cost is too expensive. For example, a production line that is running at full capacity is very costly to stop or reduce. Therefore must the price of electricity be as high as the marginal cost of cutting production in order to motivate electricity cutbacks during peak periods. The tools needed for smooth production adjustments due to periods of high electricity prices does not exist and the price of electricity have historically not been high enough. Managers have therefore not been forced to make structural changes or invest in equipment that makes production more adaptive to DR. (Lindberg, Zahedian, Solgi, & Rickard, 2014; Henning & Trygg, 2008) The commercial sector has not been as comprehensive covered by scientist despite that numerous actors could count as electricity intense. The sector includes segments like
restaurants, hotels, service, wholesales, etc. (Bel, Ortega, Escrivá, & Marín, 2009).One segment of interest in this sector are grocery stores. In Sweden, grocery stores stand for approximately 3 % of total electricity consumed in the country (Swedish Energy Agency, 2010). Most actors in this segment have similar final use of electricity such as refrigeration, air conditioning, ventilation, electronic equipment, lighting (indoor and outdoor) and other (Bel et al,. 2009). Total electricity consumed in turns depends on several factors like store format, characteristics of electrical equipment, business practices, product mix, preservation and display (Tassou, Ge, Hadawey, & Marriott, 2011).Consequently, both the technical and the operational part of businesses are of importance when considering electricity consumption for grocery stores. Furthermore, analyzing single actors in this segment creates a suitable understanding for the
4 potential of DR. Since similarities exist in final use of electricity, minor DR potential in single grocery stores could have large impact if actions are implemented in a larger scale.
Purpose
The purpose with this study is to describe the potential for electricity demand response in grocery stores by identifying technical characteristics and investigating the operational conditions within the businesses. Potential for power reduction during periods of time will be assessed. Representatives will be selected for closer analysis of the technical and operational parts in the businesses in order to obtain better assessment.
Research question
The purpose will be fulfilled by answering the following research question (RQ): How does the characteristics of technical equipment in combination with
operational conditions influence the potential for electricity demand response in grocery stores?
In order to answer the RQ requires an understanding of the electricity-consuming parts in the operations and the flexibility grade of respective part. The relation between the technical and operational process is essential in assessing the flexibility in electricity consumption. By answering the RQ better assessment of potential for electricity demand response in grocery stores can be shown and contribute to further research in the area of DSM.
5
Disposition
2-Theoretical Framework: Chapter 2 presents relevant research that linked to the study’s subject. The chapter consists of five parts: Demand response, Grocery stores, Technical characteristics, Operational characteristics and DR-controlling strategies. Theoretical Framework is used in the analysis to interpret and explain the empirical findings.
3-Methodology: Chapter 3 describes study’s approach and method used to achieve the purpose with this study. Data sources are presented and it is explained how these will contribute to the fulfillment of the study’s purpose. It is then outlined how the empirical data is analyzed, ending with a discussion regarding research quality for this study in terms of validity and reliability.
4-The Ica Perspective on Demand Response Potential: Chapter 4 presents the empirical material gathered via data sources mentioned in methodology. Firstly, the data received from ICA’s energy-strategist is presented, it is followed by inputs achieved through store managers and lastly the results from observations.
6-Conclusions: Chapter 6 outlines the conclusions based on interpretations and reasoning presented in the analysis. Thereafter proposals for further research are given. 5-Analysis: Chapter 5 presents the analysis of this study, both the technical and
operational dimension were included for respective system (Refrigeration, lighting, HVAC). The chapter ends by analyzing store managers’ preferences and thoughts regarding DR actions.
6
2 THEORETICAL FRAMEWORK
The theoretical framework consists of five parts. In the first one clarifies the concept of DR by presenting a definition and highlighting the different programs of DR, benefits, challenges and driving forces. The second part aims to present the concept of store formats and the relation to DR in terms of electricity consumption. The third and fourth parts highlights the technical and operational characteristics of grocery stores with importance for the potential of DR. The last part presents the available controlling strategies used in grocery stores.
Demand response
There are multiple reasons why DSM has become a topic more relevant the last years. The rising demand of electricity together with rising ratios of renewables in the electricity production mix does not only include challenges for stability of the electric grid it also includes transfer
challenges of the electric net since it is becoming more essential to transfer electricity between regions. (Palensky & Dietrich, 2011)
In DSM three clear concepts can be identified, Energy Efficiency (EE), Energy Conservation (EC), and Demand Response (DR). The implementation of DSM strives to achieve reduction of the overall energy consumption by promoting high-efficiency equipment and building designs. (Boshell & Veloza, 2008)
EE is located in the lower end of DSM; the nature of EE is that permanent changes are made in order to reduce energy consumption. For a curve representing the daily consumption of energy, implementation of EE would move the entire curve downwards, creating a lower energy
consumption during the entire day. EC is more related to the behavioral dimension in order to reduce electricity usage based on different choices consumers can make in their daily life (Boshell & Veloza, 2008). DR on the other hand cuts, or shifts, the tops of the curve.
Implementing DR leads in some cases to a more uniform consumption curve throughout the day, though it could also lead to the curve peaks being moved to another period of time. This
phenomenon is called DR with rebound and causes a shift in peak consumption. If it is implemented successfully the peak periods are shifted to more economic beneficial periods in time. (Palensky & Dietrich, 2011)
Traditionally, the approach to the electricity market mechanism is that electricity is delivered when there is demand. Recent years this has changed to a mentality saying that the market is most efficient when fluctuations in demand are as small as possible.(Albadi & El-Saadany, 2008). Though DR does not have a clear definition the most significant part of the phenomena is end-customers changing their consumption based on market indicators.
7 The U.S. Department of Energy defined it as:
“Changes in electric usage by end-use customers from their normal consumption patterns in response to changes in the price of electricity over time, or to incentive payments designed to induce lower electricity use at times of high wholesale market prices or when system reliability is jeopardized” (U.S. Department of Energy , 2006, s. 6) As mentioned in the definition one of the main indicator is price, as a response to high electricity prices consumers try to shift their consumptions to periods when it is relatively cheaper.
2.1.1 DR-programs
There are several programs addressing the issue of price fluctuations over time. Time of use tariffs penalize certain periods of time in order to minimize costs. For example, these periods could be 8:00-10:00 or 17:00-19:00 on weekdays, periods that historically have experienced higher demand than other hours of the day (Söder, 2015). The tariff would then penalize electricity usage during that period and get customers to arrange their processes such that they are less intense during the period. A study showed that residential electricity consumers respond to the price signals of a demand-based time-of-use electricity distribution tariff in the short term. This was achieved by cutting peak demand and shifting electricity use from peak to off-peak hours. The study also provided evidence that there are corresponding effects in for households living in single-family homes. (Bartusch & Alvehag, 2014)
Depending on the characteristics of the processes there is endless ways of arranging processes such that electricity usage is shifted. A study concluded that DR regarding building cooling can decrease the electricity use during peak-periods with 15-30 %. This was achieved by pre-cooling the building before periods of high demand and creating space for temperature increases which led to less electricity use during peak hours. The study confirmed that sub-metered HVAC (heating, ventilation, and air conditioning) and whole building power data is crucial in order to receive accurate models. (Yin, Xu, Piette, & Kiliccote, 2010)
Another main indicator is incentive payments based on securing the stability of the electric system (Nilsson, Stoll, & Brandt, 2015). Recent years the interest for DR have raised the businesses or organizations that leads the development are usually system operators or transmission system operators. The reason is that implementation of DR in many ways are a cheaper way of securing the balance of the system rather than investing in reserve capacity (Torriti, Hassan, & Leach, 2010). Also, the amount of electricity required to meet demand is greatly associated with the losses associated with the distribution. The resistive losses vary as the square of the power flowing through the electricity network. Losses in the grid therefore change significantly for every unit of power that can be removed or moved to a period of less power flow
8 (Shaw, Attree, Jackson, & Kay, 2007). Concerning reserve power, it is a lot cheaper to implement DR programs instead of investing in greater generation capacity. The marginal income for the owners of the reserve capacity would have to be very high since it would only produce income for a few hours of the year, or perhaps no hours of the year depending on various factors (Torriti et al., 2010). This also reduce system balancing costs and grid reinforcement investments. (Albadi & El-Saadany, 2008)
By implementing direct control programs operators have the opportunity to remotely control the electricity usage of their customers. Thereby reduce the consumption at times when the operators benefit from such action (Han & Piette, 2008). Interruptible rates contracts are also a way for the operators to manage problems regarding balance and disruptions of the grid. These contracts often regard a certain amount of customer capacity that can be managed by the operator. (Palensky & Dietrich, 2011)
To sum up DR programs two wide groups can be identified. Price-based DR that includes
programs allowing customers to change consumption pattern by reacting on purchase prices and incentive-based DR including programs that give costumers fixed or varying incentives in
addition to their electricity rates. (Faria & Vale, 2011)
2.1.2 DR-approach
Applying DR programs means either to reduce or to shift electrical load over time as a way to respond to signals provided by the market. Each DR system is a collaboration between two parties that tries to maximize utilization without affecting each other largely. The collaboration is specified through agreements that includes rights and obligations toward each part (utility and costumer). The parameters used in categorization of DR programs are the type of agreement (i.e. incentive or price based) and the type/size of the costumer. Depending on which category each costumer belongs to there are several actions to perform in order to apply DR. Regardless the categories three types of DR approach can be identified. In fully automated DR no human interventions are needed since all actions are pre-programed in advance. In this case the costumer has limited control over the procedure. Manual DR requires participation of building staff that react on different signals and manually manage the demand. Such program results in high degree of dependency on single operators which can be problematic in some cases
especially if they are not present on the day of event. Semi-automated DR is a middle ground between the two previous presented programs. The program includes pre-programed DR strategies but at the costumer side providing the costumer the right for the final decision. (Dam, Mohagheghi, & Stoupis, 2008)
Before deciding which DR approach or DR program to select there are a lot of factors that each costumer must consider and reflect on in the decision making. Many of these factors are related to the size of costumer and the type of operation that forms the potential for DR. It is on local
9 level the most important guidelines must be formed such as maximum allowable interruptions during a day/season, maximum amount of load reduction during a day/season, a set of critical loads, production or operation systems that must be on at any point in time and last but not least production/operation requirements. More specifically the costumers need to focus on the size of load regarding each technical process. The sensitivity grade of each load toward interruptions and the dependency of other processes upon the load. The time required for starting up the load is another factor of importance in this context. (Dam et al., 2008)
2.1.3 Load characterization
In order to find a suitable local load management policy there is a need of understanding and identifying the characteristics of electricity consumption and mapping load patterns related to the different technical processes. It is essential to understand own electricity demand in order to manage it. Useful tool for that purpose is a load curve that graphically illustrates how a customer uses electricity over the course of a day as presented in figure 1. The vertical axis shows the costumer peak demand at any point in time (hours) and the area under the curve illustrates the amount of electricity consumed. Such load shapes can be used for understanding specific processes or the whole system.
Figure 1-visualization of electrical load curve(own).
By creating a holistic view over electricity consumption and mapping the different load profiles simplifies the investigation for finding possibilities for changing load-shape during period of time with or without advanced technological devices. Depending on loads characterization within an operation formed by technical restriction and end-users’ flexibility for load
management, four different categories can be found. Uncontrollable loads that are crucial for the operation and cannot be the target for any DR program. Reparameterizable loads are those that can be controlled thermostatically and have temperature parameters re-set. Third category consist of interruptible loads that can interrupted during a short period of time at given point of their working cycle. Shiftable loads is the last category that characterizes by the ability to
10 postpone or anticipate working cycle to another period of the day. (Soares, Gomes, & Antunes, 2012)
In DR two load-shape changing are of high interest, Peak clipping and Load shifting. In peak clipping (figure 2) the goal is a reduction in peak loads during a period of high demand with or without enabling technologies. Both price and incentives-based strategies can be used for this model. In Load shifting (figure 3) the focus is on shifting loads from on-peak to off-peak periods. In this case it is more about displacement of particular process in order to satisfy load-shape objectives. There are another load-shape changing strategies but are more oriented toward EE and EC. (Goswami & Kreith, 2015)
Figure 2-Peak Clipping (Goswami & Kreith, 2015). Figure 3-Load shifting (Goswami & Kreith, 2015).
2.1.4 Degree of control
It is understandable that participants of DR would have fully control on how the different actions are implemented when signals receive from the market but the degree of control for participants of DR activities varies depending on several factors (Dam et al., 2008). The available
technologies regarding the different technological processes is one of them. Depending on the kind of operation there is a need of certain smart devices in order to respond on received signals. Participants of DR might need to install enabling technologies in form of smart thermostats, peak load controllers, energy management systems, metering and communication smart devices. Another important point is the knowledge level of the staff in the operation. (Albadi &
El-Saadany, 2008)
The degree of control depends also on the type of DR program and approach chosen by the participant. Each program includes different actions that must be fulfilled in order to achieve the goal with DR. The power utility or system operator need in some cases “guarantees” that the participants really apply the agreed actions at each signal submitted. In order to ensure the power reduction, they prefer in some cases to have direct access to loads on end-user side. At the
11 same time to monitor load profile of each participant is not the simplest task to perform.
(Callaway & Hiskens, 2010)
The importance of having suitable load control mechanism in DR programs has led to
introduction of new “third actor” called aggregator (Callaway & Hiskens, 2010). The main idea is that aggregators will act as mediators between utility operator and participants with
responsibility for DR on end-users’ side. These new entities by using advanced technical devices regarding communication and control at end-users’ premises have a huge opportunity to offer DR to the market. End-users get monthly payment in order to allow aggregators control their appliances. For the moment only industrial consumers have been included but the possibility for extending the concept even for other consumers exist and is of interest for the future
development of electricity market generally and for the development of DSM particularly. (Gkatzikis, Koutsopoulos, & Salonidis, 2013)
2.1.5 Benefits
The benefits of DR fall under four main categories: participant, reliability, market wide and market performance. Participants in DR programs realize financial benefits in form of cost savings from using less electricity at high prices or shifting consumption to off-peak periods. Depending on agreement type it is common with additional payments particularly in incentives based programs. Participants realize also reliability benefits which are related to the reduced risk for losing service in blackout. More specifically by applying DR participants have the opportunity to help in reducing the risk for outages. (U.S. Department of Energy , 2006)
It is not only participants that utilize the benefits of DR some are market-wide. By having a more efficient utilization of the available infrastructure a lower overall electricity price is expected. Applying DR programs reduces system peak loads in the long term and postpone the need for building new power plants or investments on distribution and transmission infrastructure. At the same time DR promote the penetration of intermittent sources into the system since it will be easier to deal with the variations in productions. All these factors will be reflected in the price of electricity for all electricity consumers. (Albadi & El-Saadany, 2008)
Another category of DR benefits is related to improvement of market performance. Costumers has a larger role to play with the implementation of DR programs by having the opportunity to manage their own consumption. Participants of DR programs have more choices in the market leading to a larger market power. Additional market improvement is the reduction of price volatility in the market. DR programs reduces the market power exercised by the larger actors in the market in form of power utilities and electricity retailers. Minor reduction in demand leads to a big reduction in generation which prevent power utilities to utilize periods of high demand. (Albadi & El-Saadany, 2008)
12 Table 1 summarizes the benefits associated with DR.
Table 1- Benefits associated with DR (Albadi & El-Saadany, 2008).
2.1.6 Driving forces
Driving forces for household, industrial and commercial customers are somewhat different, as well as obstacles and potential solutions. The economic incentives are essential, but other factors can play in. For residential customers, the costs associated with DR are relatively low. For industrial and commercial customers, the alternative cost related to DR actions is a central part in the discussion making and may differ considerably between industries, business cycles and production modes. (Linnarsson, Hollmén, Fritz, & Springfeldt, 2013)
The common drivers for applying DR actions from costumers’ perspective are reduction in cost, higher degree of control on own electricity consumption and access to additional services in form of security and information systems. To become an active player in the electricity market
through such programs is another factor that appreciated and valued highly from costumers’ point of view. (Delgado, 2005)
From a system perspective the main driving forces to implement DR programs are to success with the conversion toward fossil free community and meet environmental targets, to ensure the security of supply, to give more space for costumers to be a part of price decision making and to use available resources in a more efficient way. (Larsson & Ståh, 2011)
2.1.7 Challenges
There are a number of challenges that need to be considered for a broad application of DR in near future. This section aims to highlight relevant factors of importance for implementation of DR programs from participants’ point of view.
In addition to achieving financial profitability for everyone involved in DR programs there is a need of understanding end-user attitudes, motivations and barriers to implement new ways of electricity use and load management strategies (Stragier, Hauttekeete, & Marez, 2010). One of the most important criteria for a successful implementation of DR is a broad participation in order to achieve the desired impact (Fell, Shipworth, Huebner, & Elwell, 2014). Therefore participants must trust the actors who perform the load control, accept implemented load
Participant Market wide Demand respose benefitsReliability Market performance Avoided deferred infrastructure costs Diversified resources Reduces price volatility Incentive payments Price reduction Reduced outages Reduces market power Bill savings Capacity increase Customer participation Options to customers
13 changes during period of times and are offered a reward for participating to achieve a suitable implementation of DR (Darby & McKennab, 2012). But from the public's point of view, there are some concerns that are important to address in order to get there.
Many consumers are not attracted by the idea that an external actor such as an energy company (company that makes a profit on energy-related business) or an aggregator has control over their electrical appliances (Mert, 2008). Costumers are accustomed to control their own appliances and to decide on when to use electricity. Therefore, loss of personal control over own electricity use has been considered as a major concern for costumers (Fell et al., 2014). The main reason is the fears linked to the end-users believe that comfort will be impaired if an outsider controls their electricity use (Mert, 2008).The challenge may lie in convincing end-users that the control and implementation of DR is done safely and that it is still possible to override control when necessary (Stragier et al., 2010). The customer put great value in being able to turn off the controller manually so that the feeling of being controlled becomes less pronounced (Darby & McKennab, 2012). The acceptance of a new technology or service increases if the user perceives that it has control. (Venkatesh, 2000)
Lack of understanding of the benefits of DR is another factor that slows down the development of DR. Applying control approach has been considered as a barrier since it increases the
operational complexity according to participants. There is a need of clarity regarding the value of DR, partly for the system but also for the participants. By having a clear business case for DR and workable methodologies for quantification of costs and benefits reduces a lot of complexity noted by implementing such programs. (Strbac, 2008)
Grocery stores
In this section explains the reason behind why retail companies are acting in different store formats. The factors that are considered in the formation of store formats and lastly, the influence of such factors on electricity consumption.
2.2.1 Store formats
The high level of competition in grocery retail sector pushed retailers to operate in different store formats in order to retain existing customers and attract new ones. The main idea with the different store formats is to cover more segments. By account for the needs and desires of each segment retail companies try to form a store formats that in a better way satisfy respective segment’s expectations. Normally the factors that affect the choice of costumer for a store format are basket size, distance to the store and price level. (Berne, Mugica, & Rivera, 2005)
14 What differentiate one store format from another is mainly price level, assortment/range of goods and service level. Other factors to take into account in the design are location and size of a store. When deciding the location of a store the attractiveness and travel distance to the place in combination with the size of sales area are significant for the decision making (Toporowski & Lademann, 2014).
2.2.2 Electricity consumption
Energy consumption in grocery stores are normally specified in kWh/m2 sales area per year and
can be seen as the energy intensity of a store (Tasou, Ge, Hadawey, & Evans, 2011).In terms of specific electricity consumption (kWh/m2 ,yr) the grocery store segment belong to one of the
highest electricity consumers. Compared to commercial buildings the grocery stores have some characteristics that diverse them in terms of electricity consumption. High capacities of
refrigeration appear in grocery stores; these operates 24 hours a day all days of the year. They have long opening hours, in some cases as long as 16 hours a day between 7 am to 10 pm. They usually operate every day while other commercial buildings may close on the weekends. (Norén & Pyrko, 1999)
In 2009, the Energy Agency conducted a survey over energy use for grocery stores, malls and other retail outlets, the project was named STIL2. STIL2 indicated that Swedish retail premises has on average a specific energy consumption of 256 kWh/m2 per year. STIL2 found also that grocery stores are the most energy-intensive types of retail stores with an average of energy consumption up to 399 kWh/m2 per year. One explanation that has been pointed out is the large amount of refrigeration facilities required in the handling and storage of food products.
(Swedish Energy Agency, 2010) Grocery stores accounts for nearly 3% of Sweden's total electricity consumption, about 4 TWh.
Between 1990 and 2009, grocery stores electricity use increased from 257 to 309 (excluding electric heating) or 321 (including electric heating) kWh/m2 per year. In other words, electricity usage in grocery stores increased by approximately 20%. One explanation behind this
development is the large diversity in today’s assortment including more goods that need to be refrigerated or frozen. New devices have been appeared in form of bake-off ovens, grills etc., which have contributed to the increase of electricity use. (Swedish Energy Agency, 2010) Largest single item for electricity use in grocery stores is food cooling where the average for a store in Sweden has been estimated at 145 kWh/m2 per year. After this, the lighting with 90 kWh/m2 per year and then fans 24 kWh/m2 per year. In Figure 4 presents the distribution of the specific electricity usage (kWh/m2 per year) for grocery stores. (Swedish Energy Agency, 2010)
15
Figure 4-Distribution of specific electricity usage in grocery stores (Swedish Energy Agency, 2010).
When investigating energy consumption of grocery stores there are a lot factors of importance with large influence that must be considered. Business practices, store format, product mix, shopping activity, available electrical equipment, geographic location, operating hours and quality of operation are factors that form the total energy consumption in a store. (Tasou et al, 2011)
Technical characteristics
This section covers the technical characteristics and factors of influence on electricity consumption with focus on refrigeration, lighting, and HVAC (heating, ventilation, and air conditioning) - systems in grocery stores.
2.3.1 Commercial refrigeration
Today’s refrigerating machines for cooling food follow same principle. They are based on a refrigerant in cooling unit that can be evaporated and condensed at given pressure and temperature. Depending on cooling need and temperature requirements selects the right dimensions for cooling unit and the suitable refrigerant. (Monica Axell, 2004)
Refrigeration systems in supermarkets consists of two main groups, direct and indirect systems. In direct systems, the refrigerant goes in a circuit with start from the machine room, where the
4% 1% 4%8% 3% 46% 28% 6%
Distribution of specific electricity usage in grocery stores
Electric heating (incl. Heat pumps) Comfort cooling
Pumps Fans
Other residential electricity-use Commercial refrigeration Lighting Other operational electricity-use
16 compressor is found, to display cases in the sales area where evaporation and absorption of heat takes place. Long pipes are needed in order to connect the compressors to display cases and to the condensers on the roof. (Arias, Claesson, Sawalha, & Rogstam, 2004; Monica Axell, 2004)Figure 5 illustrates a typical direct system.
Figure 5- System design-direct system (Arias et al., 2004).
Direct systems have been dominating historically and until 1995 they were used almost in all stores. The reason for the decrease was due to a government decision that banned refrigerants R12 and R502 from January 1, 1995, because they contain CFCs that affect the ozone layer negatively. Advantages of the system are that it requires fewer components, has high efficiency and investment costs are relatively low. Disadvantages are that it requires a large amount of refrigerant and the risk of leakage is large. (Arias et al., 2004)
In completely indirect systems, the refrigerant circulates only inside the machine room. In this systems there are two different refrigeration systems including different brines and level of temperature. This leads to a need of extra heat exchange both on the condenser and on the evaporator side between the refrigerant and the brine. It is common with a central indirect system with multiple coolers or refrigerated linked. (Arias et al., 2004; Monica Axell, 2004) Figure 6 illustrates a typical design for completely indirect system.
17
Figure 6-System design-completely indirect system (Arias etal., 2004)
Advantages of this system are lower refrigerant charges, simple-cheap service and the possibility of using natural refrigerants. The drawbacks are risk for lower energy efficiency, risk for
corrosion and the fact that pump need to be insulated. (Arias et al., 2004)
A special case of direct refrigeration system is the plug-in counter that has all the necessary components internal. Figure 7 visualize the system design for a typical plug-in counter.
18 Refrigeration units; Refrigerator-and freezer
rooms are isolated and acts as interim storage in a store. The volume of the room and temperature- requirements on goods are factors that affect energy use. (Monica Axell, 2004)
Fridges and freezers appear in different shapes and sizes in today’s grocery stores. There are vertical and horizontal both with and without doors. The choice of refrigerating unit depends on many factors but for the trader sales are in focus. It must be attractive for the consumers to achieve sales. Another important fact is temperature requirements on goods that must be fulfilled which in turn affect the specifications of refrigerating unit. Many traders prefer open counters with
argumentation that the closed ones are perceived as a physical “trade-barrier”. Reasonably it takes a lot more energy for a refrigerator to keep food cold if a door doesn’t exist (Monica Axell, 2004). A study has shown that installation of doors on fridge-counters in stores does not affect the sales, but it is pointed out that further studies should be done in this matter. (Lindberg, Axell, Fahlaen, & Fransson, 2008)
There are many refrigerating cabinets in today’s grocery stores installed by manufacturers in order to promote their products. Promotional goods usually sell in such cabinets where ice cream and energy drinks are the most common (Monica Axell, 2004) .They are also available in various shapes and sizes depending on the product's size, temperature requirements and design.
Table 2 shows what is included in the commercial refrigeration and how electricity is distributed among the different refrigerating sources.
Table 2- Electricity to commercial refrigeration (Swedish Energy Agency, 2010).
KWh/m2 Refrigerating machines 93,3 Fridge- and freezer cabinets 3,4 3,7 16,2 28,9 145,5 Electric heating for defrosting
Commercial Refrigeration 11 20 100 Total Other electricity Refrigerating furniture Proportion[%] 64 2 3
Figure 8-Visualization of typical freezer room (Monica Axell, 2004).
Figure 9-Typical horizontal refrigerator with doors (Monica Axell, 2004).
19 Refrigerants; Refrigerant is a generic term for the medium that is contained in a closed circuit process from which heat or cold “delivers” in different contexts (Nilsson, 2001). Refrigerants can be found in heat pumps and cooling units. Refrigerant distribution in supermarkets in Sweden has varied significantly because of phase-out of CFC and HCFC refrigerants (Arias et al., 2004). HCFC (hydrochlorofluorocarbon) is a partially halogenated compound containing chlorine. It does affect the ozone layer and have a great impact on the greenhouse effect. R-22 belongs to this group. HCFC without chlorine is called HFC and has no impact on ozone layer. HFC appears in form of R134A and R404. CFC (chlorofluorocarbon) is a fully halogenated hydrocarbon compound containing chlorine, which in turns affects the ozone layer negatively. R11, R12 and R502 are examples of CFC refrigerants. (McMullan, 2002)
Recently CO2 has been an attractive alternative to use as refrigerant in refrigeration system to reduce energy consumption and environment impact (Swedish Environmental Protection Agency, 2003). The conversion from old refrigerants to CO2 to is not feasible without replacing the entire system since systems including CO2 work at higher line pressure. From 2017, it is forbidden to perform new installations with refrigerants containing chlorine compounds, such as R404. It is also forbidden to use them in existing system as from 2020, which makes CO2 to a desirable refrigerant in the future. (Swedish Refrigeration & Heat Pump Association, 2016) Defrosting; Defrosting is a procedure performed periodically on refrigeration systems in order to maintain their operating efficiency. In other words, defrosting is essential process to keep
temperatures within bounds at any time. The purpose of defrosting is to remove ice building from evaporator caused by air inlet during the operation. Over time when air passes over evaporator builds a layer of ice that block air flow and as a consequence reduces the cooling capacity of the system. Regular defrost cycles aims to counteract this problem by stopping the flow of refrigerant and allowing the recirculation of hotter air melt the ice. (Pedersen, Sloth, Wisniewski, & Green, 2015)
Most common defrosting methods available for commercial refrigerated and storage cabinets are off-cycle defrost, hot gas defrost and electric defrost (Rainwater, 2009). In off-cycle defrosting the refrigerant flow to the evaporator is interrupted enabling evaporator fans to blow air across the frosted evaporator in order to melt the accumulated frost. In this method no additional heating is required which make it energy efficient but on the other hand it takes considerably longer time to be done with the procedure.
Electric defrost methods are based on electrical heating elements that are either integrated or amounted adjacent to the evaporator coil. By interrupting the refrigerant flow and start on electric heaters hot air blows over evaporator surface enabling the frost to smelt. Since additional heat is injected the electric defrost method is relatively quick. (Rainwater, 2009)
In hot gas defrost method the interruption of the refrigerant flow to evaporator occur via solenoid valve and evaporator’s fans turns off. By opening hot gas solenoid high temperature
20 refrigerant gas flows into the evaporator with a high pressure in order to melt the frost.
(Hoffenbecker, Klein, & Reindl, 2005)
Defrosting in refrigerated display cases is an energy intensive process. In a study it was indicated that electric defrost heaters stands for up to 25 % of the total electricity consumed in refrigerated display cases (Mei, Chen, Domitrovic, & Braxton., 2002).Defrosting are usually scheduled at preset times and typically occur every six or eight hours, with a duration of 20 to 30 min (Tassou et al., 2001). Preprogrammed defrosting results in some cases in unnecessary defrosts leading to higher energy use and increase in product temperature. Usually defrosts are terminated on a temperature or time setting. The first one is preferred since it ensure that all ice has melted. The energy used in this procedure is mainly for melt the ice on the evaporator. During defrosting the surface of evaporator is not heated uniformly causing “over defrosting” in some areas and this excess heat must be removed when refrigeration starts on again. The cost of defrost can be considered to consists of an overhead and an amount of energy to refrigeration system (Tasou et al, 2011). In a study it was found that overhead was around 85% of energy used highlighting the possibility for energy saving by applying defrosting only when necessary. (Lawrence & JA, 2008) Many factors affect defrost frequency and energy use there many of them are related to external factor. One of them is linked to the relative humidity within a store that has direct impact on the formation of frost on display cases’ evaporators (Tassou et al., 2001). Several studies have been indicated a direct relation between relative humidity, defrosting frequency and energy use (Tassou & Datta, 1999; Kosar & Dumitrescu., 2005; Henderson & Khattar, 1999). From database review conducted in a study it was found that electrical savings from 0% to 7.4 % could achieved by using temperature terminated electric defrost rather than time-terminated if the relative humidity was maintained at 35% from 55% (Kosar & Dumitrescu., 2005). In a laboratory tests it was found that frost accumulation increases exponentially with increased relative humidity there 23% reduction in condensate collection could be achieved by reducing relative humidity from 65% to 45%. Other factors of importance are ambient air temperature, evaporator fin spacing and air flow rate. (Bullard & Chandrasekharan, 2004)
It is worth to mention that defrosting affects the food items in a negative way influencing their shelf-life. As heat is added during the process the temperature of goods rises and in certain location it increases to a level that is not safe. At the same time the fluctuation of temperature experienced by food items can results in product weight loss and deterioration in appearance. (Lawrence & Evans, 2008)
Recently several systems have been developed for defrost on demand which means automatic steered defrost system that initiates defrost cycles and varies the interval between them based on actual need (Allard & Heinzen., 1988). These systems include sensing methods in form of
artificial techniques, air pressure differential, temperature difference between air and evaporator surface, neural networks, fun power sensing and other techniques for measuring ice thickness.
21 However, these methods haven’t been implemented in a large scale due to the complexity of sensing methods, reliability and cost. (Tasou et al., 2011)
Ambient temperature, door-opening and thermostat setting position; Several factors are of importance when investigating influences on refrigerator and freezer energy consumption. Ambient temperature, door opening and thermostat set points are such factors that must been taken into account and have direct impact on refrigerator-freezer energy consumption. Many study-experiments were conducted to investigate the effect of each single variable (ambient temperature, door opening, and thermostat set point) and their combined effect on energy consumption. (Saidur, Masjuki, & Choudhury, 2002; Meier, 1994; Parker & Stedman, 1992) The role of ambient temperature is significant since 60 to 70% of the total refrigerator load is a result of conduction through refrigerator wall. Therefore, the higher difference between internal and ambient temperature the higher is the load imposed on a refrigerator. This underlies the sensitivity of a refrigerator’s electricity use to the ambient temperature. The results showed that by increasing ambient temperature with one degree the total energy consumption is increased by 47 to 53 W h. (Saidur et al., 2002)
By opening refrigerator door warm and moist air exchange with cool air inside the refrigerator cabinet. This in turn leads to heat gains as a result of heat/vapor transfer on the interior surfaces of the refrigerator and bulk air exchange (Saidur et al., 2002). Five categories of loads are
associated with door openings (Masjuki, Saidur, Choudhury, & Mahlia, 2000):
1. Convective heat transfers from the warm ambient air flowing across the cooler refrigerator surfaces.
2. Latent heat transfers with condensation of water vapor from the moist air flowing across the cooler refrigerator surfaces.
3. Radiative heat transfers from the surroundings to the interior surfaces.
4. Sensible heat transfer from the warm air mass within the cooled space after the door is closed. 5. Latent heat transfer due to dehumidification of the air after door is closed.
The results shows that each door opening increases the energy consumption by 9 to 12 W h (Saidur, Masjuki, & Choudhury, 2002; Parker & Stedman, 1992). Earlier study has been indicated an increase of 32 % of energy consumption for 100 door openings (Alissi, 1987). Another one was showed an increase by 28 W h per door opening (Hasanuzzaman, Saidur, & Masjuki, 2008).The temperature of refrigerator and freezer cabinet is controlled by setting the thermostat position. From energy consumption point of view refrigerator use lesser electricity if its thermostat is re-set to a higher temperature (Saidur et al., 2002). In a study it was found that one degree reduction in freezer temperature results in an increase of 8% in energy consumption (Hasanuzzaman, Saidur, & Masjuki, 2008). Another study showed an increase of energy
consumption by 7.8 % reducing freezer temperature by one degree (Saidur et al., 2002). Comparing ambient temperature, door opening and thermostat setting position in-between it
22 was founded that ambient temperature has the largest impact followed by door opening and thermostat setting position. (Saidur et al., 2002)
2.3.2 Lighting
Lighting is an important part of the decor in a store. It is also obvious that lighting is an
important component of marketing, by making certain goods and spaces extra exciting and very exposed, while other parts can be toned down. It has also a big role in a store's electricity
consumption. According to STIL2 (Swedish Energy Agency, 2010) lighting accounts for more than one quarter of a store’s electricity usage. Another observation was that the total installed capacity of lighting was decreased between 1990 and 2010 but the increased operating time still led to a higher electricity consumption. Consequently, in determination of electricity usage for lighting system, lighting design, lightning-type and operating time must be taken into account. In STIL2 (Energy Agency, 2010a) includes a detailed examination of the available lighting sources in trade stores and it has been investigated how much installed capacity for lighting an average store has. Figure 10 presents the distribution of lighting sources in grocery stores in percentage.
Figure 10-Distribution of the different light sources in grocery stores in percentage (Swedish Energy Agency, 2010).
The result showed that stores’ average capacity for lighting was on 17 W/m2 per year and table 3 illustrate the distribution among the different light sources.
23
Table 3- Installed capacity of different light sources(Swedish Energy Agency, 2010)
Lighting Emitting Diode (LED) is the latest in lighting technology. In contrast to the
conventional lighting sources has LED many characteristics that lighting planner have been required for many years. The main advantages with LED lighting are higher light yield in relation to conventional lighting sources (resulting in lower energy consumption), longer lifetime
independent of switching on and off, emits almost no radiation and make it possible with stepwise dimming (Ljuskultur, 2011). Although that the results from Energy Agency’s study showed an absence of LED lighting evidence suggests that LED lamps will have a dominant position in the future. The factor that have been slowed down the development for a broad implementation of LED lighting is above all the high installation costs. Grocery stores has already started installing LED lamps there spotlights and refrigerated display cases have been the first candidates . (Wall, 2005, s. 110)
Several factors must be considered when lighting is installed such as number of luminaries needed, the structure of placement and the fulfilment of different illumination requirements. In sales area in addition to providing good lighting conditions the functionality of the system should make it possible to highlight some products in order to make them more attractive. In many cases, there are standard solutions for different locations as in case with grocery stores where the luminaries in ceiling are evenly distributed with high illuminance where the
calculations are based on different data programs. The number of luminaries become large using such standard. The problem is that using less luminaries results in insufficient lighting level and with too many luminaries the system become more expensive. Therefore, calculations must be made in order to find the optimal solution. (Wall, 2005, ss. 69-71)
Analog and digital lighting dimming systems; The ability to control the lighting systems depends a lot on the type of ballast used in the fluorescent luminaries and the connection
structure. In Sweden it is common with HF (high frequency)-ballast that enables high efficiency, extends the lifetime of lamps and leads to energy savings. Available techniques in the market enable two approach for lighting dimming systems, analog and digital. In the following highlights techniques used in respective approach:
Commercial Refrigeration Installed power[W/m2] 5,4 4,2 3
1 Fluorescent light / conventional ballast
Metal halogen light T5-fluorescent light
T8-fluorescent light with HF-ballast Halogen light
Filament light Other light sources
1,7 1,5 0,2
24 In analog lighting dimming system 1-10 V accepts a 1-to-10 VDC (Volts Directs Current) control voltage for setting the dimming level (figure 11). Depending on the signals received the system react there one volt represents minimum lamp brightness and ten volts represents maximum lamp brightness. In such system the ignition/extinction occurs through a 230 V switch (Wall, 2001, s. 115). Without a dimmable HF-ballast the ability that exists is only about switching on and off. In a complete 1-to-10 VDC dimming system several analog dimming ballasts are connected in parallel and controlled from single control unit, meaning simultaneously control (Ribarich & Contenti, 2002).
Figure 11-Analog lighting dimming system 1-to-10 VDC (Wall, 2001).
In digital lighting dimming systems replaces the analog ballast with a digital one (figure 12) (Wall, 2001, s. 116). Such ballast includes micro-controller for sending and receiving information digitally. Additional functionalities of such micro-controller are storing the ballast address, setting the dim reference for the ballast control, receiving user instructions and sending back information to the user (Ribarich & Contenti, 2002). In other words, the electronics available in such ballasts make them programmable and adjustable to the needs and desires of the
costumers. Each single lamp can be controlled separately by the end user enabling precisely deliver of the right amount light when and where it is required. There are several standards used for digital lighting dimming systems and one of them is called DALI (Digital Addressable
Lighting Interface) there the manufacturer has been agreed on a common protocol in order to make their ballasts compatible. Consequently, pre-programmed digital ballasts with DALI standard are available in the market. With digital lighting dimming systems, the degree of controlling and regulating become higher and more flexible. Large systems are monitored and controlled with a personal computer. (Ljuskultur, 2012)