Southern Swedish Forest Research Centre
Variation in growth and stem quality among
and within provenances of sycamore (Acer
pseudoplatanus) in Denmark
Dinant Lodewijk Meulman
Master thesis • 30 credits
EUROFORESTER Master Thesis no. 316 Alnarp 2019
Variation in growth and stem quality among and within
provenances of sycamore (Acer pseudoplatanus) in Denmark
Dinant Lodewijk Meulman
Supervisor: Jens Peter Skovsgaard, SLU, Southern Swedish Forest Research Centre Assistant supervisor: Jon Kehlet Hansen , University of Copenhagen, Department of
Geosciences and Natural Resource Management
Examiner: Urban Nilsson, SLU, Southern Swedish Forest Research Centre
Credits: 30 credits
Level: Advanced level A2E
Course title: Master thesis in Forest Science
Course code: EX0928
Course coordinating department: Southern Swedish Forest Research Centre
Place of publication: Alnarp
Year of publication: 2019
Online publication: https://stud.epsilon.slu.se
Keywords: Sycamore, Acer pseudoplatanus, provenance, growth, stem
quality
Swedish University of Agricultural Sciences Faculty of Forest Sciences
3
ABSTRACT
Sycamore currently covers around 2% of the Danish forest cover and is an economic attractive species that is also interesting for ecological reasons. This thesis analyses a provenance and progeny trial series in Denmark in order to get an overview of suitable provenances for Denmark, the importance of provenance selection and possible breeding gains. The trial is of planted 2 year old sycamore measured after 9 years and consist out of 16 provenances. Experimental blocks on three sites were measured for the height, dbh straightness and forking behaviour. This data was analysed for significant differences between provenances and for heritability. The results found are that there are significant differences between provenances regarding height growth, diameter growth, stem straightness and forking frequency below 130 centimetres. Three provenances seem promising for the growth conditions in Denmark. Furthermore the analysis shows that there is heritability for height, diameter and stem straightness and that genetic gains for these traits are possible.
Keywords: Sycamore, Acer pseudoplatanus, provenance, growth, stem quality
ACKNOWLEDGEMENTS
I would like to thank Poul Elgaard and Timothy R. Dowse for all the help with the field measures. Further I would like to thank my supervisors, Jens Peter Skovsgaard and Jon K. Hansen for all the support and help throughout this thesis.
4
ABSTRACT ... 3
ACKNOWLEDGEMENTS ... 3
1 INTRODUCTION ... 5
2 MATERIALS AND METHODS ... 6
2.1THE FIELD TRIALS ... 6 2.2SITE DESCRIPTION ... 7 2.3FIELD MEASUREMENTS ... 8 2.4STATISTICAL ANALYSIS ... 9 3 RESULTS ... 11 3.1PROVENANCE ... 11 3.2FAMILY ... 16 3.3SITE ... 17 4 DISCUSSION ... 19 4.1PROVENANCE ... 19 4.2FAMILIES ... 22 4.3SITE ... 22 5 CONCLUSIONS... 23 REFERENCE LIST ... 25 APPENDIXES ... 26
APPENDIX 1: PROVENANCE TESTS ... 26
APPENDIX 2:CORRELATIONS ... 26
5
1 INTRODUCTION
Sycamore (Acer pseudoplatanus) is a broadleaved tree originating from the central European highlands and is currently naturalized in large parts of Europe. Sycamore can grow on a wide range of soils but performs best on deep moist soils of moderate to high fertility (Ammer, 2008; Long, 1992). Long (1992) further specifies that soils of reasonable high pH would benefit sycamore but soil tests in Denmark show no relation between pH and growth (Jensen et al., 2008). Sycamore is moderately light demanding besides the very early stages, young plants can survive for a long time in low light conditions (Hein et al., 2009). Natural regeneration is abundant, this combined with the shade tolerance of seedlings leads to the establishment of a dense seedling bank under the canopy. Small seedlings are able to adapt quickly to increased light conditions, larger seedlings that have lived under a closed canopy can however struggle with stability issues (Hein et al., 2009). Sycamore seedlings are very sensitive to competition from herbaceous plants (Hein et al., 2009).
Sycamore is a species that produces very valuable wood (Vacek et al., 2018), the wood is hard, even grained and brightly coloured making it widely used. Further the sycamore is economically attractive because it also a fast growing species on suitable sites (Hein et al., 2009). From an ecological aspect sycamore provides particular value for birds, fungi, epiphytes and invertebrates (Cundall et al., 1998). According to Hein et al. (2009) the litter from sycamore also has a positive effect on the nutrient cycling and humus formation. The ability to tolerate salt spray and atmospheric pollution can also make it an interesting species (Cundall et al., 1998). Sycamore can be an invasive species Sycamore can also possess a treat to biodiversity in regards that the species is considered invasive (Hein et al., 2009; Long, 1992; Sjöstedt, 2012). This is caused by its frequent seed production, the strong seed dispersal and the capability for seedlings to establish under relatively closed canopy. Some authors indicate that its invasiveness might be overstated and that sycamore will likely alternate in time with other species such as ash (Cundall et al., 1998; Long, 1992).
In Denmark is naturalised sycamore consist of around 2 % of the forest area in monocultures, this is likely an underestimation since sycamore is mostly seen in mixed stands (Jensen et al., 2008). The market is good with the demand exceeding the supply in Denmark. Little research regarding suitable provenances for Denmark is done. Growth of sycamore is vigorous in Denmark, with a maximum mean annual increment of 15 m3 and a total volume production between 700 and 1050 m3 after 80 years (Kølby, 1956 according to Hein et al., 2009). Provenance trials provide information regarding seed sources for commercial use, they show if certain provenances perform better for desired traits. Further they are the first step in breeding programs to identify provenances with high potential over a range of environments, or in case of severe provenance-environment interactions, to outline possible seed zones (White et al., 2007). Progeny trials provide information on the additional genetic variation within provenances and possibilities to improve certain traits through selection. If the same genetic material is replicated at several sites, it will also provide information on genotype-environment interactions (White et al., 2007). High genotype-genotype-environment interactions will decrease possible genetic gains from the breeding program or could lead to a division of the breeding program aiming at different sites (White et al., 2007).
The objective of this master thesis is to analyse how different provenances of sycamore perform in relation to survival, growth and stem quality and provide information on provenance by environmental interactions and furthermore to test for genetic variation within some of the provenances. There is currently a series of field trials in Denmark planted at four locations throughout the country including samples of different provenances and families from open pollinated trees in different provenances. The series was established 2010 and could be used for the purpose of this thesis. The thesis will focus on the provenance suitability for Denmark and on the genetic variation within and among provenances. Thus, the field trials will be measured and analysed, and the results will be compared to literature available.
6
2 MATERIALS AND METHODS
2.1 The field trials
This thesis is based on measurements from three field trials in a field series including progeny from sycamore provenances and families from open pollinated trees in stands of different provenances of sycamore. The series was established in spring 2010 by the University of Copenhagen. All field trials are established with two year old plants in randomized unbalanced blocks with 9 blocks and with 4-tree row plots. Figure 1 shows the design for Drastrup, the design of Tophøj, and Sorø is the same except for blocks which are distributed differently. For this thesis three sites from this trial series were measured, the sites were located near Drastrup, Tophøj, and Sorø and are called after this for the rest of this thesis. There is one more site located near Valnæs, unfortunately there were nesting sea eagles at the time of measurements and thus this site was dropped for this thesis. At Drastrup the rows are oriented S-N with a row spacing of 3 meter and a plant spacing of 1 meter. At Tophøj and Sorø the rows are oriented S-N with a row distance of 2.5 meter and a planting distance of 1 meter.
The experiment contains several provenances from various location throughout Denmark, one provenance from the Czech Republic and one from Poland. Provenances are divined as the site where the seed were collected. All provenances from Denmark are believed to originate from imported seeds, but have been in Denmark for one or more generations. The number of generations for each Danish provenance in Denmark is unknown. From several of the provenances there is an additional test where offspring from known mother trees was collected and included with a specific plant number. Table 1 shows the provenances included in the trial and which provenances have a family trial. The number of trees planted of each provenance varies greatly and the number of measured trees of each provenance can be seen in figure 2.
Figure 2: Number of living trees measured for each provenance over all sites, tree number on the y axis and provenance on the x axis 0 500 1000 1500 1 2 3 4 5 6 7 8 9 10 11 12 13 14 15 16
Figure 1: experiment design for Drastrup. On the right the overview of the blocks, on the left block 7 is enlarged. Each square represents a plot containing four plants of the same mother tree indicated by a plant number. On the axis are the x and y coordinates of the site.
7
Table 1: Provenances included in the field trail Area or forest
district Forest nr. Family trial above sea level) Altitude (meter coordinates
Orenæs Resle skov 1 x 9 N 54°93’ / E 11°72’
Barløse skov Barløseborg skov 2 18 N 55°34’ / E 9°93’
Wedellsborg Ørsbjerg 3 65 N 55°38’ / E 10°00’
Randbøl Boller Nederskov 4 x 24 N 55°27’ / E 11°68’
Poland Krezin 5 unknown
Bregentved Bregnemade 6 59 N 55°31’ / E 12°00’
Gjorslev Magleby skov 7 x 10 N 55°39’ / E 12°33’
Bregentved Boholte 8 39 N 55°37’ / E 12°03’
Ravnholt Gods Lykkesholm 9 70 N 54°25’ / E 10°65’
Copenhagen Vestkoven 10 20 N 55°69’ / E 12°32’
Czech Republic Harrachov 11 x 670 N 50°77’ / E 15°37’
Pallisgård Bøssevænge 12 24 N 55°26’ / E 11°68’
Holsteinborg Kirkeshoven 13 x 22 N 55°23’ / E 11°44’
Sorø Filosofgangen 14 N 55°43’ / E 11°57’
Sorø 15 x 40 N 55°53’ / E 11°57’
Kalø Fussingø 16 x 30 N 56°29’ / E10°49’
2.2 Site description
Drastrup and Tophøj are located in the north of Jutland and Sorø is located on the island of Sealand (figure 3). The experiment at Drastrup is situated at the bottom of an east facing slope and has a south facing slope starting from the border of the site. There is a dense grass layer present on the site. Next to the sycamore planting there are several other experiments, all of these are in young stages and did not provide shelter. Tophøj is a flat site situated next to a minor road, between the road and the planting there is a patch of grass of around 20 to 40 meter wide. In the north the site is bordered by a young beech and larch mixture and to the east an open birch stand, both these stands appear to predate the sycamore. There was very little undergrowth present within the site at the time of measurement, this is aided by that there has been mechanical cleaning of undergrowth. Sorø is a near flat site located at the edge of a forest. The north of the site is bordered by a stream. On the south west side there are several old oaks that get replaced by tall conifers towards the east where they form the south-east and east borders. Sorø also has had mechanical cleaning of undergrowth in the previous growing season. The site currently shows a very light herb layer and mosses covering most of the forest floor. Table 2 shows some climatic conditions and the soil type for each site.
Table 2: specifications of the included sites
Location coordinates soil type average
precipitation average annual temperature altitude
Drastrup N 56°59' / E 9°50' Sandy glacial till 741 8.1 35
Tophøj N 56°42' / E 9°28' Sandy glacial till 740 8.3 50
8
Figure 3: Location of sites
2.3 Field measurements
Several parameters have been tested in order to get an overview of how the different provenances perform. Diameter and height to estimate growth. To estimate the quality of the stem, the stem straightness and forking were measured. Branching behaviour is not considered since the stands are still very young (2010) and this will thus unlikely lead to usable results while being a large time investment.
For each site there was an established protocol for the measurements with a tree id and previous measurements, this protocol was used in the field and for the analysis. Tophøj has already had a thinning leaving only the best tree of each plot and had a removal of forking, complicating comparison between the sites. For this reason and to reduce the workload it was decided that on the other sites for each plot one tree would be selected and only for that tree the height, forking and straightness would be measured. The selection was done primarily on the height and secondarily on the straightness, with exceptions if the straightness was of such large difference that some height difference was accepted. At Sorø all trees were scored for defects, this includes their straightness and forking, in spring 2018. These scores were deemed to be still representative and therefore Sorø is not scored again with exceptions when there were obvious changes.
The diameter (dbh) was measured by calipering trees at breast height (130 cm) parallel of the rows, in case of multiple stems up to the three largest stems were measured. Total tree height was measured using a Messfix telescopic height measurer of eight meters at Tophøj and Drastrup, at Sorø a combination of a height measure stick from Hasting of fifteen meter and a vertex height meter were used because of the greater height of the trees. Forking tendency was estimated by noting of trees that have a fork below 130 centimetre and measuring the height of the lowest fork above 130 centimetre if available. Stem straightness is estimated on a one to nine scale with one being the lowest score and nine the highest. The scores seven to nine indicate a straight tree or a tree with only weak bends, four to six are trees that are not straight but still show dominant upward growth and can have only up to two axis breaks of medium severity, and lastly scores one to three for trees that do not show a strong upward growth form and trees with more axis breaks.
9
On visual impression of the sites there seemed to be a spatial pattern in the height growth of trees. Therefore a soil sample was taken at the centre of each block, in three cases where there was an elongated block with visual differentiation in tree growth two samples were taken. The sample were taken with a soil auger to a depth of one meter. The samples were analysed by Eurofins using their standard package for magnesium (Mg), phosphorus (P), potassium (K) and the reaction count, which is comparable to pH plus 0.5.
2.4 Statistical analysis
2.4.1 Provenance test
Analysis for each individual site was done with all data available for the trait measured. For analysis across sites only the data from selected trees was used to make the data from Drastrup and Sorø comparable with Tophøj. A linear model was applied to test differences among provenances within sites:
Yjkl= µ + Pj+ Bk+ ρjk+ ejkl [1]
where Yjkl is value of the trait in question, 𝜇𝜇 is the grand mean, Pj is the fixed effect of provenance j, Bk is the
fixed effect of block k, 𝜌𝜌𝑗𝑗𝑗𝑗is the random interaction between provenance j and block k and 𝑒𝑒𝑗𝑗𝑗𝑗𝑗𝑗 is the residual
(normally and independently distributed (NID)).
Model [1] was expanded to test for differences among provenances across sites using the linear model Yijkl= µ + Si+ Pj+ Bik+ γij+ ρijk+ eijkl [2]
where Yijkl is value of the trait in question, 𝜇𝜇 is the grand mean, Si is the fixed effect of site i, Pj is the fixed effect
of provenance j, Bik is the fixed effect of block k within site i, 𝛾𝛾𝑖𝑖𝑗𝑗is the random interaction between site i and
provenance j and 𝜌𝜌𝑖𝑖𝑗𝑗𝑗𝑗is the random interaction between provenance j and block k within site i, and 𝑒𝑒𝑖𝑖𝑗𝑗𝑗𝑗𝑗𝑗 is the
residual.
Normal plot histograms of residuals were made to examine for severe deviations from the assumption of normal distribution and residuals were plotted as function of predicted values to examine for lack of variance homogeneity. Provenance effects were tested using the Satterthwaite approximation (Satterthwaite, 1946) i.e. provenance effects were largely tested by the interaction between blocks and provenances using model [1] and by the site by provenance interaction using model [2]. The random variation from the site by provenance interaction in model [2] was tested using a Loglikelihood ratio tests. The MIXED procedure in the statistical software program SAS (SAS Institute, 2008) was used for the analysis, to estimate least square means and make pairwise tests (using the Tukey-Kramer adjustment).
2.4.2 Family test
The analysis for heritability and for breeding value where done through ASReml software. For each site, a linear model is applied, which includes block effects, provenance effects and genetic effects through families, in case of dbh for Drastrup and Sorø and for straightness in Sorø plot effects were also included. A pedigree file in ASReml was applied having provenances as groups, assigning pedigree of mother trees to provenances and assigning the pedigree of individual trees with to mother trees and provenances ( Gilmour et al. 2009). ASReml will provide the additive genetic variance directly through the use of the pedigree file (Gilmour et al. 2009).
Normal plot histograms of residuals were made to examine for severe deviations from the assumption of normal distribution and residuals were plotted as function of predicted values to examine for lack of variance homogeneity. The significance of an effect was tested by comparing the loglikelihood ratio (Kendall and Stuart 1979) with and without the effect analysis. Loglikelihood values were obtained using ASReml (Gilmour et al. 2009).
10
Within each trial site, the additive variance VA was estimated assuming the trees are half sib progeny. Subsequently narrow sense heritability of traits was estimated according to Isik et al. (2017) as;
h2= V
A/Vp [3]
where VP is the total phenotypic variance i.e the estimated genetic variance, the plot variance (for dbh at Drastrup and Sorø and for straightness at Sorø). The application of the pedigree file in the software program ASReml makes it possible to estimate breeding values of individual trees in the field trials considering the genetic variation, performance of the individual trees as well as the family mean (Gilmour et al. 2009). Described in a simplistic way the breeding values are estimated as;
BV = b1*(y1-m) + b2*(y2-m) [4]
where m is the mean, y1 is the estimated value for the individual and y2 is the estimated family value and where b1 and b2 are regression coefficients taking into account the genetic variance and the relationship between the individual and the family.
Breeding values were obtained from output created by ASReml. The mean breeding values for trees measured by this thesis were compared with the mean breeding values of trees selected in scenarios where 400 and 100 of the trees with the highest breeding value were selected. These numbers were chosen as example numbers, the sites are about on hectare in size therefore a final number of trees of 100 seems appropriate. This is however a large deviation from the current situation and therefor 400 was included as an intermediate step.
11
3 RESULTS
3.1 Provenance
3.1.1 Health performance
Survival has been estimated by the survival from 2010 until 2019 for all of Drastrup and block one to four at Sorø. The data for early survival (2011-2012) was available for all sites but contains discrepancies and thus has not been used for this thesis. Instead the survival until 2019 has been used. This data could however not be established for Tophøj since there has been a thinning reducing the tree number to one tree per plot making it impossible to estimate the overall survival. Further the survival has only be calculated in block 1 to 4 at Sorø since there has been a removal of trees at the north end of most rows to follow legislation and a removal in block 5 because of uncertainty of origin. This causes these blocks to be less representative and thus these have been left out. The difference in survival rates between provenance is significant (p < 0.001 in Drastrup/ p < 0.05 in Sorø) and table 3 shows the grouping of significant different provenances (p < 0.05).
Table 3: Survival rate 2010-2019 and wilting calculated as least square means by provenance, ranked from highest to lowest. The groups show the significant different results, where a shared letter indicates no significant differences (p < 0.05)
Survival: Drastrup Survival: Sorø (block 1-4) Wilting: Drastrup
Provenance mean groups Provenance mean groups Provenance mean groups
P8 93.3% ab P14 98.4% ab P6 3.13 ab P12 91.9% ab P12 92.8% ab P4 3.25 a P13 91.8% a P8 92.4% ab P10 3.34 abc P5 89.5% ab P10 92.1% ab P16 3.56 abc P4 88.9% a P1 91.9% a P3 3.72 abcd P2 88.6% ab P9 91.5% ab P9 3.78 abcd P7 87.4% a P3 87.7% ab P11 3.82 abcd P15 86.8% a P7 86.6% ab P5 3.84 abcd P1 85.8% ab P4 85.8% ab P2 3.88 abcd P14 84.5% ab P15 85.0% ab P7 3.91 abcd P10 84.0% ab P11 84.6% ab P13 4.22 abcd P11 83.9% ab P13 83.2% ab P12 4.27 abcd P9 83.9% ab P6 81.1% ab P1 4.54 abcd P6 79.8% ab P2 79.5% ab P15 5.05 d P3 78.9% ab P5 77.4% ab P14 5.19 bcd P16 78.0% b P16 74.8% b P8 5.67 cd
Drastrup has partly been measured by the University of Copenhagen after the summer drought in 2018 for signs of wilting. The measurements have been done in September and were a classification of the proportion of wilting in classes from zero to ten each representing a class of ten percent, for example class “1” contains percentages one to ten next class “2” contain eleven to twenty. The results from that measurement have been included here to get an estimate of drought tolerance of different provenances, there are significantly (< 0.001) differences between provenances. Table 3 shows the ranking and groups for the wilting between provenances. There seems to be no correlation between growth, dbh or height, and wilting nor is there a correlation with the survival rate.
12 3.1.2 DBH
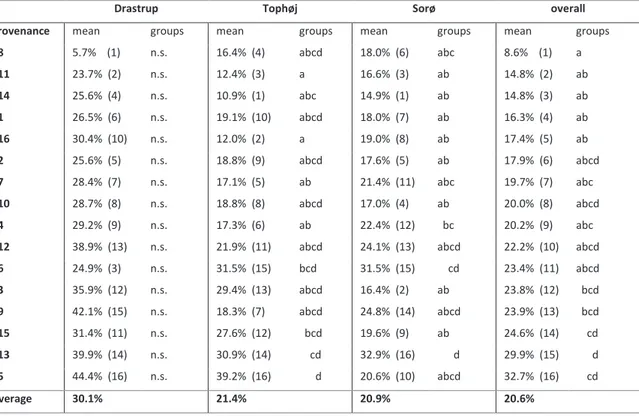
There are significant differences (p < 0.001) in diameter growth among provenances on all sites. The correlation between the sites is low, however provenance 10 and 13 are consistently in the five best and provenances 11 and 15 are consistently in the worst five. Table 4 shows the diameter for the different provenances over the sites and the groups where each letter indicates no a group with no significant differences (p < 0.05). Figure 4 shows the range of dbh of each provenance over all sites.
Figure 4: Range of dbh (cm) measurements on the y axis by provenance on the x axis across all sites
Table 4: Dbh (cm) calculated as least square means by provenance, ranked from highest to lowest in overall ranking. The groups show the significant different results, where a shared letter indicates no significant differences (p < 0.05). ranking within site is shown by (x)
Drastrup Tophøj Sorø Overall
Provenance Mean groups mean groups mean groups mean groups
P10 3.36 (2) ab 5.81 (3) abc 6.49 (3) a 5.92 (1) ab
P1 3.27 (3) ab 6.31 (2) a 6.15 (9) abc 5.84 (2) a
P8 2.89 (9) abcd 6.49 (1) ab 6.58 (1) ab 5.78 (3) abc
P12 3.77 (1) a 5.18 (9) abc 6.26 (5) abc 5.68 (4) abcd
P13 3.14 (5) abc 5.31 (5) abc 6.41 (4) abc 5.56 (5) abc
P6 3.23 (4) abcd 5.16 (10) abc 6.02 (10) abc 5.38 (6) abcd
P9 2.81 (11) bcd 5.27 (6) abc 6.52 (2) ab 5.38 (7) abcd
P7 3.04 (7) abcd 5.22 (8) abc 6.17 (8) abc 5.34 (8) abcd
P4 2.92 (8) bcd 5.49 (4) abc 6.19 (6) abc 5.31 (9) abcd
P2 3.12 (6) abcd 4.95 (15) abc 6.18 (7) abc 5.27 (10) abcd
P3 2.67 (14) bcd 5.07 (12) abc 5.97 (11) abc 5.04 (11) abcd
P16 2.87 (10) bcd 5.06 (13) bc 5.45 (14) abc 4.96 (12) cd
P15 2.80 (12) bcd 5.00 (14) bc 5.26 (15) c 4.91 (13) cd
P5 2.41 (16) d 5.23 (7) abc 5.95 (12) abc 4.90 (14) abcd
P14 2.68 (13) bcd 5.11 (11) abc 5.08 (16) bc 4.90 (15) bcd
13
3.1.3 Height
There are significant differences among provenances in height growth for all sites and across the sites, the significance level overall and for Drastrup and Tophøj is < 0.001, at Sorø it is < 0.01. There is some correlation between the sites (0.64-0.76), with the highest correlation between Tophøj and Sorø. Provenance 8 performs the best on all sites and provenance 1 and 10 both also are constant in the five best. On the bottom side, provenances 11 and 16 are consistently in the worst five. Table 5 shows the groups of significant (< 0.05) different provenances for each site, note that Sorø did not have significant groups at this level. Figure 6 shows the variation in each of the provenances.
Figure 5: Range of height (cm) measurements on the y axis by provenance on the x axis across all sites
Table 5: Height calculated as least square means by provenance, ranked from highest to lowest in overall ranking. The groups show the significant different results, where a shared letter indicates no significant differences (p < 0.05). ranking within site is shown by (x)
Drastrup Tophøj Sorø Overall
mean groups mean groups mean groups mean groups P8 481.1 (1) a 616.2 (1) a 847.2 (1) a 648.4 (1) a P10 438.6 (5) abc 539.9 (3) abc 834.6 (2) a 603.8 (2) abc P1 441.7 (4) a 557.6 (2) ab 798.1 (5) a 598.7 (3) a P12 475.7 (2) ab 530.2 (4) abc 783.3 (8) a 595.6 (4) ab P13 434.6 (6) ab 522.6 (6) abc 787.1 (7) a 581.4 (5) abc P7 413.3 (7) abcd 510.7 (8) abc 800.6 (4) a 574.5 (6) abcd P9 380.7 (12) abcde 529.5 (5) abc 802.8 (3) a 571.3 (7) abcde P2 448.8 (3) abc 482.6 (14) bc 772.2 (11) a 568.4 (8) abc P4 399.0 (8) abcde 501.7 (9) bc 797.9 (6) a 565.6 (9) abcde P3 391.4 (10) abcde 488.4 (13) bc 777.9 (10) a 552.3 (10) abcde P5 377.1 (13) abcde 520.3 (7) abc 724.9 (14) a 549.6 (11) abcde P14 362.2 (16) cde 498.0 (10) bc 778.6 (9) a 543.9 (12) cde P15 392.3 (9) bcde 490.4 (11) c 730.9 (13) a 539.0 (13) bcde P11 368.2 (15) e 488.8 (12) c 739.4 (12) a 532.6 (14) e P6 383.7 (11) abcde 466.4 (16) c 716.1 (15) a 523.0 (15) abcde P16 372.4 (14) de 475.9 (15) c 714.0 (16) a 522.7 (16) de
14
3.1.4 Straightness
When looking at straightness there are significant (< 0.001) differences between provenances. There is some correlation between Drastrup/Tophøj (0.74) and Tophøj/Sorø (0.78) but less so between Drastrup/Sorø (0.51). On all sites provenance 11 performs the best, provenances 7 and 16 are also in the top 5 on all sites. Provenances 1 and 5 are in the lowest performing provenances on all sites. Figure 6 shows the variation for each provenance, of note here is that provenances 7, 11 and 16 have very few measured below a 5. Table 6 shows the significant different (< 0.05) groups for the provenances.
Figure 6: Range of Straightness measurements on the y axis by provenance on the x axis across all sites
Table 6: Straightness calculated as least square means by provenance, ranked from highest to lowest in overall ranking. The groups show the significant different results, where a shared letter indicates no significant differences (p < 0.05). ranking within site is shown by (x)
Drastrup Tophøj Sorø overall
Provenance mean groups mean groups mean groups mean groups
P11 5.82 (1) a 6.74 (1) a 6.81 (1) a 6.56 (1) a P16 5.58 (3) abc 6.63 (3) ab 6.35 (4) abcde 6.29 (2) ab P7 5.70 (2) ab 6.50 (5) abc 6.40 (3) b 6.26 (3) abc P2 5.48 (6) abcd 6.42 (7) abc 6.43 (2) abcd 6.24 (4) abcd P4 5.37 (8) abcd 6.64 (2) ab 6.12 (6) bcde 6.13 (5) bcd P12 5.58 (4) abcd 6.08 (14) abc 5.95 (10) bcde 6.05 (6) abcd P6 5.50 (5) abcd 6.43 (6) abc 6.02 (9) bcde 6.00 (7) bcd P9 5.25 (9) abcd 6.30 (9) abc 6.22 (5) bcde 5.99 (8) abcd P10 5.41 (7) abcd 6.27 (10) abc 6.07 (8) bcde 5.98 (9) bcd P8 5.12 (11) abcd 6.22 (11) abc 5.70 (14) bcde 5.91 (10) bcd P13 5.21 (10) abcd 6.32 (8) abc 5.73 (13) de 5.86 (11) bcd P3 4.62 (16) d 6.59 (4) abc 5.89 (12) bcde 5.86 (12) bcd P1 4.94 (14) d 6.17 (13) c 5.68 (15) e 5.82 (13) cd P15 5.11 (12) cd 6.18 (12) c 6.08 (7) bcde 5.80 (14) d P14 4.99 (13) bcd 6.07 (15) bc 5.90 (11) bcde 5.70 (15) bcd P5 4.73 (15) bcd 5.86 (16) c 5.31 (16) cde 5.45 (16) d
15
3.1.5 Forking
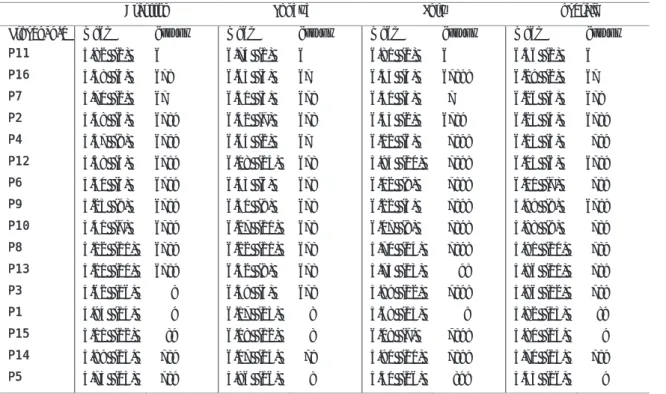
The variation in probability for low forks (<130 cm) is significant for Tophøj and Sorø (<0.05), it is not significant for Drastrup. The correlation is low between the sites, however provenances 11 and 14 do score top 5 on all sites and provenances 12 and 13 bottom 5 at all sites. Table 7 shows the significant groups (< 0.05) for low forks. A remark about the values for Sorø is that these values are composed on measures of all trees where Drastrup, Tophøj and the overall values are only taking the selected trees into account.
Table 7: Low forking frequency calculated as probability of a frequency analysis by provenance, ranked from highest to lowest in overall ranking. The groups show the significant different results, where a shared letter indicates no significant differences (p < 0.05). ranking within site is shown by (x)
Drastrup Tophøj Sorø overall
Provenance mean groups mean groups mean groups mean groups
P8 5.7% (1) n.s. 16.4% (4) abcd 18.0% (6) abc 8.6% (1) a P11 23.7% (2) n.s. 12.4% (3) a 16.6% (3) ab 14.8% (2) ab P14 25.6% (4) n.s. 10.9% (1) abc 14.9% (1) ab 14.8% (3) ab P1 26.5% (6) n.s. 19.1% (10) abcd 18.0% (7) ab 16.3% (4) ab P16 30.4% (10) n.s. 12.0% (2) a 19.0% (8) ab 17.4% (5) ab P2 25.6% (5) n.s. 18.8% (9) abcd 17.6% (5) ab 17.9% (6) abcd P7 28.4% (7) n.s. 17.1% (5) ab 21.4% (11) abc 19.7% (7) abc P10 28.7% (8) n.s. 18.8% (8) abcd 17.0% (4) ab 20.0% (8) abcd P4 29.2% (9) n.s. 17.3% (6) ab 22.4% (12) bc 20.2% (9) abc
P12 38.9% (13) n.s. 21.9% (11) abcd 24.1% (13) abcd 22.2% (10) abcd
P6 24.9% (3) n.s. 31.5% (15) bcd 31.5% (15) cd 23.4% (11) abcd P3 35.9% (12) n.s. 29.4% (13) abcd 16.4% (2) ab 23.8% (12) bcd P9 42.1% (15) n.s. 18.3% (7) abcd 24.8% (14) abcd 23.9% (13) bcd P15 31.4% (11) n.s. 27.6% (12) bcd 19.6% (9) ab 24.6% (14) cd P13 39.9% (14) n.s. 30.9% (14) cd 32.9% (16) d 29.9% (15) d P5 44.4% (16) n.s. 39.2% (16) d 20.6% (10) abcd 32.7% (16) cd Average 30.1% 21.4% 20.9% 20.6%
There are no significant differences found for high fork (>130 cm) frequency between the provenances at any site, the data however suggest a trend at Drastrup and Tophøj. Table 8 shows the results for high forking frequency. The height of the lowest fork above 130 centimetres is not significant between the provenances on any site.
16
Table 8: High forking frequency calculated as probability of a frequency analysis and least square mean of forking height by provenance, ranked from highest to lowest in overall ranking in probability. ranking within site is shown by (x)
Drastrup Tophøj Sorø overall
frequency mean
height frequency mean height frequency mean height frequency mean height P5 15.6% (2) 224.4 21.6% (1) 254.3 2.9% (8) 511.87 13.6% (1) 274.7 P2 13.8% (1) 264.5 45.9% (11) 343.2 1.8% (2) 396.52 20.9% (2) 325.7 P7 18.2% (4) 290.5 39.8% (4) 308.6 2.7% (7) 348.39 21.4% (3) 313.1 P9 21.7% (8) 295.4 40.6% (7) 287.8 1.8% (3) 447.54 21.7% (4) 316.1 P8 16.4% (3) 370.4 44.4% (10) 416.7 2.6% (6) 376.87 22.4% (5) 407.4 P11 23.1% (9) 251.9 42.0% (8) 310.9 2.3% (4) 449.33 23.4% (6) 309.7 P16 18.7% (5) 294.9 49.4% (12) 320.0 3.7% (11) 372.52 24.9% (7) 331.3 P4 21.5% (7) 292.4 50.3% (13) 306.0 3.6% (10) 406.87 27.5% (8) 321.4 P15 32.0% (14) 282.7 40.5% (5) 305.3 3.5% (9) 403.08 27.6% (9) 318.3 P13 24.6% (10) 264.1 35.9% (3) 325.6 6.8% (16) 386.47 27.9% (10) 316.4 P14 40.2% (15) 256.6 29.2% (2) 318.3 4.3% (12) 481.44 27.9% (11) 332.3 P12 20.3% (6) 279.2 67.3% (16) 330.9 1.3% (1) 321.17 28.5% (12) 307.9 P6 30.3% (11) 210.2 40.3% (4) 307.3 5.3% (15) 378.72 29.2% (13) 318.3 P1 30.7% (12) 301.6 57.0% (15) 345.9 2.5% (5) 446.79 31.2% (14) 348.3 P10 41.3% (16) 292.3 42.8% (9) 323.5 4.3% (13) 357.56 32.7% (15) 325.5 P3 30.9% (13) 246.0 52.0% (14) 316.3 4.4% (14) 455.98 33.0% (16) 328.4 Average 25.0% 276.1 43.7% 320.0 3.4% 408.8 25.9% 324.7
3.2 Family
3.2.1 Heritability
Table 9 shows the variation for dbh, height and straightness on the three sites and what is contributing to this variation. Forking height was also tested but is not shown as it was not significant on any site. From the presented results all are significant, with an exception for dbh on Drastrup as can be seen from the table. h2 is the heritability of the trait based on the data. For the test that have a plot variance this is the variance between plots and the environmental variance in then the within plot variance. The genetic correlation between the traits has been examined within sites to get an overview of how selection for one trait would affect the other traits. There is a high genetic correlation between height and dbh (> 0.9) and low between height and straightness or dbh and straightness (> -0.5, < 0.5).
Table 9: Variance and heritability for dbh, height and straightness
trait dbh Height Straightness
Site Drastrup Tophøj Sorø Drastrup Tophøj Sorø Drastrup Tophøj Sorø
Plot variance 0.46 * 0.80 * * * * * 0.08
Genetic variance 0.10 0.66 0.44 1623 2106 1537 0.24 0.13 0.27
Environmental variance 1.69 2.28 3.07 8462 9026 23629 0.87 0.49 1.00
Phenotypic standard deviation 1.50 1.71 2.08 100 106 159 1.05 0.79 1.16
Mean 3.0 5.3 5.9 402 507 764 5.4 6.4 6.2
Coefficient of variation 0.50 0.32 0.35 0.25 0.21 0.21 0.20 0.12 0.19
h2 0.04 0.22 0.10 0.16 0.19 0.06 0.22 0.21 0.25
h2 se 0.037 0.092 0.046 0.089 0.087 0.071 0.100 0.097 0.094
17
3.2.2 Breeding gain
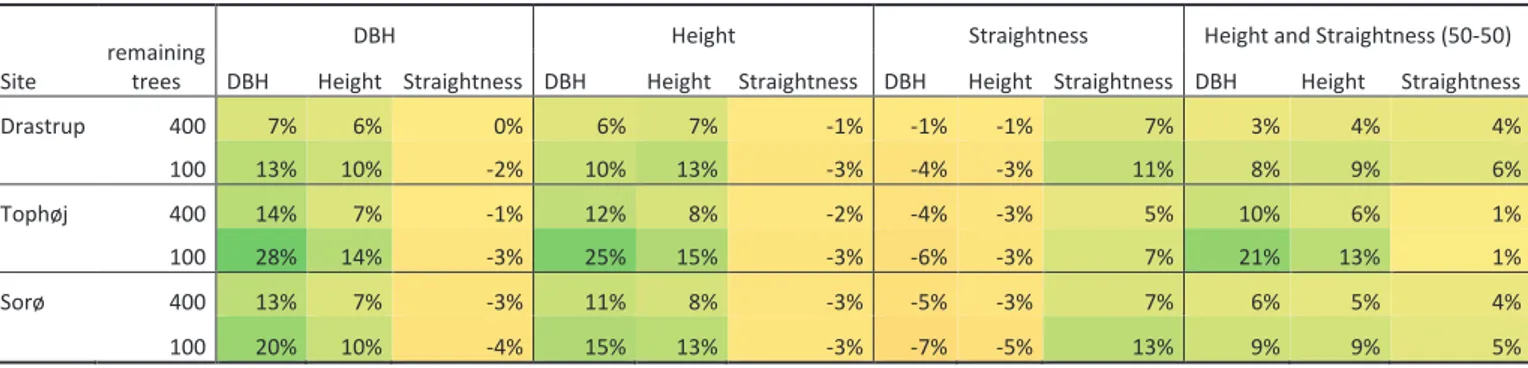
Table 10 shows the predicted gain in percentage for the three sites based on mean breeding values of selected trees and for two scenarios where the number per site would be reduced to the 400 or 100 trees with the highest individual breeding value. The selection has been done for each trait and a final selection where the selection was a combination of height and straightness of equal weights. The table shows possible gains for all traits and particularly for diameter growth. Selections based upon a single trait can cause minor losses in other traits but when balancing the selection positive gains for all traits are possible.
Table 10: Breeding gain by site and trait for selections down to 400 and 100 trees for four scenarios aiming to improve dbh, height, straightness or a combination of height and straightness.
Site remaining trees
DBH Height Straightness Height and Straightness (50-50) DBH Height Straightness DBH Height Straightness DBH Height Straightness DBH Height Straightness
Drastrup 400 7% 6% 0% 6% 7% -1% -1% -1% 7% 3% 4% 4% 100 13% 10% -2% 10% 13% -3% -4% -3% 11% 8% 9% 6% Tophøj 400 14% 7% -1% 12% 8% -2% -4% -3% 5% 10% 6% 1% 100 28% 14% -3% 25% 15% -3% -6% -3% 7% 21% 13% 1% Sorø 400 13% 7% -3% 11% 8% -3% -5% -3% 7% 6% 5% 4% 100 20% 10% -4% 15% 13% -3% -7% -5% 13% 9% 9% 5%
3.3 Site
When looking at the data collected on the selected trees the sites show large differences in growth as can be seen in figure 7, most notably is height and to a lesser extent dbh. Drastrup shows the lowest growth potential and Sorø the highest. In regards to straightness there are less apparent differences, only Drastrup seems to score a bit lower on average.
Table 11 shows the average results from the soil samples. From this can be seen that Sorø is the richest site of the three and Tophøj the poorest site. There is a large variation in pH and magnesium at Sorø with pH values between 4.6 and 6.9 and magnesium ranging from 4.8 to 17 mg. When being tested against height, diameter and straightness there are significant covariation between pH and all traits. pH seems to have a negative relation to growth but a positive relation to straightness. Figure 8 shows the pH-trait relation for height and straightness, the sites are represented with a number and colour in these graphs; Drastrup,1/blue, Tophøj, 2/red, and Sorø, 3/green.
Table 11: Average pH and content of nutrient from soil samples + standard error (SE).
site Mg (mg/100 gts.) SE P (mg/100 gts.) SE K (mg/100 gts.) SE pH SE
Drastrup 3.5 0.8 4.3 0.9 3.5 2.2 5.7 0.2
Tophøj 2.3 0.6 2.2 0.4 4.8 1.5 4.9 0.5
18
Figure 7: range of straightness, height (cm) and dbh (cm) for each site. Traits are on the y axis and
the sites on the x axis Figure 8: Analysis of covariance for height and straightness compared to pH + regression lines. The top figure shows straightness on the y axis, the bottom one height on the y axis. pH is on the x axis for both figures
19
4 DISCUSSION
4.1 Provenance
4.1.1 Health performance
The differences in survival between the different provenances gives significant results where measured, but a remark needs to be made that the data set from Sorø is not very large for this trait and that spatial variation can play a substantial role in this case. What can be seen is that on both sites only one provenance performs worse than one in Sorø or 4 others in Drastrup, P16. This is also a provenance that performs below average in both growth traits. It is not possible to distinguish whether the poor health performance has affected its growth or it is the poor growth that causes the lower health performance.
The drought response of the provenances is significantly different and not related to any of the other factors that have been tested in this thesis. This means that there are differences in drought resistance and that until now the effects of this did not play a large role in regards the survival, growth or stem quality. However in case of dry sites there is an indication that P8 and 15 should be avoided in favour of the other provenances tested and that P4 and 6 appear the best suitable.
4.1.2 DBH
There are significant differences in DBH between provenances, the size of the groupings and the variation between sites make it however difficult to draw general conclusions outside the very best and worst performing provenances
When disregarding the significance of the results certain trends can be seen in the rankings of the provenances across sites. P10 and 13 perform well on all sites, indicating that these provenances have an inherent capacity for a higher DBH growth compared to the other tested provenances or are best suited for the climate and soils in Denmark. On the other side, there are P3, 11, 14, 15 and 16, these provenances perform in the lower half for all sites indicating that these are less suitable. This can be because these are originating from stands that are less adapted to the local conditions, for example P11 is from the Czech Republic, the others are from stands across Denmark but might be from stands that are fewer generations in Denmark than the other provenances. P5 is the provenance from Poland, this provenance seems to perform worse than most Danish provenances similar to the Czech provenance, it does however perform way better on Tophøj comparative to its ranking on the other sites and overall. P9 performs the best on Sorø, slightly above average om Tophøj and then below average on Drastrup. P1 performs good on Drastrup and Tophøj, but is average on Sorø. P8 is also noteworthy in that it performs really good on Tophøj (1) and Sorø (2) but much more average on Drastrup (9), this can indicate a factor that limits its growth on this site for example there could be a higher sensitivity to competition from herbaceous plants. P12 is the other way around in that it performs extremely well on Drastrup (1) with 0.4 cm higher dbh on average, while performing good (5) or average on (9) on Sorø and Tophøj.
4.1.3 Height
For height there are also groupings of significant different provenances that are again only showing differences between the best and worst provenances and not resulting in distinct groups of provenances that can be used, the over site grouping is a bit more diverse however.
One of the more interesting trends that can be seen from the data is the there is one provenance performing the best on all sites: P8. When looking at the distribution of measurements it can be seen that not only the average is high, it is also the only provenance with no height below two metres. One note on this is however that P8 is one of the provenances with a relatively low number of trees measured, only 53 while some have over 300. But since this provenance performs the best on all sites in height growth and 3rd overall in diameter growth this provenance should be considered for seed orchards and commercial plantings. P1 and 10 also perform good on all sites, both of these provenances also performed good on diameter growth, with p10
20
being more consistent over the sites in dbh. P13 performs only slightly above average in height (6-7), when combining both parameters for growth it can still be one of the better and consistent performing provenances. P1, 8, 10 and 13 seem thus the most promising provenances for growth around the country.
P9 again shows the same pattern where it performs better in Sorø (3) then in Tophøj (5) then in Drastrup (12), this further indicates that there are some requirements for this provenance. P12 is also still better in Drastrup (2) compared to the other sites (4/8) but the pattern is not as strong as before. Another provenance that shows a repeating pattern is P5, on the low end for Drastrup and Sorø but average at Tophøj.
The least performing provenances regarding height growth are P3, 6, 11, 14, 15 and 16. All these provenances score below average on all sites. P11, 14, 15 and 16 are also the provenances that are significantly different from the best provenances in height growth when comparing across sites. Except P6, these are the same provenances that perform poorly in regard to diameter growth.
4.1.4 Straightness
When looking at the straightness of the different provenances the first thing to note is that all provenances except P5 have around 25 percent of the selected trees in the high-quality classes (7-9). Considering that on each site around 1.000 trees were selected and scored for straightness on sites of about one hectare, there is an indication that all these provenances should provide sufficient high-quality trees when managed accordingly. What in turn indicates that for commercial usage in traditional forestry growth could be a more interesting factor to consider for provenance choice than the straightness.
Another note to make on the distribution of measurements is that P7, 11 and 16 have very few measures under a 5. This means that there a very few trees with a truly bad shape. This could be of interest when low number of trees are planted, for example as an admixture or in a wide spacing, and if there is still a wood quality goal. It is however important to keep in mind that these are all the most vigorous trees out of four and that the distribution off all trees would include more trees of the lower qualities as well.
When looking at the ranking of the different provenances it can be seen that the summarized order is not always in line with expectations when looking at the three individual sites. For example P8, which scores ranking 11, 11 and 14 and then a final ranking of 10. This has to do with that the ranking of Sorø contains all trees and not only selected trees while the overall scoring contains only the selected trees, herefor the trees used for calculating at Sorø for the summarized score are different than those presented in the table. The reason for this is that including all measures at Sorø for the overall scoring would taint the outcome because the data collected at Drastrup and Tophøj is not comparable but including the non-selected trees was considered to better show differences in provenance when available.
The grouping of significantly different provenances is only showing a difference between the very best performing and the worst performing provenances. An exception for this is P11 at Sorø and in the overall ranking, this provenance is significantly better than all but 3 in Sorø and 5 overall. Since the mean of this provenance also is the highest on all sites there is an indication that this provenance could be of interest for improving seed material. Other provenances that perform well on all sites are P16 and 7. On the lower end of performance there is P1,5 and 14. P15 also is on the low end in Drastrup and Tophøj and even lower overall indicating that at Sorø the selected trees of P15 are lower than selected trees of other provenances. This means that apparently the best growing trees of this provenance have a poor shape.
When looking at returning trends it can be seen that P12 again performs better at Drastrup than at the other sites. P9 still performs best at Sorø but there is no difference in the ranking between Drastrup or Tophøj for straightness. The patterns that could be seen for P1 and 5 for growth are not visible here, both provenances perform similar on all sites.
21
Comparing the straightness and the growth of provenances there are no provenances that perform among the best on all parameters. P11 and 16 that show the best shape but are among the worst for growth, P7 is more average in growth. Two of the better performing provenances for growth ,P8 and 10, are slightly below average in case of straightness. P1 that also performs good on growth is one of the worst for straightness. P5, 11, 14 and 15 are performing on the lower half on all parameters indicating that these provenances are less suitable.
4.1.5 Forking
From the three parameters analysed only the forking frequency of low forks showed significant results. Both the frequency and the height of high forks were far from significant. What further is interesting is that there is no correlation between the occurrence of high and low forks.
Since there are no significant differences and there are no clear trends visible for forking frequency above 130 centimetres or the forking height there cannot be differentiated between the provenances. What is apparent is the large differences between sites. This would indicate a large environmental influence on forking, however this cannot be concluded because the differences are more likely explained by differences in measuring. At Tophøj there has been pruned and in order to estimate what the natural forking would be for each pruning wound it would be estimated if the branch was a fork at the time of pruning. This is highly inaccurate and likely is an overestimation when comparing the data. Sorø on the other side was scored by a different person and method than the other sites, here forks above a certain proportion of the tree were not considered and old forks were more likely considered a ramnicorn than on the other sites. This likely led to an underestimation compared to the other sites.
Considering the frequency of low forks, when comparing the individual sites and the overall score it can again be seen that the selection has a large influence on the outcome of the selection. This is logical considering that in case of comparable height forking trees would be avoided as much as possible leading to a different estimation of forking when comparing Sorø to the other sites and overall frequency. Again there are significant different groups but these only differentiate between the best and worst performing provenances. Comparing the provenances for trends it appears P8, 11 and 14 perform the best and P5 and 13 the worst. None of the trends between stands that could be seen for previous parameters are visible in the low forking frequency.
4.1.6 Literature
There is very little literature regarding provenance studies in sycamore to compare these results with. Helliwell and Harrison (1978) did a study where they planted sycamore seeds of 6 different seed sources and measured if these showed different height growth and how this interacted with different soil types. They did find significant difference between the seed sources, showing a different growth potential between provenances. These results are however only for two-year growth from seed in a controlled environment, regular water supply and weed control, and are therefore likely showcasing a different relation. More comparable is a study in Britain from where Cundall et al. (1998) compared height growth four years after planting on a farm forestry site, in this they found no significant differences across their sites. One of the provenances that was included was from Denmark and is also included in this test, called P3 in this thesis. They only had it included in one of the sites and there it performed best, comparing to how this provenance is performing in this thesis then it can be seen that on the tested sites P3 performs average or below average after 9 years. Without any other shared provenances not much more can be said regarding this difference and what is causing it. There is also test in Germany where diameter, height and straightness were measure after 15 years and 31 years (Weiser, 1981; Weiser 1996). At both times no significant differences were found between provenances regarding diameter or height growth. The results from Weiser (1981, 1996) also found significant differences between provenances regarding straightness. The ranking of the different provenance changes a bit over the years but no large shifts in what provenances perform well. What is of interest is that the average score for each provenance is degrading over time, indicating that the final proportion of high-quality trees is lower than estimated at this time. This means that disregarding the straightness in favour of growth might be more of a
22
risk. Comparing straightness between the studies is not possible since Weiser uses a different grading for straightness. According to Pâques (2013) there are also provenance trails in Belgium, the Czech Republic and the Netherlands, however there are no published result or results have not been found due to language differences. The difference between provenances in drought tolerance is in line with the results of a study that compared the effect of warming and water stress on different provenances of sycamore (Carón et al., 2015). This further indicates that choosing a drought tolerant provenance can be beneficial on dry sites.
4.2 Families
The heritability rates for the tested rates are moderate. What further can be seen is a large standard deviation in the heritability. The results from dbh show a large increase in heritability when the plot variance is not tested, this indicates that all test that are run without this factor could be an overestimation of heritability. However when the plots are included for straightness is Sorø then no decrease in heritability is visible. The coefficient of variation is comparable for the different sites for height and is also not too far off for straightness. This coefficient is larger when comparing the sites for dbh and might help explain why Drastrup to be not significant.
The genetic correlations between the growth indicators indicates that selecting for height should also increase the genetics for diameter and visa versa. The correlation is not there between either of the growth indicators and straightness, but is at least not negative therefore selections can improve one trait without lowering the other. These results can be seen when looking at the table that was constructed for the breeding gains. Height and diameter always increase when there is selected for either of them, while straightness slightly decreases. When selecting for straightness the opposite occurs. However when an effort is made to select both for height and straightness then an increase in both can be realized, even though the gain in straightness is minimal. This does not mean that there is no possibility for improving both traits at the same time, for this thesis only a single combination of weights was tested, a simple one of equal proportions. When establishing seed orchards or improving a breeding program different weights should be tested, that way the most optimal combinations can be found. What is apparent form table 10 is that the possible gain in diameter is the highest and the least for straightness, suggesting that breeding seeds for more diameter growth is likely the most interesting trait improvement in this generation. The exception on this is Drastrup where all traits gain similar improvements when selecting for them. What has to be considered with these results is that beyond the selection of one tree per plot there has not been any spatial considerations. These are purely theoretical gains as spatial distribution plays a large role in selecting trees in a seed orchard. Another note that has to be taken into account when comparing the possible gain between sites is that the current number of trees is varying between sites and thus the selection intensity is varying when reducing to a set number of trees.
4.3 Site
Comparing the 9-year survival across sites it can be seen that survival is higher at Drastrup than Sorø. This is not in line with the growth differences and can probably best be explained by the fact that there are large patches of poor performance on both sites but the larger data set of Drastrup better covers this variation. The patches of poor growth at Sorø might be explained by differences in groundwater level. Jensen et al. (2008) did an extensive test on how soil properties affect sycamore growth in Denmark and found many dying individual trees in wet spots of otherwise healthy stands on soils with stagnant groundwater within the top 40 centimetres of soil. While there has been no test for groundwater level at the sites the soil was rather wet at some places at Sorø and the situation seems similar to that described by Jensen et al.(2008).
For the tested traits there are clear differences between sites, with Drastrup having worse results for height, dbh and straightness. When comparing Drastrup and Tophøj there is a similar precipitation and temperature,
23
but better soil conditions in Drastrup. This raises the question why there is less growth in Drastrup. Likely the difference in competition is part of the explanation. The occurrence of an extensive grass layer has been connected to reduced growth in sycamore (Jensen et al., 2008). The grass layer at Drastrup is well developed and will have caused increased competition. There has been no establishment of grass at Tophøj and other herbaceous vegetation has been mechanically managed further increasing the difference between sites. The wider spacing of the rows might further improve the competitiveness of the grass layer. Another effect that should be considered is that Tophøj has had more maintenance, including the early removal of forks. This can have had an influence on the remaining stand, focussing the growth potential on a single stem. The shelter effect against wind from surrounding stands is rather low on both sites considering a dominant west to south-west wind direction. The higher growth in Sorø compared to Tophøj is in line with the expectations of the soil type, in case of well drained soils growth of sycamore increases with clay content (Jensen et al., 2008). The results of the soil samples also show a higher nutrient content in Sorø than at Tophøj.
When comparing the soil properties with the growth and straightness the only result found is that there is a negative relation with increasing pH and growth while still affecting the straightness positively. When comparing the groupings, it shows that this relation is strongly dependent on few blocks at Sorø that show a very high pH and reduced growth compared to the rest of Sorø. For lower pH there does not seem to be a negative relation. This could indicate that very high pH has a negative impact on the growth of sycamore. Jensen et al. (2008) did not find any relation between growth and pH but did not have many sites with as high a pH as that was found on these blocks in Sorø. It is also not unlikely that there is no causal relation between pH and growth and both are correlating with another factor. Like mentioned before the soil at Sorø is expected to have a high groundwater level at some parts of the site, this could influence both the pH and the growth. Further testing is needed to make conclusions, especially since the number of soil test is low.
5 CONCLUSIONS
The results of this thesis are not entirely sufficient to make clear distinctions between good provenances and provenances to avoid, in most cases only the very best were significantly different from the very worst. This leaves a large group in the middle that are statistically no different from either the best or the worst. However there are some trends visible. Table 12 shows how each provenance compares to the mean on that site/overall for the traits where significant differences were found. What can be seen here is that P10 is the only provenance that scores high on growth and at least average on quality. However is straightness is deemed less of a priority since it will likely be sufficient, than P1 and 8 are also of interest, both these are in the top of growth and above average in forking frequency. P7 scores more average in growth, but scores very good in straightness making this provenance interesting when considering lower density plantings. When only considering quality aspects than P11 and 16 are the top performers, P11 scores excellent on both and P16 excellent in straightness and good on forking frequency. When looking for provenance to avoid in Denmark it can be seen that of the analysed material there are a few provenances that perform poorly on most variables tested, P3, 5 and 15.
24
Table 12: Performance of provenances across traits compared to the average performance. Dbh, height and low forking frequency are presented in percentage from the average, straightness in absolute values from the average. Traits are coloured from green to orange for preferred to undesired performance, each site-trait combination is coloured separately. Provenance are also coloured to indicate how they relate to each other: Dark green (good or average on all traits), Light green (good growth, poor straightness), blue (overall average), yellow (good stem quality, poor growth), grey (only good on one site) and red (poor).
There is some heritability for height/diameter growth and straightness, the estimates shown by this thesis might be a slight overestimation. When trying to improve the genetics for each site by selecting the best 100 trees for a single trait a gain of 13-28% can be realized for diameter growth, 13-15% for height and 7-13% for straightness. When considering both height growth and straightness the gains reduce to 5-21% for diameter, 5-13% for height and 1-6% for straightness.
25
REFERENCE LIST
• Ammer, G. W. R. H. M. B. C. (2008). Growth and nutrition of young European ash ( Fraxinus excelsior
L .) and sycamore maple ( Acer pseudoplatanus L .) on sites with different nutrient and water statuses,
465–479. https://doi.org/10.1007/s10342-008-0230-x
• Carón, M. M., Frenne, P. De, Chabrerie, O., Cousins, S. A. O., Backer, L. De, Decocq, G., Diekmann, M., Heinken, T., Kolb, A., Naaf, T., Plue, T., Selvi, F., Strimbeck, G.R., Wulf, M., Verheyen, K. (2015). Impacts of warming and changes in precipitation frequency on the regeneration of two Acer species. Flora,
214, 24–33. https://doi.org/10.1016/j.flora.2015.05.005
• Cundall, E. P., Cahalan, C. M., & Plowman, M. R. (1998). Early results of sycamore (Acer
pseudoplatanus) provenance trials at farm-forestry sites in England and Wales. Forestry, 71(3), 237–
245. https://doi.org/10.1093/forestry/76.4.385
• Gilmour, A. R., Gogel, B. J., Cullis, B. R., & Thompson, R. (2009). ASReml User Guide 3.0. VSN
International Ltd, 275. https://doi.org/10.1017/CBO9781107415324.004
• Hein, S., Collet, C., Ammer, C., Goff, N. Le, Skovsgaard, J. P., & Savill, P. (2009). A review of growth and stand dynamics of Acer pseudoplatanus L. in Europe: Implications for silviculture. Forestry, 82(4), 361– 385. https://doi.org/10.1093/forestry/cpn043
• Helliwell, D. R., & Harrison, A. F. (1978). Variations in the growth of different seeds of acer pseudoplatanus and betula verrucosa grown on different soils. Forestry, 51(1), 37–46.
• Isik, F., Holland, J., & Maltecca, C. (2017). Genetic Data Analysis for Plant and Animal Breeding. Springer. https://doi.org/10.1007/978-3-319-55177-7
• Jensen, J. K., Rasmussen, L. H., Raulund-Rasmussen, K., & Borggaard, O. K. (2008). Influence of soil properties on the growth of sycamore (Acer pseudoplatanus L.) in Denmark. European Journal of
Forest Research, 127(4), 263–274. https://doi.org/10.1007/s10342-008-0202-1
• Long, J. N. (1992). The silviculture of trees used in British forestry. Forest Ecology and Management (Vol. 55). https://doi.org/10.1079/9781780640266.0000
• Pâques, L. E. (2013). Forest Tree Breeding in Europe. Dordrecht: Springer Science +Business Media. • SAS Institute (2008) https://www.sas.com/en_us/software/stat.html
• Satterthwaite, F. E. (1946). An approximate distribution of estimates of variance components. Biometrics bulletin, 2(6), 110-114
• Sjöstedt, J. (2012). A literature study and survey of sycamore maple ( Acer pseudoplatanus L . ) in
southern Sweden.
• Vacek, S., Vacek, Z., Kalousková, I., Cukor, J., Bílek, L., Moser, W. K., … Podrázský, V. (2018). Sycamore maple ( Acer pseudoplatanus L .) stands on former agricultural land in the Sudetes – evaluation of ecological value and production potential. Dendrobiology, 79, 61–76.
• Weiser, F. (1981). Zielstellung und Ergebnisse einer 15jährigen
Bestandesnachkommenschaftsprüfung bei Bergahorn, Acer pseudoplatanus L. Forstwirschaft, 3 (4), 142-144
• Weiser, F. (1996). Bestandesnachkommenschaftsprüfung von Bergahorn. DerWald, 14, 774 - 777 • White, T. L., Adams, W. T., & Neale, D. B. (2007). Forest Genetics. Oxfordshire: CABI Publishing.
26
APPENDIXES
Appendix 1: provenance tests
A table presented on the right of the page containing all significance test done regarding provenance differences ordered by site and trait. First the test of fixed test is shown, followed by the outcome of the least mean squares or probability test.
Appendix 2: Correlations
3 tables containing correlation data mentioned in text, the first contains correlation between provenances for significant traits across sites. The second table contains correlations for provenances between wilting and growth/survival. The third table is the genetic correlations between traits for each site for dbh, height and straightness.
TABLE 1 DBH HEIGH T STRAIGHTNESS L_FORKING DRASTRUP/TOPHOJ 0.26 0.67 0.51 0.51 DRASTRUP/SORO 0.47 0.64 0.78 0.36 TOPHOJ/SORO 0.55 0.76 0.74 0.49 TABLE 2 correlation WILTING-DBH -0.095 WILTING-HEIGHT 0.3092 WILTING-SURVIVAL 0.4781 GENETIC
CORRELATIONS HEIGHT/DBH HEIGHT/ STRAIGHTNESS DBH/ STRAIGHTNESS
1 * 0.2386 *
2 0.9438 -0.0498 -0.0934
27
Appendix 3: soil samples
The first table shows the specific values for the soil samples by block, the second table shows the x and y coordinate where the sample was taken.
Tophøj x y 1a 17 10 1b 17 70 2 25 20 3 25 60 4a 4 130 4b 4 170 5 14 100 6 25 100 7 14 140 8 25 140 9a 12 170 9b 27 170 Drastrup 1 6 20 2 18 20 3 30 20 4 6 60 5 18 60 6 30 60 7 6 100 8 18 100 9 30 100 Sorø 1 6 20 2 18 20 3 30 20 4 42 20 5 56 20 6 12 52 7 30 52 8 42 52 9 56 52
site blok Mg (mg/100 gts.) P (mg/100 gts.) K (mg/100 gts.) Reaction count pH
1 3.3 5.3 8.2 6.1 5.6 2 3.9 4.4 6.7 6.4 5.9 3 2.5 5.7 2.5 5.7 5.2 4 2.5 4.8 2.1 6.3 5.8 5 2.9 4.5 2.8 6.1 5.6 6 3.1 4.2 2.6 6 5.5 7 4.5 4.1 2.7 6.3 5.8 8 4.2 3.1 1.8 6.3 5.8 9 4.8 2.7 2.1 6.2 5.7 mean 3.5 4.3 3.5 6.2 5.7 1a 2.4 1.3 4.9 6.9 6.4 1b 2.5 2.3 4.9 5 4.5 2 1.7 2.2 3.1 5.3 4.8 3 2.8 2.7 6.1 5.4 4.9 4 2.65 2.25 5.1 5.5 5 5 2.6 2.2 3.8 5.2 4.7 6 1.4 2.3 3.1 5.2 4.7 7 2.3 2.3 5.8 5.1 4.6 8 1.9 1.7 4.7 5.3 4.8 9a 2.8 1.3 5.3 5.6 5.1 9b 3.6 2.6 8.7 5.8 5.3 mean 2.3 2.2 4.8 5.4 4.9 1 9.1 2.1 9.2 7.4 6.9 2 6.8 4.8 8.6 5.9 5.4 3 6.3 2.8 10 5.7 5.2 4 4.8 2.3 6.7 7.4 6.9 5 17 2.4 7.9 6.9 6.4 6 6.8 1.6 7.6 5.3 4.8 7 8.1 5.5 7.8 5.1 4.6 8 6.5 3.7 6.8 5.1 4.6 9 8.2 2.6 7 7.1 6.6 mean 8.2 3.1 8.0 6.2 5.7 Sorø Tophøj Drastrup