Bachelor Thesis Report Malmö University
15 credit points Health and Society
Biomedical Science program 205 06 Malmö
Mars 2019
EXPLORING AMINO ACID
METABOLISM IN
SACCHAROMYCES
CEREVISIAE
FOR IMPROVED
ECO-EFFICIENT PRODUCTION OF
CHIRAL AMINE
1
EXPLORING AMINO ACID
METABOLISM IN
SACCHAROMYCES
CEREVISIAE
FOR IMPROVED
ECO-EFFICIENT PRODUCTION OF
CHIRAL AMINE
ANNA KARLSSON
Karlsson A. Exploring amino acid metabolism in Saccharomyces cerevisiae for improved eco-efficient production of chiral amine. Degree project in Biomedical
Laboratory Science 15 Credits. Malmö University: Faculty of Health and Society,
Department of Biomedical Science, 2019.
Chiral amines are used in several types of pharmaceuticals as both active substrates and building blocks, and there is an endeavor to find new and more eco-efficient ways to produce them than today’s production with kinetic resolution. Biotransformation in yeast has shown great potential for production and is also seen as an eco-friendly way to produce chiral amines. Amino acids can be used as an amino donor for the production of chiral amines, e.g. 1-methyl-3-phenylpropylamine (MPPA) from prochiral ketones, e.g. benzylacetone (BA) with aminotransaminase. In this study the production was done with metabolically engineered Saccharomyces cerevisiae, with the gene for the enzyme CV-ωTA transformed. Ten different amino acids were screened in up to three different concentrations for each amino acid. Production of MPPA was observed for all amino acids, with alanine as the most efficient followed by lysine. No clear relationship was seen between amino acid concentration and MPPA production. The production of MPPA for several amino acids were quicker than expected and was completed at day three. Our data indicated a cytotoxic effect of BA at higher concentrations, that negatively affected the production of MPPA.
Keywords: 1-methyl-3-phenylpropylamine amino acid, aminotransaminase,
biotransformation, chiral amine, metabolically engineered, Saccharomyces
2
UNDERSÖKNING AV
AMINOSYRAMETABOLISMEN I
SACCHAROMYCES CEREVISIAE
FÖR MER EFFEKTIV PRODUKTION
AV KIRALA AMINER
ANNA KARLSSON
Karlsson A. Undersökning av aminosyrametabolismen i Saccharomyces cerevisiae för mer effektiv produktion av kirala aminer. Examensarbete i biomedicinsk
laboratorievetenskap 15 högskolepoäng. Malmö Universitet: Fakulteten för hälsa
och samhälle, Institutionen för biomedicinsk vetenskap, 2019.
Kirala aminer används idag både som aktiva substanser och som bindningsmedel i flertalet läkemedel, dock är dagens produktion med kinetic resolution ineffektiv vilket gör att mer effektiva och miljövänliga produktionssätt eftersträvas. Biotransformation har visat sig både vara miljövänligt och en effektiv metod för att producera kirala aminer. Aminosyror kan användas som aminodonatorer för att producera den kirala aminen 1-methyl-3-phenylpropylamine (MPPA) från prokirala ketonen bensylaceton (BA) med hjälp av aminetransaminas. I denna studie användes metaboliskt konstruerad Saccharomyces cerevisiae med enzymet CV-ωTA för att identifiera vilka aminosyror som var bäst lämpade för MPPA produktion. MPPA produktion kunde detekteras för alla testade aminosyror. Aminosyrans koncentration hade ingen tydlig påverkan på produktionen av MPPA. Alanin vara den aminosyra som gav högst produktionsutbyte följt av lysin. Ingen tydlig relation mellan produktion av MPPA och aminosyrornas koncentrationer kunde ses. Produktionen av MPPA var snabbare än förväntat och var klar redan dag tre för flera av aminosyrorna. Det fanns en antydan att BA kunde vara toxiskt för cellerna i högre koncentrationer och därmed påverka produktionen av MPPA.
Nyckelord: 1-metyl-3-fenylpropylamin, aminetransaminas, aminosyra, biotransformation, kirala aminer, metabolisk konstruktion, Saccharomyces
3
ABBREVIATIONS AND ACRONYMS
ATA Amine transaminase
BA Benzylacetone
CV-ωTA ω-transaminase originating from C. violaceum.
DW Dry weight
MPPA 1-methyl-3-phenylpropylamine
OD Optical density
OH 4-phenyl-2-butanol
PLP Pyridoxal 5´phosphate
RS-HPLC Rapid Separation High Pressure Liquid Chromatography
VPC Viability plate count
YP Media containing yeast extract and peptone
4
TABLE OF CONTENTS
INTRODUCTION ... 5
Transaminase ... 5
Equilibrium of the reaction ... 5
Biotransformation ... 6
Using S.cerevisiae and amino acids for chiral amine production ... 6
Aim ... 7
Problems ... 7
Ethical consideration ... 7
METHOD AND MATERIAL ... 7
Amino acids ... 7 Yeast strains ... 8 Cell cultures ... 8 Experimental setup ... 9 pH-measurement ... 10 Viability control ... 10 RS-HPLC analysis ... 10 Fermentation ... 11 RESULTS ... 11
Alanine in YP and YPD media ... 11
MPPA production for the remaining amino acids ... 12
Fermentation ... 13 DISCUSSION ... 14 Method discussion ... 14 Result discussion ... 15 CONCLUSIONS ... 17 ACKNOWLEDGMENTS ... 17 REFERENCES ... 18 ATTACHMENT 1 ... 17 ATTACHMENT 2 ... 18 ATTACHMENT 3 ... 19 ATTACHMENT 4 ... 20
5
INTRODUCTION
Chiral amines are an essential chemical building block for numerous types of pharmaceuticals. They can also be found as active substances in medications for Alzheimer, HIV and malaria. New ways to manufacture these substances to improve the eco-efficiency and to lower costs will not only favor the industry, but also the community. Chiral amines are a kind of enantiomer. An enantiomer is used to describe a chemical that differs from its mirror image. Only one of the enantiomers can be used in pharmaceuticals. Examples of chiral substances are amino acids and sugar. The chiral structure is one of the major obstacles for efficient production of chiral amines [1]. Today’s production with kinetic resolution has only a theoretical yield of 50% and there is a pursuit for new and more efficient methods [2]. The use of biocatalysis for production of chiral amines have shown great potential in the last couple of years [1,3].
Transaminase
In biocatalysis, certain enzymes can be used to produce chiral amines. Transaminases transfer an amino group from an amino donor to an amino acceptor. Alanine and isopropylamine have previously been used as amino donors for biocatalytic reactions. The amino acceptor usually has a carbonyl or carboxyl group. The amino group replaces the double-bonded oxygen in a transaminase reaction. All transaminases are dependent on pyridoxal 5´phosphate (PLP) for its enzymatic activity. Transaminases have traditionally been grouped as either alpha- or omega- transaminases depending on the relative position of the amino group to be transferred. An alpha-transaminases targets only amines on the alpha position in an amino acid, while omega-transaminases can target non-alpha amines. Amine transaminase (ATA) is a subgroup to ω-Transaminase (ω-TA). ATA differs from other transaminases since there is no demand on the amino acceptor to have a carboxyl group for the amino group transfer. Chiral amines can therefore be produced directly from the prochiral ketone with ATA [3] and a wide range of amine donors.
Equilibrium of the reaction
Direct conversion of ketones to amines with ATA often results in an unfavorable thermodynamic equilibrium. This poses the biggest challenges with an efficient production of chiral amines with biocatalysis. For a more favorable production, the equilibrium is needed to be driven towards the product and co-product [2-3]. The equilibrium can be driven towards the product by adding an abundance of the amino donor, or by removing the co-product during the reaction. Increasing the concentration of the donor have shown not to be very efficient. One in vitro study showed that a ten times increase of the amino donor only enhanced the exchange of the product by 3% [4]. Removal of co-product during a reaction can be done in several ways, for example, liquid-liquid extraction can be used for a biocatalysis reaction to lower the concentration of a co-product [2]. The co-product removal can also be done with an innate reaction within the cell. For example, when lysine is used as an amine donor, the co-product 6-amino-2-oxohexanoic acid will be formed. This compound will decarboxylate spontaneously within a cell which results in a continuous removal of the co-product [5].
6
Biotransformation
The production with biocatalysis can be done in vitro and in vivo. An in vitro production demands purified enzymes and co-factors which will increase the cost of the production. Biotransformation is the modification of a substance in a living cell. Biotransformation lowers the cost since there is no need for purified substances due to the continuous production of the enzymes and co-factors within the cell [6]. Two of the requirements for biotransformation production in living cells are that the substrate or the products are non-toxic to the cell. The efficiency of the amino donor can partially be predicted by foreseeing which co-product will be produced. If the co-product has a harmful impact on the cell a lower production is expected. Biotransformation considers an environmentally friendly way for pharmaceutical production due to low energy consumption and minimal generation of waste [7].
Saccharomyces cerevisiae
The yeast S. cerevisiae known ability to produce alcohol from sugar has made it favorable to use in the production of wine and beer since the 19th century [7]. It has also shown to be useful in the production of insulin and in the development of vaccines, and today 20% of biopharmaceuticals are produced with S. cerevisiae. The extensive knowledge of S. cerevisiae genome makes it a good candidate to use in metabolic engineering [8]. Some of the great advantages for using yeast in biotransformation is that the production can be done close to pH 7, at low temperature (30°C) and at atmospheric pressure. This makes the production not only environmentally friendly but also safe for personnel compared with chemical synthesis [7].
Using S. cerevisiae and amino acids for chiral amine production
The essential amino acids are important building blocks for cellular growth and survival. S. cerevisiae can withstand high concentrations of amino acids and thrive on a single amino acid as the sole source of nitrogen, with the exception of lysine, histidine and cysteine. Furthermore, essential amino acids are readily taken up by the cell with the help of specific permeases that are upregulated by extracellular amino acid concentrations. It is therefore interesting to see how good their amino donor aptitudes are for ATA and whole-cell biocatalysis [9].
Since S. cerevisiae do not express the gene for ATA naturally, the enzyme CV-ωTA, was previously metabolically engineered into S. cerevisiae. The resulting strain contains six copies of the gene coding for CV-ωTA [10].
In a previous study, this strain has shown a production yield of 50% in a mineral medium for producing the chiral amine (s)-1-phenylethylamine from the prochiral ketone acetophenone with alanine as amino donor. This study also shows production of the alcohol (s)-1-phenylethanol in a small amount which indicates that there is an endogenous acetophenone reductase active in the system [10]. In this study, the production of the chiral amine 1-methyl-3-phenylpropylamine (MPPA) from the prochiral ketone benzylacetone (BA) by ATA in metabolically engineered S. cerevisiae was investigated, the reaction can be seen in figure 1.
7
Figure 1: The transaminase reaction for producing 1-methyl-3-phenylpropylamine (MPPA) from
benzylacetone (BA). Amino acid and co-product differs for each experiment (see also Table 1).
Aim
The aim of this study was to identify which amino acids were compatible with ATA (CV- ωTA), and how efficient the amino acids were for the production of the chiral amine 1-methyl-3-phenylpropylamine from the prochiral benzylacetone in metabolic engineered S. cerevisiae.
Problems
If and how does the presence of benzylacetone reductase affect the production of MPPA? Is there a correlation between the productivity and the viability of the cells? Do the charged side chains on amino acids affect the production of MPPA?
Ethical consideration
In this study, metabolic engineered yeast was used. Applied Microbiology department at LTH had already all the required permissions for working with genetically modified cells. The yeast was autoclaved before the disposable to make sure no living cells or spoors got outside the laboratory. All Eppendorf tubes, Falcon tubes, and pipette tips were disposable as biological waste and were destroyed according to existing regulations. The reference strain was made from simple baker yeast strain and could be disposed of in the ordinary waste.
METHOD AND MATERIAL
This project was performed at Applied microbiology at Lund University, ten different amino acids were tried as amino donor in three different concentrations (1.0M, 0.5M and 0.25M) in media with and without glucose. Finally, a fermentation was done with alanine as amino donor.
Amino acids
The amino acids were screened in glass vials separately with both the metabolically engineered strain and the reference strain for up to six days. To be able to detect MPPA production, only amino acids with a solubility of at least 0.25M in media were tested. List of amino acids and in which concentrations they were tested can be seen in table 1.
8
Table 1: Amino acids used for screening with ATA, in which concentrations, their molecular
weight (MW) and supplier.
Yeast strains
The experiment was done on cells in the late exponential growth phase. S.
cerevisiae reach stationary phase around OD 23-26. To guarantee the cells were in
exponential phase the cells never grew beyond OD 20. The two strain that were used in this project are displayed in table 2.
Table 2: Overview of the strains used in the project, both provided by Applied microbiology (TMB)
at Lund University.
Name Copies of CV-ωTA Species Reference
TMB4131 (x0) x0 ATA S. cerevisiae TMB
TMB4375 (x6) x6 ATA S. cerevisiae [10]
Cell cultures
The media used in this project was YP media containing yeast extract and peptone from Merck Millipore (Burlington, USA). YPD media was based on YP media with glucose from a stock solution provided by TMB.
Yeast strains were inoculated from -80°C and kept on YPD 2% agar plates in a refrigerator at 4-8°C during the study. Every cell culture for each trial originated from these agar plates.
The pre-cultivation of both strains took three days. A quarter of a colony was inoculated in Falcon tube with 3ml YPD 2% liquid medium overnight at 30°C with a shake (180 rpm). Following day, the cell culture had an optical density (OD) concentration between 16-18 which indicates that the culture was in an exponential phase. OD was measured with Eppendorf Biophotometer 6131 (Hamburg, Germany) at 600nm. The cells were inoculated yet again but in baffled culture flasks with YPD 5% (YPD) liquid media with a concentration of OD 0.00305 and incubated at 30°C with shake overnight. The cells needed to be in the exponential phase when starting the trials and the OD were measured to guarantee this. The preparations of agarplates and liquid media can be seen in table 3.
Amino acid Concentration MW
(g/mol)
Supplier
Alanine (Ala) 1.0M 0.5M 0.25M 89.09 Sigma Aldrich
Arginine (Arg) 1.0M 0.5M 0.25M 174.2 ICN Biomedicals
Glycine (Gly) 1.0M 0.5M 0.25M 75.07 Sigma Aldrich
Lysine (Lys) 1.0M 0.5M 0.25M 182.6 Sigma Aldrich
Proline (Pro) 1.0M 0.5M 0.25M 115.13 Sigma Aldrich
Threonine (Thr) 0.5M 0.25M 119.12 ICN Biomedicals
Valine (Val) 0.5M 0.25M 117.1 Sigma Aldrich
Histidine (His) 0.25M 155.16 ICN Biomedicals
Methionine (Met) 0.25M 149.21 Sigma Aldrich
9 Table 3: Preparation of agarplates and liquid media
Substrate YPD 2% (agar plates) YPD 2% (media) YPD 5% (media) YP (media)
Yeast extract 10g 10g 10g 10g Peptone 20g 20g 20g 20g Glucose 40% 50ml 50ml 125ml - MilliQ water 950ml 950ml 875ml 1000ml Agar agar 20g - - - Experimental setup
The amino acids were tested with YPD liquid media. In addition, alanine and lysine were also tested with YP media without glucose. The amino acids were dissolved in YPD media or YP media with 5mM BA in a 25ml vial for the highest concentration. The lower concentrations were then diluted from this solution. Before adding the cells, the final volume was checked to be 10ml in every vial. The cells were measured with OD and the volume of cells needed to give a concentration of OD 25 in each vial was pipetted to a 50ml Falcon tube, the tubes were then centrifuged at 3220g for 5 minutes with Eppendorf 5810R (Hamburg, Tyskland). The supernatant was poured out and the cells were resuspended in the amino acid solution from the vials. A sample was taken directly after the adding of the cells and stored on ice until all samples had been taken. The vials were closed with rubber corks that were pierced with a needle and syringe with cotton in it to provide the system with oxygen. The vials were kept during the trial in a water bath at 30°C with constant stirring using a 20mm magnetic stirrer. The sample taken was 800µl and were pipetted to an Eppendorf tube. The samples was taken from the bottom of the vials after making sure the solution was homogeneous. The samples were kept on ice and centrifuged at 9000g for 3 minutes with Eppendorf 5424R (Hamburg, Tyskland). The supernatant was then pipetted to another Eppendorf tube and kept frozen until analysis. An overview of the experiment can be seen in figure 2.
10
Figure 2: An overview of the experimental setup with pre-cultivations, analysis of viability and
supernatant.
pH-measurement
The pH of the amino acid solutions was measured before adding the cells and after, the measurement was done after three or six days for the highest concentration for each trial. The measurement was done with Mettler Toledo fiveeasy™ (Columbus, USA).
Viability control
The cells viability was measured in the beginning of the project with viability plate count (VPC). VPC was later replaced with flow cytometry which have a higher certainty.
VPC was done on YPD 2% agar plates, the cells were diluted to a concentration of approx. 500cells/ml with MilliQ™ water day zero and the same dilution series was used for the remaining days of the trail.
For analysis with flow cytometry, BD accuri C6 (Franklin Lakes, USA) was used. The cell pellet recovered from the centrifuged sample was washed with MilliQ™ water before diluted in phosphate buffered saline (PBS). The dye propidium iodide (PI) was used to separate dead cells from living, which will give a percentage of viable cells. Before analysis, the cells were diluted to OD 0.2 with PBS and 6µl of PI was added to 500µl of cells.
RS-HPLC analysis
Before analyzing, the supernatant was filtered with a 0.22µm filter. The analysis was done with Ultimate 3000 RS-HPLC (Rapid Separations High-Pressure Liquid Chromatography) system from Thermo Fisher Scientific (Waltham, USA), with a reverse phase column (Kintex 2.6u EVO c18 100A, 50x2.1 mm) from Phenomenex (Torrance, USA). The mobile phase was combined by 80% MilliQ water with
11
NaOH at pH 11.3 and 20% pure acetonitrile. The pump was set on 500 µl/minute and analysis was done under 20MPa pressure. The detection was done with Ultimate 3000 variable wavelength detector with UV detection at 260nm. The injection volume was 1µl. Since the presence of an endogenous benzylacetone reductase that will convert BA to 4-phenyl-2-butanol (OH) cannot be excluded, OH was also measured along with BA and MPPA. The retention time was approximately 3.0 minutes for OH, 3.7 minutes for BA and 4.2 minutes for MPPA. An Internal standard was used to determine the concentrations of the samples, a new standard was prepared for each analysis.
Fermentation
Fermentation was done in 180ml YP media with a 0.25M concentration of alanine without air inflow. The pH was buffered at 5.0 ± 0.25 with potassium hydroxide and sulfuric acid. The stirring was 200 rpm. The biomass was monitored with dry weight (DW) and OD. DW was measured accordingly. 1.0ml of the sample was placed on a wet filter paper weighed in advanced, a vacuum was created so all the water was driven through the filter paper, leaving the yeast. The paper was dried (70℃) over night and weight. DW is calculated as the difference in weight before and after the sample. Viability were analysed with flow cytometry. The fermentation was done with Infors HT Multifors fermenter (Bottmingen, Switzerland).
RESULTS
Amino donor efficiency differed between amino acids. The impact of concentration on MPPA production was nonconclusive. Highest yield for lysine and arginine was observed in 0.5M and 0.25M respectively, see tables 6-7. For glycine, proline, valine and threonine there was a small but not significant variation in production between different concentrations, see table 7. For alanine the results were inconclusive, for the trial with YPD there was a correlation between amino acid concentration and MPPA production, but this could not be seen in YP media or the trials over three days, see tables 4-5. The x0 strain had no MPPA production for any amino acid while the x6 strain had MPPA production for all amino acids.
Alanine in YP and YPD media
The production of MPPA with alanine as amino donor showed to have great efficiency. High yield was observed with both YP and YPD media already on day three. For YP media the production had reached its maximum yield of 100%, and for YPD media the yield was 50%. For the first trial with alanine in YP media, the conversion yield was near 100% for all concentrations, see table 4. The start concentration for BA was low for this trial; 1.1mM, see attachment 1. The second trial for alanine in YP media gave a conversion of 41% but had a much higher start concentration of BA of 4.1mM, see attachment 1.
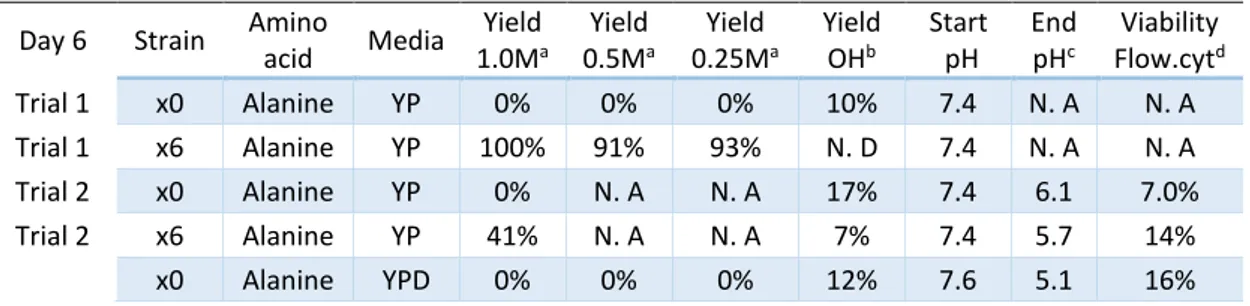
Table 4: Result for trials with alanine as amino donor under six days.
Day 6 Strain Amino
acid Media Yield 1.0Ma Yield 0.5Ma Yield 0.25Ma Yield OHb Start pH End pHc Viability Flow.cytd Trial 1 x0 Alanine YP 0% 0% 0% 10% 7.4 N. A N. A Trial 1 x6 Alanine YP 100% 91% 93% N. D 7.4 N. A N. A Trial 2 x0 Alanine YP 0% N. A N. A 17% 7.4 6.1 7.0% Trial 2 x6 Alanine YP 41% N. A N. A 7% 7.4 5.7 14% x0 Alanine YPD 0% 0% 0% 12% 7.6 5.1 16%
12
x6 Alanine YPD 50% 32% 17% 10% 7.6 5.2 18%
a The concentration of alanine in the media, b The yield of OH for day 6, c Measured at day 6, d Flow cytometry collected day 6. N.A – Not available. N.D – Not detected.
Alanine was also tested for day 0-3 which gave a conversion of 57% from BA to MPPA in YP media on day three. The trial over three days with alanine in YPD media gave a production yield of 47%, see table 5.
Table 5: Results for trials with alanine as amino donor under three days.
Day 3 Strain Amino
acid Media Yield 1.0Ma Yield 0.5Ma Yield 0.25Ma Yield OHb Start pH End pHc Viability Flow.cytd x0 Alanine YP 0% 0% N. A 21% 7.4 6.1 54% x6 Alanine YP 57% 51% N. A 5.0% 7.4 5.7 48% x0 Alanine YPD 0% N. A N. A 15% 7.6 5.0 29% x6 Alanine YPD 47% N. A N. A 9.0% 7.6 5.0 35%
a The concentration of alanine in the media, b The yield of OH for day 3, c Measured at day 3, d Flow cytometry collected day 3. N.A – Not available.
Alanine had greater production of OH in the x0 strain than for x6 strain and no production was observed for the x6 strain in the first trial of alanine in YP media. In figure 3, the concentrations of BA, MPPA and OH together with viability determined with flow cytometry can be seen for the trial with alanine in YP media with 1.0M and 0.5M concentration.
Figure 3: Three-day trial with alanine in YP media in 25ml vials. (a) represent the x0 strain with a
1.0M concentration of alanine. (b) represent x6 strain with 1.0M of alanine. (c) x0 strain with 0.5M alanine and (d) x6 strain with 0.5M alanine.
MPPA production for the remaining amino acids
Lysine gave the second highest yield of MPPA. The highest yield for lysine in YPD media (84%) was received with 0.5M concentration day four. The first trial with lysine in YP media gave a yield of 76% and the rerun had a yield of 24% for 1.0M concentration, see table 6. The first trial of lysine had like alanine a low start value of BA, 2.1mM, see attachment 1.
13 Strain Amino acid Media Yield 1.0Ma Yield 0.5Ma Yield 0.25Ma Start pH End pHb Viability Flow.cytc Trial 1 x0 Lysine YP 0% 0% 0% 6.0 5.1 N. A Trial 1 x6 Lysine YP 76% 84% 41% 6.0 5.1 N. A Trial 2 x0 Lysine YP 0% N. A N. A 6.0 4.8 22% Trial 2 x6 Lysine YP 24% N. A N. A 6.0 4.6 36% x0 Lysine YPD 0% 0% N. A 6.0 N. A N. A x6 Lysine YPD 11% 42% 19% 6.0 N. A N. A
a The concentration of lysine in the media, b Measured at day 6, c Flow cytometry results collected
day 6. N.A- Not available
The remaining amino acids gave a lower yield for the MPPA production than alanine and lysine. The highest production yield was only received day six by proline, methionine and histidine, the other amino acids had reached their maximum yield day three or four. The highest yields received with all concentrations of amino acids can be found in table 7.
Table 7: MPPA Production with remaining amino acids.
a The concentration of amino acid in the media, b Measured at day 6, c Flow cytometry results
collected day 6. N.S – Not soluble.
Fermentation
The fermentation was done with 0.25M alanine and with no additional oxygen after the fermentation was started, the highest yield was received day 2. The measurement with OD and DW showed a reduction in the biomass the first day. Flow cytometry showed a significant reduction in viability between day three and four for both strains. The viability data live cells/ live cells day 0 shows a better
Strain Amino acid Media Yield 1.0 Ma Yield 0.5Ma Yield 0.25Ma Start pH End pHb Viability Flow.cytc x0 Glycine YPD 0% 0% 0% 6.9 4.5 6.0% x6 Glycine YPD 18% 17% 15% 6.9 5.0 7.0% x0 Proline YPD 0% 0% 0% 6.9 5.1 9.0% x6 Proline YPD 18% 18% 16% 6.9 5.1 14% x0 Arginine YPD 0% 0% 0% 11 10 14% x6 Arginine YPD 0% 0% 11% 11 10 4.0% x0 Valine YPD N. S 0% 0% 6.7 5.0 21% x6 Valine YPD N. S 10% 9% 6.7 5.1 9.0% x0 Threonine YPD N. S 0% 0% 6.7 5.0 41% x6 Threonine YPD N. S 12% 8% 6.7 5.0 51% x0 Methionine YPD N. S N. S 0% 6.7 5.3 16% x6 Methionine YPD N. S N. S 20% 6.7 5.1 31% x0 Serine YPD N. S N. S 0% 6.8 6.4 14% x6 Serine YPD N. S N. S 11% 6.8 6.4 8.0% x0 Histidine YPD N. S N. S 0% 7.5 6.2 10% x6 Histidine YPD N. S N. S 12% 7.5 6.6 16%
14
view of how well the cells thrive in the media and if there were any cell growth, see table 8 and figure 4.
Table 8: Results from fermentation with alanine as amino donor in YP media.
a Production yield for 0.25M concentration of alanine, b Percentage of live cells for each day, c Percentage of the number of live cells compared to the live cell day zero.
A sample was taken day zero before the cells was added to the media, the concentration obtained without cells was 6.0mM and 5.9mM for the x0 and x6 strain respectively, the concentration with the cells was 4.5mM and 4.3mM respectively. This showed a significant drop in BA concentration of 25-28% before and after the cells was added to the medium.
Figure 4: Diagram for the fermentation trail. (a) represents the x0 strain for 0.25M alanine, (b)
represents the x6 strain for 0.25M alanine.
DISCUSSION
In this project, several amino acids were tested for their capacity to act as amino donors for the conversion of BA into MPPA, with ALA and whole-cell biocatalyst.
Method discussion
YP media with and without sugar was choosen as the screening medium for its buffering capacity and for its simplicity. Initially, this setup worked well for the majority of the amino acids except for arginine. Because of the wide panel of potential amino donors, and because of time restrictions arginine was not repeated
Strain Yielda DW (mg) OD
(600nm) Flow.cytb (%)
Live cells/ Live cells day
0c Day 0 x0 0% 5.9 23.7 98% 100% x6 0% 5.8 23.9 99% 100% Day 1 x0 0% 4.6 19.4 86% 87% x6 38% 4.8 21.6 89% 105% Day 2 x0 0% 4.8 22.2 76% 85% x6 66% 4.8 22.2 86% 116% Day 3 x0 0% 4.6 22.6 87% 99% x6 55% 4.9 24.4 95% 102% Day 4 x0 0% 4.5 22.6 61% 29% x6 51% 4.6 24.4 83% 58% Day 7 x0 0% 4.6 24.2 48% 51% x6 54% 4.6 24.5 64% 87% 0 20 40 60 80 100 120 0 1 2 3 4 5 0 1 2 3 4 7 Vi ab ili ty ( % ) mM Day x0 BA MPPA OH Viability 0 20 40 60 80 100 120 0 1 2 3 4 5 0 1 2 3 4 7 Vi ab ili ty ( % ) mM Day x6 BA MPPA OH
a
b15
under more optimal pH condition. Due to the insecurity of how quick MPPA was produced with ATA, the trails were done under six days for this project. Starting with the first sample after three days. Alanine had reached its maximum yield on day three and lysine on day four. Some amino acids had the highest yield day six, but it cannot be determined that this was the highest possible yield due to the end of the trial. Since alanine showed to have great potential as an amino donor already at day three, its production was further investigate during the three first days. The screening was done with cells in late exponentially phase, this because the synthesis of proteins is greater during the growth than in stationary phase for S.
cerevisiae [11].
In the beginning the viability control was done only with VPC. VPC was timeconsuming and that is the reason why the viability control only was done on the highest concentrations for every amino acid. There was occasionally contamination of the plates which later was explained with a contaminated liquid used for dilution. For these reasons, the VPC was later replaced with flow cytometry and no VPC data is presented due to the uncertainties of the results.
A trial with fermenters would have given fully controlled and uniform conditions and a better overview of the oxygen level and pH of the cultureduring the study. However, the consumption of amino acids and media would have been so much higher it would not be economically justifiable, fermentation is also more time-consuming than screening in vials. Screening in small vials gave an indication of which amino acid would be interesting to use with a fermenter. The concentration of 0.25M was chosen as this had similar production yield as 0.5M and 1.0M with the first trial, which made it possible to cut down on expenses for the project.
Result discussion
The production with alanine as amino donor had the highest production rate, and it capacity as amino donor has been proven by N.Weber et.al [10].
The MPPA production between the different concentrations showed that a higher concentration of the amino donor does not necessarily increase the production substantially. For alanine and lysine in YPD media, there was an increase in production when the different concentrations were compared with each other. This result diverges from the results in previous study done in vitro [4] where the concentration of the amino donor only had a small effect on the production. Since this effect cannot be seen for all amino acids this could be a result of other conditions affecting the production, like start concentration of BA.
The effect of BA on the system
One possible reason for the low start value of BA for the first trial with alanine and lysine may be that the sample was not taken directly after the adding of the yeast day zero. Later the samples were taken direct and put on ice. Because of the high yields (100%) and uncertainties in the initial BA concentration, the experiment was repeated. If BA can bind to the cells the measured concentration in the sample would be lower. The concentration was expected to be lower than 5mM due to the dilution when the cells were added but not that much lower. During the fermentation, the sample taken before and after the cells were added showed a lowering in BA concentration with over 25%. This is a strong indication that BA can bind to the cells and is the reason for the low start value for BA on previously
16
trials in this study. Thus there is no published articles about BA:s effect on cells further analysis are needed.
It was indicated that BA, and MPPA production, could have a toxic effect on the cells in this study. In the first trial with alanine and lysine in YP media, a high yield of 100% and 84% was received respectively, see tables 4-6. Trial number two had a higher start concentration of BA but gave a yield of 45% for alanine and24% for lysine. If BA is toxic, a lower start concentration would give a higher production and higher viability. Due to the contamination problem at the beginning of the project no reliable viability data is available and therefore this assumption cannot be done and more information is needed. If the value of the two trials with alanine are compared it shows that they reach the same concentration of MPPA 1.26mM and 1.32mM (see attachment 1, table 9). This can indicate that MPPA is inhibitory to its own production at certain concentrations. For lysine there is a big variation of MPPA 1.19mM and 0.55mM (see attachment 1, table 9) which indicates that BA have more effect on the system than MPPA.
Production with alanine and lysine as the amino donor
The production yield of 100% for the first trial with alanine in YP media was surprisingly good. There was a complete consumption of BA and no OH production was detected which indicates that all BA have been used for MPPA only. The big difference in the two trials with YP media over six days (41% and 100%) may be due to the big variation in start concentration of BA as mentioned before. Lysine in YPD media gave almost four times higher yield for 0.5M than 1.0M and twice as high for 0.25M than for 1.0M. This could indicate that a high concentration of lysine is inhibitory for MPPA production, that may be due to the basic side chain present on lysine. This variation of MPPA production will need to be future investigated to determine if the concentration of lysine affects the production or not.
The reason why alanine and lysine showed to have the highest yield for all amino acids in this project can be because of the cells natural way for co-product removal, alanine converts to pyruvate that can be used as an alternative energy source in S.
cerevisiae [12], and the co-product 6-amino-2-oxohexanoic acid is decarboxylated
spontaneously when lysine is used as amino donor as mentioned before [5].
Other factors that influenced the MPPA production
Screening with arginine generated no production in either 1.0M or 0.5M concentration, this was due to the high pH within the system, S. cerevisiea do not thrive or survive in such high pH [13].There was a drop in pH for all amino acids which indicates that the growth of S. cerevisiae lowers the pH of the media it grows in. The pH was only measured in the highest concentration screened. Every concentration should have been measured to be able to determine the effect of pH on MPPA production for example in arginine.
The production of OH was higher in the reference strain than in the production strain which indicates that OH production does not interfere the MPPA production. This hypothesis can be supported by the results from the first trial with alanine which showed a 100% conversion of BA to MPPA and no OH production see tables 4 and 7.
17
The variation of media with and without glucose did have a inconclusive effect on the MPPA production, the affect was more significant on the viability of the cells. YPD gave a higher viability in the end of the trials than YP, this is because of the glucose is present in YPD and not in YP that makes it possible for the cells to grow and thrive in the media. Comparing table 9 in attachment 1 and table 12 in attachment 4, the trails over three days had a significant higher viability rate than the cells trial over six days, the reason for this maybe is that all nutrients needed for growth were consumed at this point. No conclusions could be drawn regarding the correlation between viability and MPPA production due to the contamination of the VPC.
CONCLUSIONS
All amino acids work for production of the chiral amine MPPA from the prochiral ketone BA together with ATA. Alanine gave the highest yield followed by lysine. The concentration of alanine showed a correlation between an increase in amino acid and MPPA production for the trail with YPD over 6 days. There was no clear correlation between MPPA production and viability which indicates that the most important factor for a good production rate is the compatibility with the system, like co-product removal.
For future studies the impact of BA should be investigated to see if it affects the viability and the MPPA production, and if there is an optimal concentration of BA to use for MPPA production. It would also be interesting to see in future studies if there is a conversion of BA to MPPA in only YP media without adding amino acids.
ACKNOWLEDGMENTS
I wish to acknowledge the help provided by Arne Hagman and Magnus Carlquist from the department of applied microbiology at Lund University and Carl Grey from the department of biotechnology at Lund University.
18
REFERENCES
1. Nugent T.C (2010) Chiral Amine Synthesis Methods, Developments, and
Applications. Weinheim, WILEY-VCH.
2. Tufvesson P, Lima‐ Ramos J, Jensen J S, Al‐ Haque N, Neto W, Woodley J M, (2011) Process considerations for the asymmetric synthesis of chiral amines using transaminases. Biotechnology and Bioengineering, 108(7), 1479–1493.
3. Gomm A, O’Reilly E, (2018) Transaminases for chiral amine synthesis.
Current Opinion in Chemical Biology, 43, 106–112.
4. Truppo M D, Rozzell J D, Moorec J C, Turner N J, (2009) Rapid screening and scale-up of transaminase catalyzed reactions. Org Biomol Chem, 7, 395– 398.
5. Lo H-H, Hsu S-H, Lin W-D, Chan N-L, Hsu W-H (2005) Asymmetrical Synthesis of L-Homophenylalanine Using Engineered Escherichia coli Aspartate Aminotransferase. Biotechnol. Prog, 21, 411−415.
6. Tufvesson P, Lima‐ Ramos J, Nordblad M, Woodley J M (2011) Guidelines and cost analysis for catalyst production in biocatalytic processes. Org
Process Res Dev, 15, 266-274.
7. Hegazy M F, Mohamed T A, El-Shamy A I, Mohamed A H, Mahalel U A, Reda E H, Shaheen A M, Tawfik W A, Shahat A A, Shams K A, Abdel-Azim N S, Hammouda F M, (2015) Microbial biotransformation as a tool for drug development based on natural products from mevalonic acid pathway: A review. J Adv Res, 6(1), 17–33.
8. Nielsen J, (2013) Production of biopharmaceutical proteins by yeast Advances through metabolic engineering. Bioengineered, 4(4), 207–211. 9. Ljungdahl P O, Daignan-Fornier B, (2012) Regulation of amino acid,
nucleotide and phosphate metabolism in Saccharomyces cerevisiae.
Genetics, 190, 885-929.
10. Weber N, Gorwa-Grauslund M, Carlquist M, (2017) Improvement of whole-cell transamination with Saccharomyces cerevisiae using metabolic
engineering and cell pre-adaption. Microb Cell Fact 16(3), 1-12. 11. Boucherie H, (1985) Protein synthesis during transition and stationary
phases under glucose limitation in Saccharomyces cerevisiae. J Bacteriol,
161(1), 385–392.
12. Pronk J T, Steensmay H Y, Van Dijken J P, (1996) Pyruvate Metabolism in Saccharomyces cerevisiae. Yeast, 12(16), 1607-1633
13. Salari R, Salari R (2017) Investigation of the Best Saccharomyces cerevisiae Growth Condition. Electron Physician, 9(1), 3592–3597.
Bachelor Thesis Report Malmö University
15 credit points Health and Society
Biomedical Science program 205 06 Malmö
Mars 2019
ATTACHMENT 1
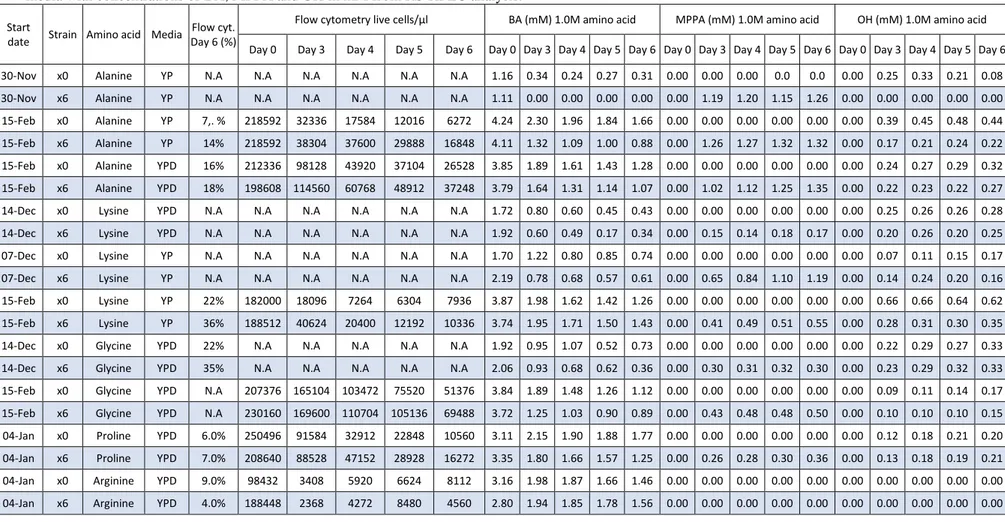
Table 9: All data collected for amino acids with 1,0M concentration with Flow cytometry (flow.cyt) in both percentages and concentration of living cells in the
media with concentrations of BA, MPPA and OH in mM from RS-HPLC analysis.
Start
date Strain Amino acid Media
Flow cyt. Day 6 (%)
Flow cytometry live cells/µl BA (mM) 1.0M amino acid MPPA (mM) 1.0M amino acid OH (mM) 1.0M amino acid Day 0 Day 3 Day 4 Day 5 Day 6 Day 0 Day 3 Day 4 Day 5 Day 6 Day 0 Day 3 Day 4 Day 5 Day 6 Day 0 Day 3 Day 4 Day 5 Day 6 30-Nov x0 Alanine YP N.A N.A N.A N.A N.A N.A 1.16 0.34 0.24 0.27 0.31 0.00 0.00 0.00 0.0 0.0 0.00 0.25 0.33 0.21 0.08 30-Nov x6 Alanine YP N.A N.A N.A N.A N.A N.A 1.11 0.00 0.00 0.00 0.00 0.00 1.19 1.20 1.15 1.26 0.00 0.00 0.00 0.00 0.00 15-Feb x0 Alanine YP 7,. % 218592 32336 17584 12016 6272 4.24 2.30 1.96 1.84 1.66 0.00 0.00 0.00 0.00 0.00 0.00 0.39 0.45 0.48 0.44 15-Feb x6 Alanine YP 14% 218592 38304 37600 29888 16848 4.11 1.32 1.09 1.00 0.88 0.00 1.26 1.27 1.32 1.32 0.00 0.17 0.21 0.24 0.22 15-Feb x0 Alanine YPD 16% 212336 98128 43920 37104 26528 3.85 1.89 1.61 1.43 1.28 0.00 0.00 0.00 0.00 0.00 0.00 0.24 0.27 0.29 0.32 15-Feb x6 Alanine YPD 18% 198608 114560 60768 48912 37248 3.79 1.64 1.31 1.14 1.07 0.00 1.02 1.12 1.25 1.35 0.00 0.22 0.23 0.22 0.27 14-Dec x0 Lysine YPD N.A N.A N.A N.A N.A N.A 1.72 0.80 0.60 0.45 0.43 0.00 0.00 0.00 0.00 0.00 0.00 0.25 0.26 0.26 0.28 14-Dec x6 Lysine YPD N.A N.A N.A N.A N.A N.A 1.92 0.60 0.49 0.17 0.34 0.00 0.15 0.14 0.18 0.17 0.00 0.20 0.26 0.20 0.25 07-Dec x0 Lysine YP N.A N.A N.A N.A N.A N.A 1.70 1.22 0.80 0.85 0.74 0.00 0.00 0.00 0.00 0.00 0.00 0.07 0.11 0.15 0.17 07-Dec x6 Lysine YP N.A N.A N.A N.A N.A N.A 2.19 0.78 0.68 0.57 0.61 0.00 0.65 0.84 1.10 1.19 0.00 0.14 0.24 0.20 0.16 15-Feb x0 Lysine YP 22% 182000 18096 7264 6304 7936 3.87 1.98 1.62 1.42 1.26 0.00 0.00 0.00 0.00 0.00 0.00 0.66 0.66 0.64 0.62 15-Feb x6 Lysine YP 36% 188512 40624 20400 12192 10336 3.74 1.95 1.71 1.50 1.43 0.00 0.41 0.49 0.51 0.55 0.00 0.28 0.31 0.30 0.35 14-Dec x0 Glycine YPD 22% N.A N.A N.A N.A N.A 1.92 0.95 1.07 0.52 0.73 0.00 0.00 0.00 0.00 0.00 0.00 0.22 0.29 0.27 0.33 14-Dec x6 Glycine YPD 35% N.A N.A N.A N.A N.A 2.06 0.93 0.68 0.62 0.36 0.00 0.30 0.31 0.32 0.30 0.00 0.23 0.29 0.32 0.33 15-Feb x0 Glycine YPD N.A 207376 165104 103472 75520 51376 3.84 1.89 1.48 1.26 1.12 0.00 0.00 0.00 0.00 0.00 0.00 0.09 0.11 0.14 0.17 15-Feb x6 Glycine YPD N.A 230160 169600 110704 105136 69488 3.72 1.25 1.03 0.90 0.89 0.00 0.43 0.48 0.48 0.50 0.00 0.10 0.10 0.10 0.15 04-Jan x0 Proline YPD 6.0% 250496 91584 32912 22848 10560 3.11 2.15 1.90 1.88 1.77 0.00 0.00 0.00 0.00 0.00 0.00 0.12 0.18 0.21 0.20 04-Jan x6 Proline YPD 7.0% 208640 88528 47152 28928 16272 3.35 1.80 1.66 1.57 1.25 0.00 0.26 0.28 0.30 0.36 0.00 0.13 0.18 0.19 0.21 04-Jan x0 Arginine YPD 9.0% 98432 3408 5920 6624 8112 3.16 1.98 1.87 1.66 1.46 0.00 0.00 0.00 0.00 0.00 0.00 0.00 0.00 0.00 0.00 04-Jan x6 Arginine YPD 4.0% 188448 2368 4272 8480 4560 2.80 1.94 1.85 1.78 1.56 0.00 0.00 0.00 0.00 0.00 0.00 0.00 0.00 0.00 0.00
18
ATTACHMENT 2
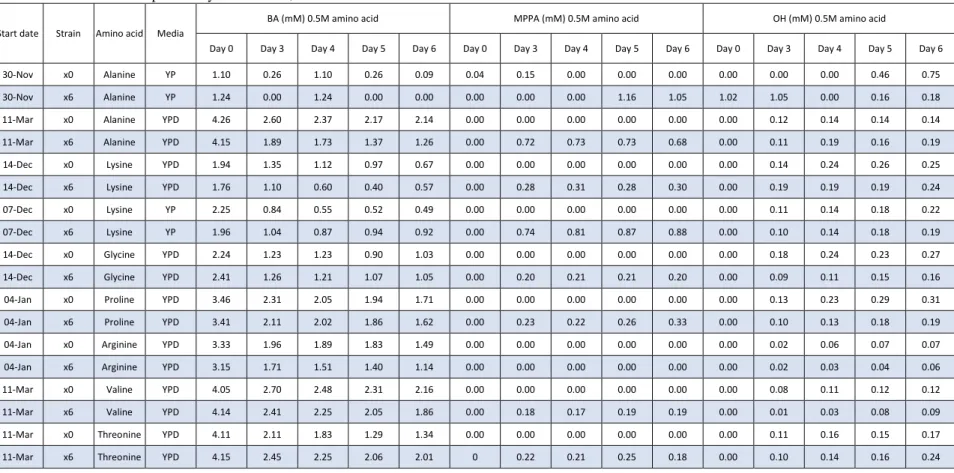
Table 10: Continuation of previously table with 0,5M concentration of each amino acid. Note that all concentrations were not used for all amino acids.
Start date Strain Amino acid Media
BA (mM) 0.5M amino acid MPPA (mM) 0.5M amino acid OH (mM) 0.5M amino acid
Day 0 Day 3 Day 4 Day 5 Day 6 Day 0 Day 3 Day 4 Day 5 Day 6 Day 0 Day 3 Day 4 Day 5 Day 6 30-Nov x0 Alanine YP 1.10 0.26 1.10 0.26 0.09 0.04 0.15 0.00 0.00 0.00 0.00 0.00 0.00 0.46 0.75 30-Nov x6 Alanine YP 1.24 0.00 1.24 0.00 0.00 0.00 0.00 0.00 1.16 1.05 1.02 1.05 0.00 0.16 0.18 11-Mar x0 Alanine YPD 4.26 2.60 2.37 2.17 2.14 0.00 0.00 0.00 0.00 0.00 0.00 0.12 0.14 0.14 0.14 11-Mar x6 Alanine YPD 4.15 1.89 1.73 1.37 1.26 0.00 0.72 0.73 0.73 0.68 0.00 0.11 0.19 0.16 0.19 14-Dec x0 Lysine YPD 1.94 1.35 1.12 0.97 0.67 0.00 0.00 0.00 0.00 0.00 0.00 0.14 0.24 0.26 0.25 14-Dec x6 Lysine YPD 1.76 1.10 0.60 0.40 0.57 0.00 0.28 0.31 0.28 0.30 0.00 0.19 0.19 0.19 0.24 07-Dec x0 Lysine YP 2.25 0.84 0.55 0.52 0.49 0.00 0.00 0.00 0.00 0.00 0.00 0.11 0.14 0.18 0.22 07-Dec x6 Lysine YP 1.96 1.04 0.87 0.94 0.92 0.00 0.74 0.81 0.87 0.88 0.00 0.10 0.14 0.18 0.19 14-Dec x0 Glycine YPD 2.24 1.23 1.23 0.90 1.03 0.00 0.00 0.00 0.00 0.00 0.00 0.18 0.24 0.23 0.27 14-Dec x6 Glycine YPD 2.41 1.26 1.21 1.07 1.05 0.00 0.20 0.21 0.21 0.20 0.00 0.09 0.11 0.15 0.16 04-Jan x0 Proline YPD 3.46 2.31 2.05 1.94 1.71 0.00 0.00 0.00 0.00 0.00 0.00 0.13 0.23 0.29 0.31 04-Jan x6 Proline YPD 3.41 2.11 2.02 1.86 1.62 0.00 0.23 0.22 0.26 0.33 0.00 0.10 0.13 0.18 0.19 04-Jan x0 Arginine YPD 3.33 1.96 1.89 1.83 1.49 0.00 0.00 0.00 0.00 0.00 0.00 0.02 0.06 0.07 0.07 04-Jan x6 Arginine YPD 3.15 1.71 1.51 1.40 1.14 0.00 0.00 0.00 0.00 0.00 0.00 0.02 0.03 0.04 0.06 11-Mar x0 Valine YPD 4.05 2.70 2.48 2.31 2.16 0.00 0.00 0.00 0.00 0.00 0.00 0.08 0.11 0.12 0.12 11-Mar x6 Valine YPD 4.14 2.41 2.25 2.05 1.86 0.00 0.18 0.17 0.19 0.19 0.00 0.01 0.03 0.08 0.09 11-Mar x0 Threonine YPD 4.11 2.11 1.83 1.29 1.34 0.00 0.00 0.00 0.00 0.00 0.00 0.11 0.16 0.15 0.17 11-Mar x6 Threonine YPD 4.15 2.45 2.25 2.06 2.01 0 0.22 0.21 0.25 0.18 0.00 0.10 0.14 0.16 0.24
19
ATTACHMENT 3
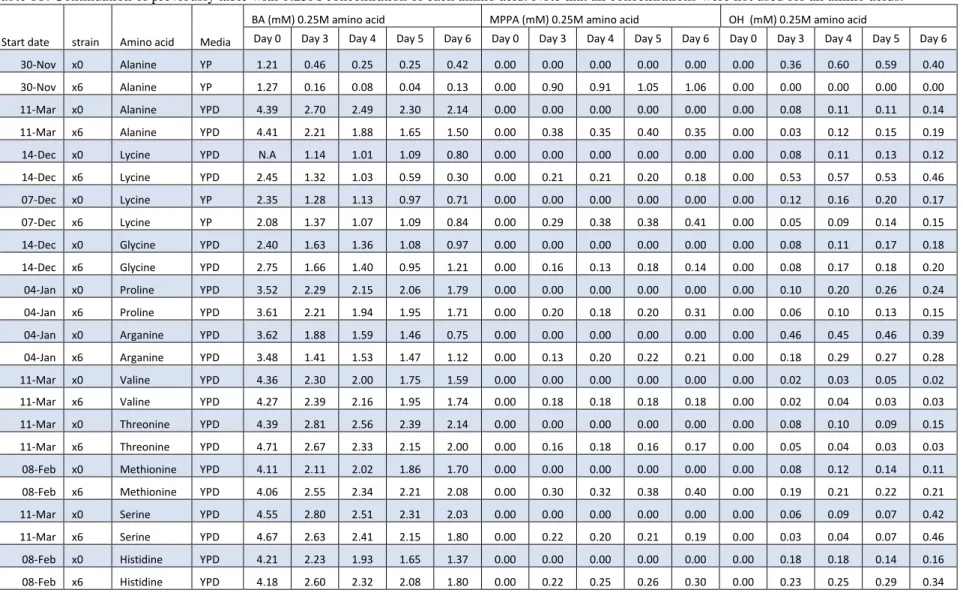
Table 11: Continuation of previously table with 0.25M concentration of each amino acid. Note that all concentrations were not used for all amino acids.
Start date strain Amino acid Media
BA (mM) 0.25M amino acid MPPA (mM) 0.25M amino acid OH (mM) 0.25M amino acid
Day 0 Day 3 Day 4 Day 5 Day 6 Day 0 Day 3 Day 4 Day 5 Day 6 Day 0 Day 3 Day 4 Day 5 Day 6 30-Nov x0 Alanine YP 1.21 0.46 0.25 0.25 0.42 0.00 0.00 0.00 0.00 0.00 0.00 0.36 0.60 0.59 0.40 30-Nov x6 Alanine YP 1.27 0.16 0.08 0.04 0.13 0.00 0.90 0.91 1.05 1.06 0.00 0.00 0.00 0.00 0.00 11-Mar x0 Alanine YPD 4.39 2.70 2.49 2.30 2.14 0.00 0.00 0.00 0.00 0.00 0.00 0.08 0.11 0.11 0.14 11-Mar x6 Alanine YPD 4.41 2.21 1.88 1.65 1.50 0.00 0.38 0.35 0.40 0.35 0.00 0.03 0.12 0.15 0.19 14-Dec x0 Lycine YPD N.A 1.14 1.01 1.09 0.80 0.00 0.00 0.00 0.00 0.00 0.00 0.08 0.11 0.13 0.12 14-Dec x6 Lycine YPD 2.45 1.32 1.03 0.59 0.30 0.00 0.21 0.21 0.20 0.18 0.00 0.53 0.57 0.53 0.46 07-Dec x0 Lycine YP 2.35 1.28 1.13 0.97 0.71 0.00 0.00 0.00 0.00 0.00 0.00 0.12 0.16 0.20 0.17 07-Dec x6 Lycine YP 2.08 1.37 1.07 1.09 0.84 0.00 0.29 0.38 0.38 0.41 0.00 0.05 0.09 0.14 0.15 14-Dec x0 Glycine YPD 2.40 1.63 1.36 1.08 0.97 0.00 0.00 0.00 0.00 0.00 0.00 0.08 0.11 0.17 0.18 14-Dec x6 Glycine YPD 2.75 1.66 1.40 0.95 1.21 0.00 0.16 0.13 0.18 0.14 0.00 0.08 0.17 0.18 0.20 04-Jan x0 Proline YPD 3.52 2.29 2.15 2.06 1.79 0.00 0.00 0.00 0.00 0.00 0.00 0.10 0.20 0.26 0.24 04-Jan x6 Proline YPD 3.61 2.21 1.94 1.95 1.71 0.00 0.20 0.18 0.20 0.31 0.00 0.06 0.10 0.13 0.15 04-Jan x0 Arganine YPD 3.62 1.88 1.59 1.46 0.75 0.00 0.00 0.00 0.00 0.00 0.00 0.46 0.45 0.46 0.39 04-Jan x6 Arganine YPD 3.48 1.41 1.53 1.47 1.12 0.00 0.13 0.20 0.22 0.21 0.00 0.18 0.29 0.27 0.28 11-Mar x0 Valine YPD 4.36 2.30 2.00 1.75 1.59 0.00 0.00 0.00 0.00 0.00 0.00 0.02 0.03 0.05 0.02 11-Mar x6 Valine YPD 4.27 2.39 2.16 1.95 1.74 0.00 0.18 0.18 0.18 0.18 0.00 0.02 0.04 0.03 0.03 11-Mar x0 Threonine YPD 4.39 2.81 2.56 2.39 2.14 0.00 0.00 0.00 0.00 0.00 0.00 0.08 0.10 0.09 0.15 11-Mar x6 Threonine YPD 4.71 2.67 2.33 2.15 2.00 0.00 0.16 0.18 0.16 0.17 0.00 0.05 0.04 0.03 0.03 08-Feb x0 Methionine YPD 4.11 2.11 2.02 1.86 1.70 0.00 0.00 0.00 0.00 0.00 0.00 0.08 0.12 0.14 0.11 08-Feb x6 Methionine YPD 4.06 2.55 2.34 2.21 2.08 0.00 0.30 0.32 0.38 0.40 0.00 0.19 0.21 0.22 0.21 11-Mar x0 Serine YPD 4.55 2.80 2.51 2.31 2.03 0.00 0.00 0.00 0.00 0.00 0.00 0.06 0.09 0.07 0.42 11-Mar x6 Serine YPD 4.67 2.63 2.41 2.15 1.80 0.00 0.22 0.20 0.21 0.19 0.00 0.03 0.04 0.07 0.46 08-Feb x0 Histidine YPD 4.21 2.23 1.93 1.65 1.37 0.00 0.00 0.00 0.00 0.00 0.00 0.18 0.18 0.14 0.16 08-Feb x6 Histidine YPD 4.18 2.60 2.32 2.08 1.80 0.00 0.22 0.25 0.26 0.30 0.00 0.23 0.25 0.29 0.34
20
ATTACHMENT 4
Table 12: Results for the three-day trials with alanine in YP and YPD media.
Table 13: Viability results for alanine trial over three days.
Start date Strain Amino acid Media
Day3 (%)
Flow cytometry live cells/µl
Day 0 Day 1 Day 2 Day3 22-Jan x0 Alanine YP 54% 235680 78624 79808 78272 22-Jan x6 Alanine YP 48% 232304 102128 84384 69952 07-Mar x0 Alanine YPD 29% 152224 115136 76128 44080 07-Mar x6 Alanine YPD 35% 148976 121392 77808 51888
Table 14: Results for the fermentation when 0.25M concentration of alanine was used. Percentage from the viability are displayed in table 6. The BA
concentration measured before adding the cells are displays together with the analysis result from day 0-4 and day 7.
Start date Strain
Amino acid Media
Flow cytometry live cells/µl BA (mM) before adding
cells
BA (mM) 0.25M amino acid MPPA (mM) 0.25M amino acid OH (mM) 0.25M amino acid
Day 0 Day 1 Day 2 Day 3 Day 4 Day 7 Day 0 Day 1 Day 2 Day 3 Day 4 Day 7 Day 0 Day 1 Day 2 Day 3 Day 4 Day 7 Day 0 Day 1 Day 2 Day 3 Day 4 Day 7 18-Mar x0 Alanine YP 202816 176576 172704 200416 58352 102672 5.96 4.45 3.82 3.77 3.25 3.15 2.71 0.00 0.00 0.00 0.00 0.00 0.00 0.00 0.00 0.09 0.14 0.19 0.25 18-Mar x6 Alanine YP 194368 203776 225488 199008 112624 169904 5.87 4.31 3.38 3.06 2.54 2.25 2.01 0.00 0.35 0.83 0.98 1.06 1.24 0.00 0.00 0.03 0.10 0.12 0.23 Start date Strai n Amino acid Medi a BA (mM) 1.0M amino acid MPPA (mM) ) 1.0M amino acid OH (mM) ) 1.0M amino acid BA (mM) 0.5M amino acid MPPA (mM) 0.5M amino acid OH (mM) 0.5M amino acid
Day 0 Day 1 Day 2 Day 3 Day 0 Day 1 Day 2 Day 3 Day 0 Day 1 Day 2 Day 3 Day 0 Day 1 Day 2 Day 3 Day 0 Day 1 Day 2 Day 3 Day 0 Day 1 Day 2 Day 3 22-Jan x0 Alanine YP 4.09 3.27 2.63 2.20 0.00 0.00 0.00 0.00 0.00 0.10 0.22 0.39 4.33 3.50 2.86 2.45 0.00 0.00 0.00 0.00 0.00 0.06 0.16 0.19 22-Jan x6 Alanine YP 4.14 2.24 1.57 1.07 0.00 1.10 1.37 1.74 0.00 0.06 0.11 0.16 4.35 2.78 2.03 1.64 0.00 0.80 1.10 1.24 0.00 0.04 0.12 0.21 07-Mar x0 Alanine YPD 3.13 2.27 1.86 1.60 0.00 0.00 0.00 0.00 0.00 0.11 0.17 0.23