Comparing NR Expression among Metabolic Syndrome Risk Factors
(HS-IDA-MD-03-205) Annelie Jacobsson (e99annja@student.his.se)
Department of Computer Science University of Skövde, Box 408
S-54128 Skövde, SWEDEN
Master’s dissertation, spring 2003 Study program in Bioinformatics Supervisor: Kim Laurio
Comparing NR Expression among Metabolic Syndrome Risk Factors
Submitted by Annelie Jacobsson to University of Skövde as a dissertation for the degree of M.Sc., in the Department of Computer Science.
[03-06-13]
I certify that all material in this dissertation which is not my own work has been identified and that no material is included for which a degree has previously been conferred on me.
Comparing NR Expression among Metabolic Syndrome Risk Factors Annelie Jacobsson (e99annja@student.his.se)
Abstract
The metabolic syndrome is a cluster of metabolic risk factors such as diabetes type II, dyslipidemia, hypertension, obesity, microalbuminurea and insulin resistance, which in the recent years has increased greatly in many parts of the world. In this thesis decision trees were applied to the BioExpress™ database, including both clinical data about donors and gene expression data, to investigate nuclear receptors ability to serve as markers for the metabolic syndrome. Decision trees were created and the classification performance for each individual risk factor were then analysed. The rules generated from the risk factor trees were compared in order to search for similarities and dissimilarities. The comparisons of rules were performed in pairs of risk factors, in groups of three and on all risk factors and they resulted in the discovery of a set of genes where the most interesting were the Peroxisome Proliferator – Activated Receptor - Alpha, the Peroxisome Proliferator – Activated Receptor - Gamma and the Glucocorticoid Receptor. These genes existed in pathways associated with the metabolic syndrome and in the recent scientific literature.
Keywords: Metabolic Syndrome, Nuclear Receptors, Data Mining, Decision trees,
Acknowledgements
I would like to thank my supervisor Kim Laurio at University of Skövde for providing me with motivation, regular suggestions and timely feedback, which have greatly improved this thesis. I would also like to thank my supervisor at AstraZeneca, Magnus L. Andersson for giving inspiring support and encouragement during the whole project. I must also thank Marcus Bjäreland at AstraZeneca for the original idea of this project and for giving advice and assistance especially on the data mining part of the project. I am also thankful for valuable feedback from Björn Olsson who has been my examiner during this thesis. Finally I would also like to thank my boyfriend Johan, my parents and my dear friends for giving me much support and encouragement throughout this time, without them this work would not have been possible.
Table of Contents
1 Introduction ... 1
2 Background ... 4
2.1 Metabolic Syndrome ...4 2.1.1 Insulin resistance ...5 2.1.2 Obesity ...6 2.1.3 Dyslipidemia ...6 2.1.4 Hypertension ...7 2.1.5 Microalbuminurea ...72.1.6 Type II Diabetes mellitus...7
2.2 Nuclear Receptors...8
2.3 Data mining...9
2.3.1 Decision trees ...9
2.4 Related work ...12
3 Presentation of the problem ... 14
3.1 Project foundation ...14
3.2 Definition of the problem...14
3.3 Hypotheses...15
3.4 Objectives ...15
4 Method... 18
4.1 Overview of the process ...18
4.2 Specify criteria for the included risk factors...20
4.3 Data extraction...24
4.3.1. Donor groups...24
4.3.2 Missing values...24
4.4 Analysis of lifestyle factors with the GeneLogic GUI ...26
4.5 Selection of tissues...27
4.6 Filtering of the Nuclear Receptor data...27
4.7 Extraction of the gene expression data...28
4.8 Selection of a data analysis technique ...28
4.9.1 Weka-3-2...29
4.9.2 Quality measurements ...31
4.9.3 Data...32
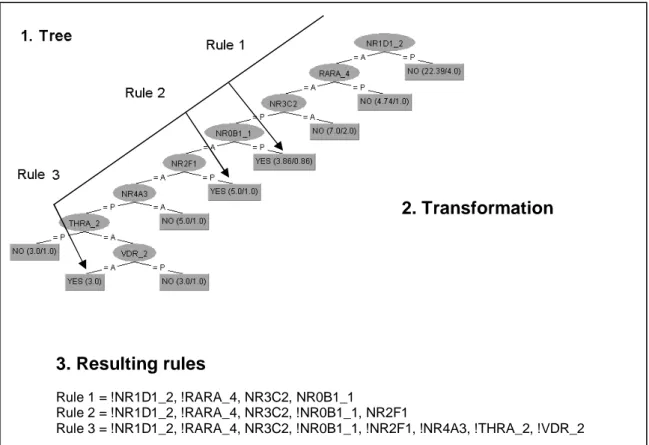
4.10 Transformation - from trees to rules...32
4.11 Comparison of rules ...34
4.11.1 Comparison with three different approaches ...34
4.11.2 Pathways ...37
4.12 Data analysis on all risk factors...39
5 Results... 41
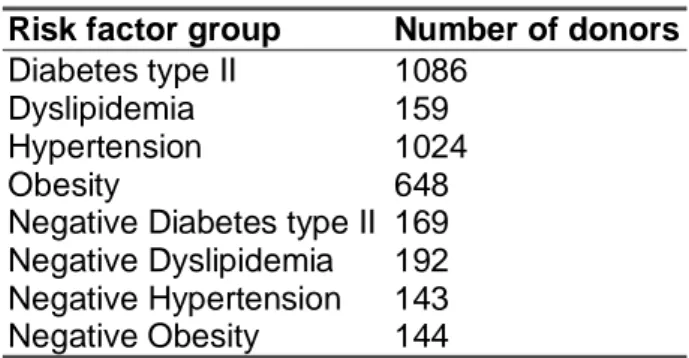
5.1 Donor data...41
5.2 Creating the Risk factor groups ...42
5.2.1 Lifestyle analysis with the GeneLogic GUI...43
5.2.3 Selection of interesting tissues ...44
5.2.4 Investigation of the distribution of gender in the data sets ...45
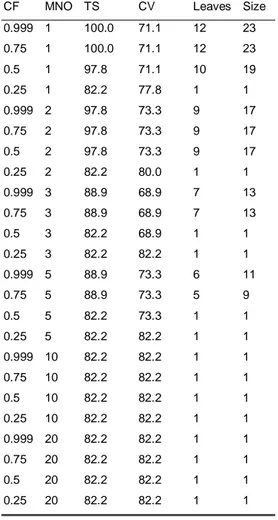
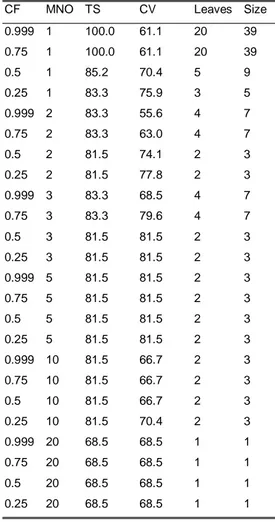
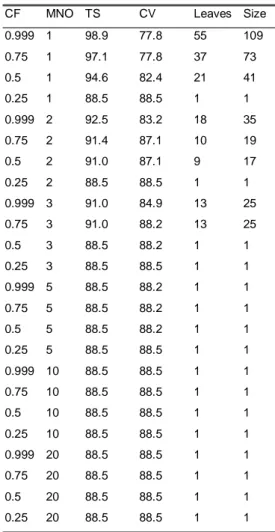
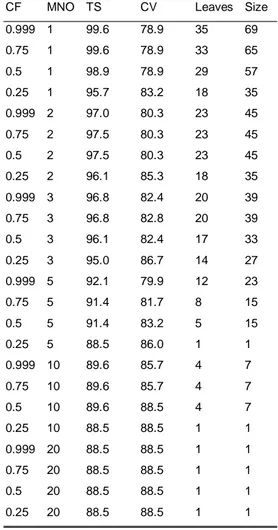
5.3 Results from the data analysis with Weka-3-2...46
5.4 The generation of rules from the trees ...69
5.5 Results from the combinations ...69
5.5.1 First approach – searching for overlapping rules ...69
5.5.2 Second approach – searching for rules with overlapping genes ...69
5.5.3 Third approach – combining rules from different risk factors...70
5.5.4 Pathways ...77
5.6 Results from data analysis on all risk factors except for diabetes...77
5.6.1 Investigation of the distribution of gender in the data sets ...77
5.6.2 Results from the data analysis with Weka-3-2...78
6. Discussion and analysis... 84
6.1 Data analysis with Weka-3-2 ...84
6.2 Effects of data quality issues...86
6.2.1 Errors in data ...86
6.2.2 Incomplete data ...87
6.2.3 Problems related to microarray techniques...88
6.5 Genes resulting from the comparison ...91
6.6 Selection of probe sets ...94
7 Conclusions... 95
7.1 Future work ...97
References ... 98
Appendix A. The Nuclear Receptor database – NRs ... 101
Appendix B. The Nuclear Receptor database – Co-factors ... 103
Appendix C. The distribution of samples in different tissues... 111
Appendix D. Donors with missing values ... 126
Appendix E. Donors with missing values... 128
Appendix F. Donors with missing values... 129
Appendix G. Decision tree rules... 130
1 Introduction
Undernutrition and starvation have in the past been profound causes of disease and mortality in several countries of the now industrialised world (Björntorp, 1997). Diseases like tuberculosis, which result from undernutrition, were severe problems in the lesser-developed countries even until the 1930s. In contrast to this we are now facing the opposite problem - that of energy excess - in many parts of the world, especially in the industrialised parts. Recent reports on obesity, insulin resistance and other similar affections are indeed very alarming (Björntorp, 1997; Reaven, 2002; Grundy, Abate & Chandalia, 2002; Petersen & Schulman, 2002). Furthermore, there is strong evidence that this epidemic continues to increase at a considerable rate (Grundy et al., 2002) and it seems unlikely that the population will change their habits considerably. The consequences of obesity are well known and they include insulin resistance and elevation of blood pressure, with accompanying complications such as diabetes mellitus type II, dyslipidemia and cardiovascular disease (Grundy et al., 2002; Reaven, 2002).
Furthermore, the clustering of metabolic risk factors like insulin resistance, obesity, dyslipidemia, hypertension, microalbuminurea and diabetes mellitus type II can lead to even more serious complications (Hansen, 1999). This clustering has been named the Metabolic Syndrome, Syndrome X and the Insulin Resistance Syndrome. According to Meigs (2000), the metabolic syndrome can be defined as the co-occurrence of multiple metabolic and physiological risk factors such as overall and central obesity, dyslipidemia, diabetes mellitus type II, hypertension, microalbuminurea and insulin resistance, which together make a contribution to the development of cardiovascular disease. The metabolic syndrome is a worldwide epidemic, which is likely to increase greatly in the coming years (Grundy et al., 2002). Because of this it is necessary to create an awareness of this problem so that the importance of a healthy diet, regular exercise and the negative effects of smoking becomes clear for the patients suffering from metabolic syndrome (Grundy et al., 2002). However, in some cases it will also be necessary to develop possible drug treatments so that quick changes can be made, with the purpose of curing patients with severe effect of the epidemic. Because of the fact of how widespread and common the metabolic syndrome is, it can be seen as a major burden for national health economies, and the future does not seem to be any brighter (Björntorp, 1997).
Drug target discovery has traditionally started with the implication of a biochemical pathway in a pathophysiological process (Debouck & Goodfellow, 1999). The first step usually involved a survey of the enzymatic activity in the pathway and some particular enzyme was characterised and purified. Occasionally, sufficient information was known about the enzyme’s structure and the mechanisms of action in the pathway, to be able to identify classes of small molecules to be targeted. Finally, medicinal chemists tried to optimise the compounds and to remove undesired properties of the enzymes. A similar process was applied to identify receptors and their use as drug targets (Debouck & Goodfellow, 1999). Advances in molecular
provides human targets when access to human tissues is limited, which is important because even a single amino acid difference can make the drug ineffective against targets. Cross-hybridisation with cloned sequences can be used for identifying related targets. One limiting aspect has been target validation, which means the linking of targets to therapeutic capacity. This step in target discovery is difficult because it requires a detailed understanding of pathophysiological processes. The ideal technique for solving this problem would be to compare normal genes with disease genes in human on a whole genome scale. A potential approach for this could be using a gene expression profiling technique such as DNA microarrays or techniques within the area of proteomics (Debouck & Goodfellow, 1999). By investigating the expression patterns of genes, indirect information can be derived about the protein function. Gene expression analysis provides the opportunity to compare the expression of thousands of genes between ‘disease’ and ‘normal’ tissues and cells. The technique further allows the identification of multiple potential targets.
In recent years biological research has become more and more database-driven, which has its ground in experiments of large-scale functional genomics, proteomics and gene expression analysis (Bertone and Gerstein 2001). Gene expression array technologies have simplified the analysis of the expression levels of large sets of genes simultaneously (Tamames et al., 2002). By investigating the expression profiles of genes, microarray technology can provide a wide variety of information regarding the biology of the concerned organism. In exploring the genomic content of organisms, DNA microarrays have been used for e.g. protein function prediction for related genes, genotyping (Tamames et al., 2002) and to correlate the levels of gene expression with subcellular localisation (Bertone & Gerstein, 2001). As mentioned above, the advantages of gene expression analysis have also led to the technique being applied in the field of drug discovery, where it has been successfully used in drug target identification (Debouck & Goodfellow, 1999).
In addition to biological databases containing structural and sequential data, many diverse types of experimental data are also organised into databases (Bertone & Gerstein, 2001). The experimental data often has its primary focus on different aspects of protein function. It is however important that this data can be related to other similar biological data in order to put it in a useful context (Bertone & Gerstein, 2001). It has therefore become a great challenge in bioinformatics to integrate databases so that the information from different biological databases can be put together, which could indeed lead to the fact that large-scale studies can be conducted in order to analyse many different datasets.
Because of the advances in genome research and the large scale of the experiments, there has also been a change in methods of deriving knowledge of genes and proteins (Bertone and Gerstein 2001). Earlier one had to read most of the existing literature to be able to learn about the experimental knowledge about a protein or a gene, but nowadays one can use integrated database analysis and data mining to generate a preliminary set of hypotheses regarding this data. The biological databases contain a possible gold mine of valuable information, but the problem is to analyse the enormous amount of data and to extract meaningful patterns from it (Deogun, Raghavan, Sarkar & Sever, 1997). As databases become larger, it therefore becomes increasingly more difficult to support decision-making (Thuraisingham, 1998). In order to try to improve this decision-making, a technique referred to as data mining can be used. The aim of data mining within bioinformatics is to identify distinguishing
properties in a given dataset. Data mining refers to all techniques that use information to be able to extract knowledge about data (Witten & Frank, 1999).
In this present work we apply data mining techniques to the BioExpress™ database to search for a set of marker genes, which could be associated with metabolic syndrome in humans. BioExpress™ (Gene Logic Inc.) is a database that contains both clinical data and gene expression data from donors in the United States. The basic idea is to examine the possible link between the metabolic syndrome and nuclear receptors (NR) using the BioExpress™ database. Four different classifiers are used to classify each risk factor individually and the results from each classifier are then compared, with the purpose of trying to identify marker genes involved in the metabolic syndrome. The motivation for using NRs is first and foremost the suitability of NRs as drug targets but also the fact that an additional database, a nuclear receptor (NR) database, is accessible at the research and development site at AstraZeneca in Mölndal. The NR database contains information about known nuclear receptors and co-factors. The hypothesis is that by using four different classifiers – one for each individual risk factor – and then comparing the results from the classifications, it will be possible to identify biological marker genes involved in the metabolic syndrome. The results from the data analysis on the gene expression data for the four specified risk factors show that the generated classifiers did not have preferable high cross-validation. The comparisons of rules that were generated from the decision trees resulted in the discovery of a set of genes were the most interesting were the Peroxisome Proliferator – Activated Receptor – Alpha (PPARA), the Peroxisome Proliferator – Activated Receptor – Gamma (PPARG) and the Glucocorticoid Receptor (NR3C1). These genes were found in the assembly of rules that were generated during the comparison and in the Knowledge Bank, which is a collection of genes created by a literature study by Halinen and Norseng (2002). The Knowledge Bank includes genes that are known to be associated with metabolic syndrome risk factors. Furthermore, the three genes also exist in pathways that are associated with the metabolic syndrome and in the recent scientific literature where an association has been suggested between the genes and metabolic syndrome risk factors.
The remainder of this thesis is organised as follows. The second chapter includes background information about the metabolic syndrome and associated risk factors. The chapter also covers information about data mining, decision trees and related work. A fundamental review of NRs and their known functions is also made. The third chapter covers a presentation of the problem, including the problem definition, hypothesis and aims and objectives. The fourth chapter includes a detailed explanation of the steps included in the method used in this thesis. In the fifth chapter the results generated from the experiments performed in the study are presented. Finally, chapter 6 covers a discussion on the results and chapter 7 includes the conclusions drawn from the project. The chapter also covers suggestions of possible future work that we recommend.
2 Background
This chapter gives an overview of the metabolic syndrome and the included risk factors. Furthermore, the general structure and function of nuclear receptors are also described in order to explain their importance as targets for the development of new therapeutics of common metabolic diseases. Data mining is described and the included steps are explained and theory behind the machine learning technique named decision trees is also described. Finally, a review of related work that has been performed on data mining and the metabolic syndrome is included.
2.1 Metabolic Syndrome
Biological risk factors such as hypertension, obesity, dyslipidemia and hyperglycaemia are known to be closely interrelated and to be strong risk factors for both cardiovascular disease and type 2 diabetes (Wamala et al., 1999). In the presence of a combination of these risk factors an even more serious disease has been suggested. The disease has been given various names such as Syndrome X, the Insulin resistance syndrome and the metabolic syndrome (Hansen, 1999). In short one could say that metabolic syndrome is a condition where several different risk factors such as obesity, hypertension, dyslipidemia, diabetes mellitus type II, insulin resistance and microalbuminuria are believed to cooperate to increase the risk of coronary heart disease (Hansen, 1999). Further details regarding the risk factors included in the metabolic syndrome are covered in the following subchapters. Environmental risk factors such as smoking, alcohol and diet can also have an impact on metabolic syndrome patients and it has for example in previous studies been proposed that a possible link exists between cigarette smoking and the metabolic syndrome (Eliasson et al., 1996).
Unfortunately, various definitions of the metabolic syndrome exist and there is no internationally agreed upon definition. In this study a combination of the definition proposed by the World Health Organisation (WHO) and the United States’ National Cholesterol Education Programme (NCEP) Adult Treatment Panel III (NCEP, 2001) has been used. The WHO (Alberti & Zimmet, 1998) recommends the following definition of the metabolic syndrome:
glucose intolerance, impaired glucose tolerance (IGT) or diabetes mellitus and/or insulin resistance together with two or more of the other components listed below:
Impaired glucose regulation or diabetes mellitus type II Insulin resistance
Raised plasma triglycerides (1.7 mmol l-1;150 mg dl-1) and/or low HDL-cholesterol (men: <0.9 mmol l-1, 35 mg dl-1; women: <1.0 mmol l-1, 39 mg dl-1)
Central obesity (males: waist to hip ratio >0.90; females: waist to hip ratio >0.85 and/or BMI>30 kg m-2)
Microalbuminurea (urinary albumin excretion rate 20 µg min-1 or albumin:creatinine ratio 30 mg g-1)
According to ATP III (NCEP, 2001), the diagnosis of metabolic syndrome can be made when three or more of the risk parameters shown below are present:
Abdominal obesity (men: >102 cm; women: >88 cm) Raised triglycerides (150 mg dl-1)
Low HDL-cholesterol (male: <40 mg dl-1, female: <50 mg dl-1) High blood pressure (135/85 mmHg)
Raised fasting glucose (110 mg dl-1)
At AstraZeneca´s research and development site in Mölndal, efforts have been made on research on metabolic syndrome and the development of new therapeutic drugs for cardiovascular diseases in general (Halinen & Norseng, 2002). It is of great interest to find possible drug targets for the development of pharmaceuticals for the metabolic syndrome because of the fact that it is a life threatening disorder and also, the number of patients with the syndrome is likely to increase in the future.
2.1.1 Insulin resistance
Insulin resistance is the body’s inability to store glucose, especially in skeletal muscle, adipose tissue and/or liver, with the help of insulin (Hellenius et al., 1991). The definition of insulin resistance is a lower than normal response to insulin in cells, tissues or the whole body. Insulin resistance cannot be seen as a disease, but as a physiological change that increases the risk of developing one or more disorders, such as dyslipidemia and high blood pressure (Reaven, 2002). The more resistant an individual is to insulin, the more likely it is that the individual will develop one or more of the abnormalities. In contrast, the more abnormalities present the greater the risk that the patient in addition will develop insulin resistance. Recent studies have also shown that the presence of insulin resistance in an individual is a good predictor for deciding if the patient will develop type II diabetes mellitus (Petersen & Shulman, 2001). Insulin resistance is caused by a number of factors, where the most important
insulin levels and the levels of FFA. When the levels of FFA increase, an increase in insulin to the blood can inhibit the release of FFA. If hyperinsulemia cannot be retained, that is if the high levels of insulin cannot be maintained, the levels of FFA will gradually increase which in the end will lead to insulin resistance.
2.1.2 Obesity
Obesity is an increase in body weight beyond the limitation of physical and skeletal requirements, as a result from an excessive accumulation of fat in the body (Andersson, 1994). Body Mass Index (BMI) can be used to determine if an individual is overweight or obese. An overweight person can be defined as a person with a BMI between 25.0-29.9 and an obese person can be defined as a person with a BMI greater or equal to 30 (Hansen, 1999). BMI is calculated as body mass (m) in kilos divided with the square of body length (l2) in meters. Traditionally BMI has been used as a parameter for diagnosing patients with the obesity risk factor in the metabolic syndrome (Okosun et al., 2000).
Several studies have shown that distribution of fat in the body, especially in the central or abdominal areas, may be an even more important correlate of the metabolic syndrome. Consequently a waist-to-hip ratio has been proposed as a better predictor of the syndrome (Okosun et al., 2000). The waist-to-hip ratio can be used as an indicator of central adiposity and with a ratio of over 0.85 for women and 0.95 for men, the patient can be classified as having central obesity, independent of the value of BMI. Although the waist-to-hip ratio is the most widely used index for accessing abdominal obesity, the parameter has its disadvantages. The waist-to-hip ratio is an imperfect measure of abdominal fat mass, especially in non-obese individuals (Okosun et al., 2000). Insulin resistance is common in individuals with obesity, independent of diabetes, and abdominal obesity has been considered to be dangerous for decreased glucose metabolism (Hellenius et al., 1991). According to the ATP III overweight and obesity are major risk factors for coronary heart disease and weight reduction will reduce all the risk factors in the metabolic syndrome (NCEP, 2001).
2.1.3 Dyslipidemia
Recent analysis shows that elevated triglycerides are additional independent risk factors for the development of coronary heart disease (NCEP, 2001). Higher than normal levels of serum triglycerides can often be seen in persons with the metabolic syndrome diagnosis, although the rise in triglycerides can also depend on genetic factors. Additional factors which contribute to elevated triglycerides are obesity and overweight, physical inactivity, cigarette smoking, excess alcohol intake, high carbohydrate diets, several diseases and certain drugs (NCEP, 2001).
Low high-density lipoprotein cholesterol (low HDL-C) is one additional strong independent risk factor of coronary heart disease (NCEP, 2001). The causes of this abnormality are many, including elevated triglycerides, overweight and obesity, physical inactivity and type II diabetes mellitus.
Features of the metabolic syndrome risk factor dyslipidemia include high triglycerides (hypertriglyceridemia) and low HDL cholesterol values (Hansen, 1999). Hypertriglyceridemia can be defined as fasting triglyceride levels of over 200 mg/dl. Low HDL-C is defined as less than 40 mg/dl for men and less than 50 mg/dl for women (NCEP, 2001). Earlier research has shown that there is a link between the components of dyslipidemia - elevated triglycerides, increased small LDL and decreased HDL cholesterol - and insulin resistance (Hansen, 1999).
2.1.4 Hypertension
High blood pressure or hypertension as it is also named, can be defined as a systolic blood pressure of higher than or equal to 140 mmHg and a diastolic blood pressure of higher than or equal to 90 mmHg (Hansen, 1999). Hypertension promotes atherosclerosis and increases the risk of coronary heart disease and stroke (Campbell, Reece & Mitchell, 1999). Atherosclerosis tends to reduce the diameter of the blood vessels and the elasticity, thereby increasing the blood pressure. Hypertension can be inherited but other factors can also be associated with hypertension, including smoking, reduced physical activity and a high carbohydrate diet. Recent research has further associated hypertension with metabolic abnormalities such as insulin resistance, central obesity and dyslipidemia.
2.1.5 Microalbuminurea
In the last decade, microalbuminurea has been recognised as an individual risk factor of cardiovascular disease (Yip & Trevisan, 1999). It has been associated with all the factors in the metabolic syndrome, including hypertension, raised plasma triglycerides and reduced HDL-cholesterol. Microalbuminurea can be defined as an increase of albumin in the urea (Andersson, 1994). The problem with microalbuminurea is that it is rather difficult to measure with conventional methods. Microalbuminurea is present in about 5-10 percent of the non-diabetic population and the risk of being affected increases with age (Yip & Trevisan, 1999). In patients with hypertension or diabetes, insulin resistance can often be found even in the absence of microalbuminurea, but the opposite is rare. Because of this fact, patients with microalbuminurea should be aware of the possibility of having an increased risk of the metabolic syndrome and the risk factors involved in this syndrome.
2.1.6 Type II Diabetes mellitus
Type II diabetes mellitus can be characterised as elevated glucose levels in the blood and it is either due to a deficiency of insulin or to a reduced responsiveness in target cells because of some change in insulin receptors, or both (Campbell, Reece & Mitchell, 1999). Type II diabetes is a common metabolic disorder and it becomes
Obesity and insulin resistance are common in the early stages of type II diabetes mellitus. The fact is that the majority of patients with diabetes type II are obese and the obesity causes or increases the risk for insulin resistance (Alberti & Zimmet, 1998). WHO has proposed a definition of type 2 diabetes mellitus as a fasting plasma glucose level of 7.0 mmol/l or above or a blood concentration 2 hours after an oral glucose tolerance test of 10.0 mmol/l or above (Alberti & Zimmet, 1998)
2.2 Nuclear Receptors
It has recently been proposed that the dysregulation of nuclear receptors may contribute to the metabolic syndrome (Francis et al., 2002). The fact that nuclear receptors seem to be dysregulated in many common diseases make them good targets for the development of new drugs for the treatment of common metabolic diseases.
The nuclear receptor family includes 49 distinct members in human and is one of the largest groups of transcription factors (Francis et al., 2002). The molecular structure of the nuclear receptors is composed of 5-6 regions that have modular character (Laudet & Gronemeyer, 2002; Chawla et al., 2001). They are characterised by a ligand-independent AF-1 transactivation domain in the NH2-terminal region and
a DNA binding domain, which is composed of two zinc fingers that target the receptor to specific DNA sequences known as hormone responsive elements. Furthermore, they consist of a ligand-binding domain and a AF-2 domain in the COOH-terminal region (see figure 1). In the presence of ligand binding, nuclear receptors undergo a conformational change that dissociates corepressors and enables the recruitment of coactivator proteins to facilitate transcriptional activation (Chawla et al., 2001).
Figure 1. A schematic structure of a typical nuclear receptor.
The major role of nuclear receptors is regulation of genes involved in metabolic control and the binding of small, lipophilic ligands that include hormones and metabolites controls the activity of the receptors. Examples of such ligands are steroid hormones like estrogens and progestines and metabolic ligands such as fatty acids and bile acids (Laudet & Gronemeyer, 2002).
Because of their role in regulation, nuclear receptors have received much interest in the area of finding new therapeutic drugs for common metabolic diseases like diabetes and obesity. Nuclear receptors often form complexes with corepressors and these complexes are responsible for the variability of gene responses to different ligands and metabolic environments (Francis et al., 2002). Since the recognition of nuclear receptors’ involvement in the metabolic syndrome, the interest has increased in trying to find out more details regarding this connection (Francis et al., 2002).
Further research has to be performed to be able to establish the truth about the associations and which receptors that are actually involved in the metabolic syndrome.
2.3 Data mining
Data mining is defined as the process of discovering patterns in data (Witten & Frank, 1999). The data set used in data mining is often made up of large quantities of data and it is possibly stored in databases (Thuraisingham, 1998). The amount of biological data in databases has greatly increased, and the data is still increasing all the time. A problem with this increase is that there is a growing gap between the amount of data and our understanding of the data (Witten & Frank, 1999). Data mining is about taking advantage of the potentially useful information, which is hidden in this data. The information is often extracted from large quantities of data, which are possibly stored in databases. For many organisations, the common goals of data mining are to detect abnormal patterns or to predict the future from past experiences and trends (Thuraisingham, 1998). A general problem in bioinformatics is to structure the information into meaningful categories, which is of great importance when trying to establish relationships between different biological data sets (Bertone & Gerstein, 2001).
There are several different steps involved in data mining. In the first step the aim is to organise the data so that it is prepared for mining (Thuraisingham, 1998). Additional steps include determining the desired outcomes to mining, performing the data mining, pruning the results so that only the useful results are taken into further account. Finally, the two last steps involve choosing actions, which should be taken with regard to the mining and to evaluate the actions and determine the benefits from them.
There are various approaches for performing data mining in biological databases and within data mining, a well-known domain exists that includes techniques in machine learning. Machine learning can be used to interpret gene information and it can be used both to split up the data in different categories and to classify earlier unknown examples in an efficient way (Bertone & Gerstein, 2001).
2.3.1 Decision trees
Decision tree learning is an example of a technique in machine learning. It has the ability to both describe available data and to predict the classification of new data (Mitchell, 1997). Decision tree techniques are examples of a form of machine learning called supervised learning (Bertone & Gerstein, 2001). In supervised learning, a priori information is required about the data being classified, in opposite to unsupervised learning where no earlier knowledge is needed. Supervised learning generally includes dividing the data set into two categories: predictors, which involve features in the data set that are relevant for learning, and the response variable, which is the property to be classified (Bertone & Gerstein, 2001). Supervised learning is conducted in two phases:
from the beginning, and the instances in the second set are then used to classify according to the partitioning made in the training phase (Bertone & Gerstein, 2001).
A decision tree can be thought of as a tree with labelled nodes (Elomaa, 1996). Decision trees classify instances by sorting them down the tree from the root to some leaf node. A decision tree takes an object as input and outputs a decision, where each decision corresponds to one class. Each internal node in the tree corresponds to a test of the value of one of the properties and the branches from the node are labelled with the possible values of the test. One example of a test could be to investigate if a gene is Present or Absent. If the gene for example is Present, this will correspond to one specific class being assigned and if the gene instead is Absent this will correspond to another class being assigned. This example is however simplified because a decision tree is often constructed by several internal nodes and the tests will in this case lead to another test until a specific leaf node will be reached and the class will be assigned. Each leaf node in the tree corresponds to a value to be returned if that leaf is reached (see figure 2).
The reason why decision trees are successful representations is the fact that the results are easy to interpret in comparison to other learning schemes like neural networks etc. (Elomaa, 1996). The learning process is also fast. The technique is primarily used for classifying which specific category a given case belongs to (Mitchell, 1997).
Figure 2. A simplified model of a decision tree. Each node that is not a leaf is connected to a test that splits its set of possible answers into subsets corresponding to different test results. Each branch carries a particular test result’s subset to another node. Each leaf node is connected to an
assignment of a specified class.
ASSIGNMENT OF CLASSES ROOT NODE
INTERNAL
NODE INTERNAL NODE
Test of a value Test of a value
LEAF
Most algorithms that have been constructed for decision trees are based on variations of a core algorithm that uses a top-down, greedy search through the space of possible decision trees (Mitchell, 1997). The basic decision tree algorithm, ID3 (Quinlan, 1993), can be used as an example to show how decision tree induction is performed. The basic strategy is described below and it is constructed by six steps (Han & Kamber, 2001):
1. A single node that represents the training samples will in the first step be created.
2. If all of the samples are of the same class, then the node will become a leaf, which is then labelled with that class.
3. If this is not true, the algorithm will use an entropy-based measure known as information gain in order to select the attribute that will best separate the samples into individual classes. This specific attribute will become a “test” attribute at that node.
4. A branch is created for each known value of the test attribute and the samples are partitioned correspondingly.
5. The same process is used recursively in order to form a decision tree for the samples in each partition. An attribute that has appeared in one node does not need to be considered anywhere lower in the tree.
6. The partitioning stops only when any of the following conditions are true: All of the samples for a specific node belong to the same class.
There are no remaining attributes on which the samples can be further partitioned. In this case, the given node is converted into a leaf and the leaf is then labelled with the class that the majority of the samples belong to.
There are no samples for the branch. In this case, a leaf is created that is labelled with the most common class among the samples.
The information gain measure is used to select the best attribute at each node in the growing tree (Han & Chamber, 2001; Mitchell, 1997). The attribute with the highest information gain, i.e. greatest entropy reduction, is chosen as the test attribute for the specific node. The attribute with the highest information gain minimizes the information needed to classify the samples in the resulting partitions. This information gain approach reduces the number of tests that are needed to classify an object and guarantees that a simple tree is found.
When a decision tree has been constructed, many of the branches will reflect inconsistency in the training data due to noise or outliers (Han & Chamber, 2001). The decision tree model has taken too much of the training data into account so that noise has been included in the model as if it was meaningful. Pruning of decision trees can be used to overcome this problem, which is also known as overfitting. The aim with tree pruning is to remove the least reliable branches, which often result in a faster classification and an improved value of correctly classified test data.
2.4 Related work
A study by Rahpeymai (2002) involved using the C4.5 decision tree approach to perform data mining on the Gene Logic database. The decision tree approach was used to try to identify the most relevant genes and risk factors involved in breast cancer, in order to try to separate healthy patients from breast cancer patients in the given data set (Rahpeymai, 2002; Rahpeymai, Olsson & Andersson, 2003). For this purpose four different tests were conducted and for each test a cross validation was performed. In the first test the expression patterns of a set of breast cancer related genes were used as input to the algorithm. The resulting decision tree contained only four genes considered to be the most relevant in order to correctly classify patients. The accuracy in the cross-validation was 89 %. In the second test the risk factors were used as input to the algorithm. The cross validation showed 87% accuracy in classifying the samples. In the third test where both gene expression data and risk factors were used as input, the accuracy of the cross validation was also 87%. In the final test, the algorithm was used to indicate possible signalling pathways involving the four genes identified in the first test. The study demonstrated an application of decision trees for the identification of genes and risk factors relevant for the classification of breast cancer patients.
In a study performed by Halinen and Norseng (2002) the authors investigated the possible relationship between metabolic syndrome and a set of genes using a gene expression database called BioExpress™. The database contains the gene expression profiles for over 7000 diseased and normal human tissue samples. In the first phase of the study, background information about metabolic syndrome and G-Protein coupled receptors (GPCRs) was collected. To be able to classify metabolic syndrome and non-metabolic syndrome patient groups from the BioExpress™ database, the clinical background of metabolic syndrome risk factors was investigated by conducting a literature review. The hypothesis, which was formulated in the project, was that by analysing GPCR expression profiles it would be possible to distinguish tissue samples taken from metabolic syndrome patients from those of non-metabolic syndrome patients. By conducting a literature search and with the help of an expert review panel, the researchers found a total of 21 GPCRs. One critical step in the project was to be able to determine what information was necessary to extract metabolic syndrome patients and non-metabolic syndrome patients and GPCR information from the BioExpress™ database. The solution was to use a diagnostic test for evaluating patients for obesity, hypertension and dyslipidemia according to the WHO and ATPIII metabolic syndrome definitions.
In the next phase, expression data for GPCRs that were differentially expressed in metabolic syndrome and non-metabolic syndrome tissue was analysed. The analysis included both a visualisation of tissue group dissimilarities and an application of the C4.5 decision tree algorithm (Halinen & Norseng, 2002). The results suggest that the expression profile of parathyroid hormone receptor (PTHR1) differs between normal lung tissue samples from metabolic syndrome and non-metabolic syndrome patients taken from the BioExpress™ database. The results also indicate that GPCR expression profiles could not be used to distinguish between cervix and myometrium tissue samples from the same patients group. Furthermore, Halinen and Norseng could not
find any scientific literature reports stating a direct relationship between GPCR gene expression and metabolic syndrome.
Dubitzky et al. (2002) investigated and compared two representatives of two classical machine learning approaches: decision trees and artificial neural networks. The algorithms that were used in the study were the decision tree algorithm C5.0 and the backpropagation algorithm for neural networks. The data set consisted of gene expression data from leukemia patients and the aim of the analysis was to investigate the relative classification performance of the decision tree algorithm C5.0 and the backpropagation artificial neural network and to investigate the methods capability to identify the most relevant genes. The results from the study showed that the best-performing decision tree approach outperformed the best-best-performing neural network model. The results also showed that the C5.0 decision tree classification model had higher sensitivity and precision. Furthermore, the output provided by the decision tree algorithm is easy to interpret and they are faster to train compared to the neural network model. Through a sensitivity analysis the neural network however was more precise with regard to obtain a ranked list of genes that were interesting, even though this analysis carries a very high computational cost. The conclusion of the study was that the decision tree approach yields more accurate results than the neural network model in terms of classification performance.
3 Presentation of the problem
This chapter includes an explanation of the foundation for this project and a definition of the problem. The aim of the project is discussed and the hypotheses are shown. Finally, the objectives are described and motivated.
3.1 Project foundation
This project is based upon the previous work of Halinen and Norseng (2002) and it concerns a slightly different approach where, instead of using GPCR data as the foundation for the search of drug targets, this project examines the possibility of nuclear receptors as possible targets. The results from the study made by Halinen and Norseng (2002) pointed to the fact that GPCR expression profiles possibly are not useful in distinguishing metabolic syndrome patients from non-metabolic syndrome patients. Their study hinted that GPCR expression did not vary considerably between metabolic syndrome patients and non-metabolic syndrome patients or between different tissues. In this study nuclear receptors and their corresponding co-factors will therefore be used in order to investigate if the NR genes and co-factors could work as possible markers for the metabolic syndrome and the included risk factors.
3.2 Definition of the problem
The aim of this project is to investigate the ability of nuclear receptors to act as biological marker genes for the metabolic syndrome. The motivation for NRs as focus for the project is two-fold. First, it has been observed that NRs seem to be dysregulated in many common metabolic diseases which are thought to make them excellent drug targets for disorders like the metabolic syndrome and other metabolic diseases (Francis et al., 2002). Secondly, at the research and development site at AstraZeneca in Mölndal an available nuclear receptor database exists, which includes information about known target genes and co-factors for NRs.
In the work of Halinen and Norseng (2002) patients were included into the metabolic syndrome patient group if they had disease diagnoses and/or diagnostic test levels indicating the presence of three or four risk factors. This division implies that patients with only two risk factors are not included in the positive patient group, but instead in the negative. Since there is no agreed definition of the metabolic syndrome, the possibility exists that patients, who in the case of Halinen and Norseng ended up in the negative patient group, instead should be in the positive patient group.
The differences in this approach opposed to the work of Halinen and Norseng is that this project aims to classify each of the risk factors individually and then to compare the rules generated from the classifiers. Therefore the problem stated above can be overcome when the different risk factors are analysed individually and the results are later compared. The purpose is to first compare the results generated from
the chosen technique for two of the risk factors and later compare the results for three of the risk factors and so on. By using this approach, it is hypothesised that more information can be extracted about genes that possibly act as gene markers both in the individual risk factors and in the metabolic syndrome.
3.3 Hypotheses
The main hypothesis is that by creating four different classifiers - one for each individual risk factor - and then comparing the results from the classifications, it is possible to identify biological marker genes involved in the metabolic syndrome. If genes can be found in this project that also exist in the Knowledge Bank (Halinen & Norseng, 2002), this could indicate that these genes are associated with the metabolic syndrome and that they possibly could be used as drug targets. The Knowledge Bank includes genes found by a literature review, which are known to be associated with metabolic syndrome risk factors. Three additional hypotheses were formulated for the comparisons of the results from the classifications. First, if one rule can be found to be overlapping in the results for diabetes, dyslipidemia, hypertension and obesity generated by different classifiers, it is hypothesised that the genes in that rule can be used as markers for the metabolic syndrome. Secondly, if individual genes can be found to be overlapping in the rule sets representing the different risk factors, it is hypothesised that the genes can act as gene markers for the metabolic syndrome and the including risk factors. Third, if an assembly of rules are created that contains the rules for each risk factor it is hypothesised that genes can be identified, which can act as genetic markers for the metabolic syndrome.
3.4 Objectives
Specify criteria for the included risk factors. The first step is to determine which
criteria should be used to characterise the risk factors. The BioExpress™ database contains both clinical data and gene expression data. The clinical data includes information about for example what diseases that a specific donor has and what test results he or she has. This step includes a literature review to be able to determine the criteria for the individual risk factors. The specified criteria will be based on the WHO and ATP III definitions of the metabolic syndrome and on the work of Halinen and Norseng (2002).
Selection and grouping of donors from the BioExpress™ database. The criteria
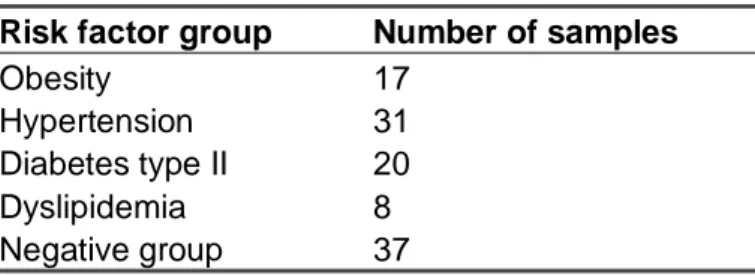
determined for each of the four risk factors will be used to select clinical data about donors from the BioExpress™ database. The data selected from the database will correspond to five different patient groups, one for each risk factor and one negative group that include patients that do not fulfil any of the criteria.
Selection of strategy for the treatment of missing values. The BioExpress™
database has the disadvantage of having many missing values, which will lead to the number of samples being low. It is necessary to find a method to handle this problem so that the classification can be performed.
Filtering of the NR data. For the nuclear receptors a NR database is available,
including both NRs and co-factors. The NR database contains 174 distinct co-factors and 22 distinct target genes for known NRs. It is necessary to search for gene_id and probe set for the nuclear receptors in the NR database, because they will be used to select the relevant gene expression data from the BioExpress™ database. Furthermore, this phase aims to select the best probe sets among a set of multiple probe sets for some specific genes.
Extraction of gene expression data. The different donor groups and the nuclear
receptors will be used to extract the relevant gene expression data from the BioExpress™ database.
Selection of a data mining technique(s). In this objective the aim is to choose a data
mining technique, which can later be used to classify patients to each of the four different risk factors. The choice of data mining technique(s) will be determined by the chosen gene expression data, depending on how great quantities of data and the quality of the data. The quality of the data represents the existence of errors in the data and the possible missing values. It is necessary that the data mining technique is suitable for the specified problem in this project. One important property is that it must be easy to interpret and compare the results from the algorithm.
Classification of risk factors. The purpose in this objective is to create one classifier
for each of the four risk factors. Gene expression data for the donors in the different risk factor groups will be used as input to the classifiers and four different outputs will be generated.
Analysis and comparison of the four classifications. The four created classifiers will
be investigated to see if it is possible to find any similarities. The classifiers will be compared in order to identify marker genes for the metabolic syndrome. This objective includes creating a method for comparing the four outcomes from the classifiers and later also to perform the comparison of the results from the classifiers.
Analysis and evaluation of the comparisons. The results from the comparison of the
four different classifiers will be analysed. A validation and a comparison with the study by Halinen and Norseng (2002) will be performed in order to investigate if similar genes are found in this project as the genes included in the Knowledge Bank. The Knowledge Bank is a set of genes that Halinen and Norseng (2002) recorded in a literature review on the metabolic syndrome risk factors. The genes included in the Knowledge Bank were found in scientific literature reports and were known to be related to any of the risk factors included in the metabolic syndrome. If identical genes can be found from the projects, this could indicate that these genes are associated with
the metabolic syndrome and that they possibly could be used as drug targets. Furthermore, if genes are found that are not included in the Knowledge Bank, this does not imply that the genes are not interesting, because the Knowledge Bank is not complete. Hence, the possibility exists that genes that until now are not known to be associated with the metabolic syndrome risk factors still can be interesting. Additional information is needed about the possibly found genes and the analysis includes searching the literature for information regarding the genes.
4 Method
The specified method used in the thesis is characterised by the process being very explorative, meaning that the path from the initial specification of the criteria to the final data processing and analysis of the results was not always straightforward. Several problems were encountered, especially in the data cleaning part of the method, where for example missing values and a low number of samples in different risk factor groups occurred. In addition, the cleaning of the NR data also involved problems like choosing the best probe sets for genes that had several probe sets where the expression patterns differed considerably for the same gene. The overall process includes a strong iterative element, especially in the data collection phase of the study. In this project, the intention was to learn more about the metabolic syndrome, by generating one classifier for each risk factor and then compare the results from each risk factor in order to search for genetic markers, an approach which could be referred to as an indirect way for deriving knowledge and new hypotheses and models regarding the metabolic syndrome.
4.1 Overview of the process
The method used in this project includes a series of steps presented in detail in the following subchapters, and a short overview of the whole process is given in figure 3. In the first phase of the project the clinical background on the metabolic syndrome and the included risk factors was investigated to be able to determine the criteria for creating the donor groups for each risk factor. Diagnostic tests were specified from these criteria that could be used for extracting the donors from the BioExpress™ database.
Different methods for the handling of missing values were investigated and two specific methods for this purpose were tried. In the following step data was extracted from the BioExpress™ database in order to construct the different risk factor groups. Donors with extreme lifestyle factors were then removed from the risk factor groups to decrease the risk of having donors that could affect the following data analysis in a negative way. In order to determine which samples would be in the final risk factor groups that would be used as input to the data analysis, research was made with the intent to find the tissues that are best suited for the expression profile analysis.
When the final risk factor groups were created, a data-cleaning phase followed, the aim of which was to investigate the quality of the probe sets. The risk factor data and the NR data were then used as input in order to extract the gene expression data from GeneLogic. A technique for performing the data analysis was chosen and the analysis was made. The results from the data processing were analysed to determine which of the decision trees that would be used in the comparison of the risk factors. The chosen trees were transformed into rules and the rules were then compared. An analysis followed with the aim of evaluating the comparisons.
Specification of criteria for the included risk factors
Development of diagnostic tests from the specified criteria for each risk factor
Extraction of data from the BioExpress database Selection of a method for the handling of missing values in the BioExpress database
Analysis of lifestyle factors with the GeneLogic GUI
Extraction of samples belonging to the chosen tissue(s)
Selection of tissues
Cleaning of the Nuclear Receptor data.
Extraction of gene expression data
Selection of a data analysis technique
Data analysis with the chosen method
Combination of the results from the data analysis technique
Analysis of the results Donor data
4.2 Specify criteria for the included risk factors
To be able to define which donors belong to which risk factor group, the first step in the study was to specify criteria for the risk factors, including diabetes mellitus type II, hypertension, dyslipidemia, obesity, microalbuminurea and insulin resistance. In the work made by Halinen and Norseng (2002) criteria were specified for the previously mentioned risk factors to be able to determine which donors could be included in the metabolic syndrome group and in the non-metabolic syndrome group, respectively. The study performed by Halinen and Norseng was used as a starting point when determining the criteria in this work.
A literature review was conducted to investigate if the criteria set up by Halinen and Norseng could be reused without modifications or if any changes would have to be applied. The final criteria specified were based both on the WHO and ATP III definitions of the metabolic syndrome and on the work of Halinen and Norseng (2002). The criteria were used to specify diagnostic tests that later in the project were to be applied to extract donors from the BioExpress™ database. When the BioExpress™ database documentation was investigated it became clear that diagnostic tests were not available for each of the six risk factors. In the case of diabetes mellitus type II, hypertension, dyslipidemia and obesity, diagnostic tests existed in the database but when it comes to microalbuminuria and insulin resistance no test could be applied. Because of this, only diabetes mellitus type II, hypertension, dyslipidemia and obesity could be used in the experiments of classifying the individual risk factors. The diagnostic tests for these risk factors are shown in table 1.
RISK FACTOR DIAGNOSTIC TEST
Diabetes mellitus type II Fasting/Random blood glucose Systolic Blood Pressure (SBP) Hypertension
Diastolic Blood Pressure (DBP) High Density Lipoprotein (HDL) Dyslipidemia
Triglycerides
Body Mass Index (BMI) Obesity
Weight/Length2 measurement
Besides the quantitative measurements, qualitative descriptions for the measurements of glucose, high-density cholesterol (HDL) and triglycerides were also considered when determining whether a diagnostic test could indicate a risk factor or not. The qualitative assessment of the measurements has been made by a clinician who has determined if the given test is ´LOW´, ´NORMAL´ or ´HIGH´ when placed in context of that specific donor. It was in this project assumed that the qualitative assessments could give indications of the clinical relevance of the diagnostic test results, which means that a test with both a high measurement value and a ´HIGH´ quality assessment could be considered as more certain than a high measurement value that had a quality assessment that is ´LOW´ or ´NORMAL´. In the case of
Table 1. Metabolic Syndrome risk factors and the corresponding diagnostic tests available in the BioExpress database.
hypertension and obesity, no qualitative descriptions were available for their corresponding diagnostic tests in the BioExpress™ database and therefore no qualitative value could be taken into account for these tests.
For each of the four risk factors two different donor groups were created. One donor group was constructed from less stringent criteria and one donor group was constructed from more stringent criteria. The donor group with less stringent criteria had the requirement that a donor had to be guaranteed to fulfil the criteria for the given risk factor to be included in that risk factor group, but there was no constraint against a donor being included in some of the other risk factor groups. The reason for these less stringent requirements was that a more extensive part of the database could be used for the data analysis. The second group was made with a much more stringent requirement, where each donor could only be included in one of the four risk factor groups and no overlap was allowed at all. The motivation for using these groups was that it would be interesting to compare the groups against each other to search for differences and similarities. Table 2 specifies the diagnostic tests used for each risk factor. The final definitions for each risk factor are shown in table 3 for the stringent criteria and table 4 for the less stringent criteria.
RISK FACTOR DIAGNOSTIC TEST DESCRIPTION POSITIVE TEST NEGATIVE TEST Diabetes mellitus type II
Glucose Glucose (mg/dL) ´HIGH´ ´NORMAL´ SBP Systolic Blood Pressure (mmHg) ≥140 <140 Hypertension DBP Diastolic Blood Pressure (mmHg) ≥90 <90 HDL High Density Lipoprotein (mg/dL) 30≤HDL≤40 or 'LOW´ 40<HDL≤80 or ´NORMAL´ Dyslipidemia Triglycerides Triglycerides (mg/dL) >149 or ´HIGH´ ≤149 or ´NORMAL´
Obesity BMI Body Mass Index
(kg/m2) ≥30 or (W/L2)≥30* 20≤BMI<30 or 20≤(W/L2)<30* 1
Table 2. Diagnostic tests for the four risk factors in the BioExpress database. The positive tests column includes the diagnostic test for each risk factor that a donor must fulfil in order be included in the specific group. The negative tests correspond to the tests that must be fulfilled for donors included in the negative group, i.e. the donors considered as normal in this thesis.
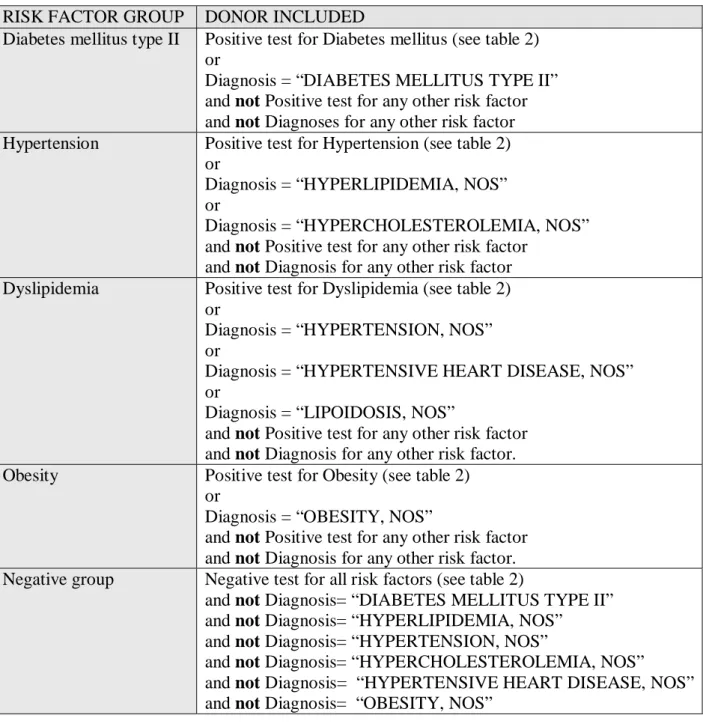
RISK FACTOR GROUP DONOR INCLUDED
Diabetes mellitus type II Positive test for Diabetes mellitus (see table 2) or
Diagnosis = “DIABETES MELLITUS TYPE II” and not Positive test for any other risk factor and not Diagnoses for any other risk factor Hypertension Positive test for Hypertension (see table 2)
or
Diagnosis = “HYPERLIPIDEMIA, NOS” or
Diagnosis = “HYPERCHOLESTEROLEMIA, NOS” and not Positive test for any other risk factor
and not Diagnosis for any other risk factor Dyslipidemia Positive test for Dyslipidemia (see table 2)
or
Diagnosis = “HYPERTENSION, NOS” or
Diagnosis = “HYPERTENSIVE HEART DISEASE, NOS” or
Diagnosis = “LIPOIDOSIS, NOS”
and not Positive test for any other risk factor and not Diagnosis for any other risk factor. Obesity Positive test for Obesity (see table 2)
or
Diagnosis = “OBESITY, NOS”
and not Positive test for any other risk factor and not Diagnosis for any other risk factor. Negative group Negative test for all risk factors (see table 2)
and not Diagnosis= “DIABETES MELLITUS TYPE II” and not Diagnosis= “HYPERLIPIDEMIA, NOS”
and not Diagnosis= “HYPERTENSION, NOS”
and not Diagnosis= “HYPERCHOLESTEROLEMIA, NOS” and not Diagnosis= “HYPERTENSIVE HEART DISEASE, NOS” and not Diagnosis= “OBESITY, NOS”
RISK FACTOR GROUP DONOR INCLUDED
Diabetes mellitus type II Positive test for Diabetes mellitus (see table 2) or
Diagnosis = “DIABETES MELLITUS TYPE II”. Hypertension Positive test for Hypertension (see table 2)
or
Diagnosis = “HYPERLIPIDEMIA, NOS” or
Diagnosis = “HYPERCHOLESTEROLEMIA, NOS” Dyslipidemia Positive test for Dyslipidemia (see table 2)
or
Diagnosis = “HYPERTENSION, NOS” or
Diagnosis = “HYPERTENSIVE HEART DISEASE, NOS” or
Diagnosis = “LIPIDIOSIS, NOS” Obesity Positive test for Obesity (see table 2)
or
Diagnosis = “OBESITY, NOS”
Negative groups All donors in the GeneLogic database minus the donors in the corresponding risk factor groups specified above
Several changes have been applied compared to the criteria specified by Halinen and Norseng (2002). First of all, in this study each risk factor was investigated individually while Halinen and Norseng (2002) used a combination of risk factors in their method. Furthermore, in the diagnostic test specified for glucose, no quantitative value was used in this project because of the fact that the BioExpress™ database does not distinguish between fasting and random blood glucose. Instead only the quantitative description was used. Regarding the diagnostic test for hypertension, the criteria have become more conservative in the way that the threshold values have been raised to SBP≥140 and DBP≥90 instead of Halinen and Norseng´s criteria of SBP >129 and DBP>84. The motivation for this change is that a more stringent criterion assumedly will give more clear groups with higher confidence in the fact that the donors in the hypertension group are hypertensive. Moreover, according to the WHO a threshold of SBP≥140 and DBP≥90 is recommended. After having a discussion with Dr Gérman Camejo (personal communication, 12 February, 2003) who is a senior principal scientist at AstraZeneca in Mölndal and who has internationally recognised expertise within the field of lipoproteins, it was determined that an interval should be used when defining the criteria for HDL. We did in this thesis not specify different Table 4. Final definitions for the risk factor groups created from the less stringent criteria.
syndrome. An additional modification is that when specifying the qualitative assessment for HDL for the positive test, ´LOW´ was used instead of ´not NORMAL´ because of the fact that an ambiguity occurs when using the latter criteria since ´not NORMAL´ includes both the qualitative assessments ´LOW´ and ´HIGH´. The same motivation is used when changing the qualitative assessment criteria for Triglycerides. ´HIGH´ was used instead of not ´NORMAL´ because of the ambiguity. One additional change in this project was that the diagnosis ”LIPIDOSIS, NOS” has been added to the positive test for dyslipidemia because it can be seen as an additional diagnose for dyslipidemia. In the case of obesity, an interval was used when specifying the criteria for the negative test. According to Dr Camejo (personal communication, 12 February, 2003), a threshold value of 20 could be used as a lower boundary for BMI. Donors with BMI <20 are extreme cases which could affect the following analysis in a negative way.
For the data analysis part of the project, it was necessary to have the four risk factor groups as well as one negative group that contained information about donors that did not belong to the opposite risk factor group. For the negative group made up with stringent criteria, the donors that did not belong to any of the four risk factor groups were included, i.e. the donors that did not have diagnosis or measurements for any of the specified risk factors. The negative groups made up with less stringent criteria instead included all the donors in GeneLogic except for the donors that belonged to the specific risk factor group. For example, the negative group for obesity contains all donors in the GeneLogic database minus the donors in the positive obesity group. In this way an extensive part of the GeneLogic database can be utilised.
4.3 Data extraction
4.3.1. Donor groups
When extracting donor data from the BioExpress™ database, the diagnostic tests discussed in chapter 4.2 (tables 2-4) were used. To extract information from the BioExpress™ database, the Standard Query Language (SQL) was used to query the underlying database tables. The aim of the data extraction was to create groups of donors that were guaranteed to belong to the specified risk factors. However, there was no requirement that the donors could not belong to more that one risk factor group. It was also confirmed that there was no overlap between the different groups.
4.3.2 Missing values
It was clear from the start of the project that the BioExpress™ database contained missing values. Different ways of handling this problem exists: One approach of handling missing values is to discard the units of data that are missing in some variables and to analyse only the complete data (Kotz, Johnson & Read, 1983). In this study this would imply only the use of donors that do not have any missing values in the measurements that are interesting when extracting the data with the diagnostic
tests. A second approach is to use any imputation-based procedure that corresponds to that the missing values are filled in and the resultant complete data are analysed by standard methods (Kotz, Johnson and Read, 1983). Common imputation procedures include substituting the missing values with the mean of the set of recorded values or substituting the missing values with the value that are most common in the set of recorded values. In this study it would be possible to make an estimation of the missing values, either by looking what the mean value are for the specific measurement in the existing values in the database or to look at the most common values in the database. One additional solution could be to investigate the mean values for that specific measurement in the American population and to use that value for imputation. An additional approach could be to set the missing value to the most common occurring value in the database for the specific measurement. Finally a solution is to treat the missing value as a normal value if no other clue is given. The advantage of only including the donors that lack missing values is that the insecurity factor that missing values brings, can be removed. A big disadvantage is however that the number of donors is likely to decrease. Advantages of making estimations of the missing values with respect to the overall population in the United States could be that it better reflects the reality. It is however difficult to make this estimation since it is assumed that the BioExpress™ database includes people that is much more sick than the overall population. The donors included in the database have visited a hospital, assumedly to get help with any problem and they have thereby been recorded in the database. The advantage of using the latter technique, that of treating missing values as normal values, is that the number of samples presumably will increase significantly. Furthermore the technique can possibly be thought of as reasonable, because of the fact that if no value exists, it is probable that a doctor or another person with clinical expertise did not consider it necessary to take the tests from that specific donor. One important disadvantage is the fact that this solution to the problem introduces an insecurity factor, which imply that donors who belong to the specific risk factor group can be falsely excluded and the other way around.
After considering the pros and cons for the different solutions it was decided that donors having a missing value in a column, which result in that a diagnostic test could not be made, should not be included in any risk factor group. This means that only the donors lacking missing values would be used. After trying out this solution to the problem, it became clear that a very low number of samples were left in the hypertension group and in the dyslipidemia group, respectively, to be able to proceed with the data extraction. Possible ways to overcome this problem, with respect to the different techniques for handling missing values reviewed above, were discussed. It was finally decided to use the solution of treating missing values as normal values on the hypertension and the dyslipidemia groups. It was hypothesised that the number of donors would increase greatly when applying the technique, but that it could introduce noise to the tests. Because of this, tables were created later in the process that showed which donors that were used as input to the data processing that had been affected by the technique, i.e. had been treated as normal. The reason was to make it possible to trace the donors when the analysis of the results was made, see Appendix D-F. For the diabetes and the obesity groups, the first solution was instead kept, which was to