VTI rapport 523A Published 2005
www.vti.se/publications
Placement and design of milled rumble strips on
centre line and shoulder
A driving simulator study
Anna AnundMagnus Hjälmdahl Håkan Sehammar
Göran Palmqvist Birgitta Thorslund
Publisher: Publication:
VTI rapport 523A
Published: 2005
Project code: 40574
SE-581 95 Linköping Sweden Project:
Design and placement of rumble strips
Author: Sponsor:
Anna Anund, Magnus Hjälmdahl, Håkan Sehammar, Göran Palmqvist and Birgitta Thorslund
Swedish Road Administration/Finnra
Title:
Placement and design of milled rumble strips on centre line and shoulder – a driving simulator study
Abstract (background, aims, methods, results) max 200 words:
A driving simulator experiment was carried out in order to investigate the effects on fatigued drivers of rumble strips on narrow roads (≤ 9 meters) on both shoulder and centre lines. The driving simulator was an advanced moving base passenger car simulator (VTI´s third generation moving base driving
simulator).
Four different physical designs of milled rumble strips and two placements on shoulder were used in the experiment.
Both driving behaviour (e.g. lateral position, speed, steering wheel angle) and physiological data (brain activity (EEG), eye activity (EOG) and muscle activity (EMG)) were recorded. The drivers were also asked to rate their level of sleepiness every 5 minutes during the drive. They were trained to use the Karolinska Sleepiness Scale (KSS).
Data from 40 regular shift workers driving during morning hours after a full night shift were used in the analysis. The shift workers were equally distributed by gender and recruited by advertisement in the newspaper. They were paid 150 Euro for participating. The experiment was approved by an ethical committee.
The experiment was carried out in two parts: the first part aimed to investigate primary effects of rumble strips, i.e. preventing an accident; the second part aimed to obtain the drivers’ conscious preferences in terms of placement and design.
It was concluded that despite rumble strip design and placement, rumble strips had clear alerting effects and consistently induced correct averting action. Based on the drivers’ preference and the results, there seems to be no risk associated with using more aggressive rumble strips such as Swedish or
Pennsylvania. Regarding the placement, there seem to be no differences and it is important to obtain the opinions of truck and bus drivers before it is possible to make a recommendation.
Utgivare: Publikation:
VTI rapport 523A
Utgivningsår: 2005
Projektnummer: 40574
581 95 Linköping Projektnamn:
Räfflors utformning och placering
Författare: Uppdragsgivare:
Anna Anund, Magnus Hjälmdahl, Håkan Sehammar, Göran Palmqvist och Brigitta Thorslund
Vägverket/Finska Vägförvaltningen
Titel:
Placering och utformning av frästa räfflor på landsväg – en simulatorstudie
Referat (bakgrund, syfte, metod, resultat) max 200 ord:
För att utreda effekterna av räfflor på smal tvåfältsväg (≤ 9 meters) genomfördes ett experiment i körsimulator. Simulatorn som användes var VTI:s rörelsebaserade III-generationens körsimulator. Fyra olika typer av fysisk design av räffla och två olika typer av placering testades i försöket. Såväl körbeteende (sidoläge, hastighet och rattvinkel) som förarens fysiologi (hjärnaktivitet (EEG), ögonaktivitet (EOG) och muskelaktivitet (EMG)) mättes. Vidare fick förarna skatta sin subjektiva upplevelse av sömnighet var 5:e minut under körningen. Detta skedde med hjälp av skattningsskalan Karolinska Sleepiness Scale (KSS).
Data från 40 skiftarbetare användes i analysen. Skiftarbetarna kom med taxi till VTI direkt efter avslutat nattskift. I försöket deltog lika många män som kvinnor och de rekryterades via annonsering i dagspressen. De fick 150 Euro i ersättning för att de deltog. Föreliggande studie har prövats av etisk kommitté.
Försöket var indelat i två faser: efter 10 minuters träning inleddes fas 1 som syftade till att beskriva primära effekter av räfflorna dvs. om de förhindrar olyckor eller rent av skapar olyckor. Denna fas pågick i maximalt 90 minuter. Därefter inleddes fas 2 vilken syftade till att fånga förarnas uppfattning om vilken placering och vilken typ av räffla som är den mest optimala för att väcka en förare som på grund av trötthet är på väg att lämna körfältet.
Slutsatsen är att oavsett typ av räffla och placering så hade räfflorna en klar effekt för att väcka förare och för att få dem att vidta korrekt motåtgärd. Baserat på förarnas preferens och på resultatet från körningarna så verkar det inte finnas något som motsäger sig en rekommendation av en mer aggressiv räffla av typ Svenska eller Pennsylvania på svenska vägar. Beträffande placeringen så verkar det inte finnas någon avgörande skillnad i effekt. Före en rekommendation kan göras bör dock effekten för förare av lastbil och buss utredas.
Preface
This study has been financed by the Swedish Road Administration (SRA) and the Finnish Road Administration (Finnra).
Those responsible for the study were Jan Moberg at SRA and Pauli Velhonoja at Finnra. Some parts were also conducted in collaboration with the EU SENSATION project. Contributors to the report were Anna Anund, Magnus Hjälmdahl, Håkan Sehammar, Birgitta Thorslund and Göran Palmqvist. They were involved in different aspects of the work, as follows:
Anna Anund: project leader, ethical approval, test leader and analysis. Magnus Hjälmdahl: design of experiment and scenario and test leader
Håkan Sehammar: simulation of rumble strips, definition and computation of dependent and independent variables
Birgitta Thorslund: simulator data, definition and computation of dependent and independent variables, test leader
Göran Palmqvist: Measurements of vibrations and sound in field test and simulation of those in the simulator
All these persons have contributed to the writing of the report.
In addition, certain irreplaceable people were involved. I would particularly like to thank:
Beatrice Söderström: Responsible for recruiting subjects but also for contact with them during the experiment. She was also one of the main test leaders.
Harry Sörensen: Measurements of vibration in field test. Mats Lidström: Simulation of scenario.
Björn Peters: Valuable and constructive comments during the work. He also worked as a test leader.
Joakim Östlund: Valuable and constructive comments during the work. He also worked as a test leader.
Mats Wiklund: Opponent during the review of the report. Anita Carlsson: Layout work and finalizing the report. Magnus Hjälmdahl and I have edited the report.
I would like to thank all of the people mentioned for their professional and irreplaceable work.
Linköping, August 2005
Table of contents
Summary ... 1
Sammanfattning ... 13
1 Introduction and background ... 13
2 Aim of the study ... 14
3 Method... 15
3.1 Experimental setting – moving base driving simulator ... 15
3.2 Subjects ... 16
3.3 Subject characteristics ... 16
3.4 Subject preparations and procedure... 18
3.5 Design and placement of rumble strip ... 21
3.6 Generation of the milled rumble strips in the driving simulator... 22
3.7 Study design ... 26
3.8 Measurements and parameters ... 27
3.9 DVD recording ... 34
3.10 Additional tests/measurements... 34
3.11 Statistical methods... 34
4 Results... 38
4.1 Placement... 38
4.2 Design of rumble strip ... 41
4.3 Usefulness and acceptance of rumble strips ... 46
4.4 Drivers’ opinion about the experiment ... 48
5 Discussion ... 50
5.1 Method... 50
5.2 Placement and design – drivers’ reaction ... 51
5.3 Placement and design – Drivers’ opinion and experience ... 52
5.4 Conclusions ... 52
5.5 Further research ... 53
6 References ... 54 List of Annexes
Annex 1 Exclusion criteria
Annex 2 Technical data for the moving base driving simulator at VTI Annex 3 Specifications of the Pennsylvania rumble strip
Annex 4 Specifications of the Swedish rumble strip Annex 5 Specifications of the Målilla rumble strip Annex 6 Specifications of the Finnish rumble strip
Annex 7 Questions relating to phase 2 – preference of placement and type of rumble strip
Annex 8 Questions about the subject background Annex 9 Questions before driving
Placement and design of milled rumble strips on centre line and shoulder – a driving simulator study
by Anna Anund, Magnus Hjälmdahl, Håkan Sehammar, Göran Palmqvist and Birgitta Thorslund
VTI
SE-518 95 Linköping Sweden
Summary
Milled rumble strips on centre and shoulder on narrow roads (≤ 9 meters) make drivers aware of leaving the lane and help them to carry out corrective actions safely.
Milled rumble strips have proven efficient in reducing the number of fatigue-related road accidents. However, there was a need for knowledge about what happens when drivers fall asleep and hit the rumble strips. This is essential in order to determine whether rumble strips can be used on narrow roads (≤ 9 meters) and both on shoulder and centre lines.
A driving simulator experiment was therefore carried out in order to investigate the effects of rumble strips on fatigued drivers. The driving simulator was an advanced moving base passenger car simulator (VTI’s third generation moving base driving simulator).
There were rumble strips both at the edge line and centre line. Four different physical designs of milled rumble strips and two placements on the shoulder were used in the experiment.
The four different physical designs of rumble strips were:
- Pennsylvania (width 50cm; depth 1.2cm; length 17cm; cc1 30cm) - Swedish (width 50cm; depth 2.0cm; length 30cm; cc 53cm) - Målilla (width 35cm; depth 1.0cm; length 15cm; cc120cm) - Finnish (width 17.5cm; depth 1.5cm, length 2.0cm; cc 30cm).
The design of the rumble strips varied not only in terms of length, width, depth and distance between the rumble strips, but also with regard to intermittence and continuity. The two different placements of the rumble strips on the shoulder resulted in lane widths of 3.25 and 3.50 meters. Sound and vibrations from real milled rumble strips registered in field tests were used in the simulator. The road was a 2-lane, 9 metre wide rural road.
Both driving behaviour (e.g. lateral position, speed, steering wheel angle) and physiological data (brain activity (EEG), eye activity (EOG) and muscle activity (EMG)) were recorded. The drivers were also asked to rate their level of sleepiness every 5 minutes during the drive. They were trained to use the Karolinska Sleepiness Scale (KSS).
Data from 40 regular shift workers driving during morning hours after a full night shift were used in the analysis. The shift workers were equally distributed by gender and recruited by advertisement in the newspaper. They were paid 150 Euro for participating. The experiment was carried out in two parts: the first part aimed to investigate primary effects of rumble strips, i.e. preventing an accident; the second part aimed to obtain the drivers’ conscious preferences in terms of placement and design.
One of the major concerns in this study was that the drivers might not be fatigued enough to fall asleep. This concern was, however, superfluous since most drivers (37 out of 40) were so sleepy that they fell asleep on several occasions during the drive. The three drivers who managed not to leave the lane showed signs of sleepiness. All drivers also rated themselves as more or less sleepy (level 7–9) with the help of the KSS throughout the driving experiment.
In total the test drivers drove on the rumble strips more than 400 times but in this study only the first eight events for each driver were used. The reason for this is that some drivers fell asleep on more than 15 occasions and if all events were used these drivers could have a disproportionate impact on the results. It should be pointed out that not all drivers experienced as many as 8 departures. In total 219 events were used in this study: 61 on the right hand side rumble strip and 158 on the centre rumble strip.
The analysis was done with ANOVA and separated for lane departures to the left and to the right.
Dependent variables were:
• Maximum excess - lateral position (m)
• Time from lane departure to “Steady State” (s) • Velocity at “Steady State” (km/h)
• Time since last lane departure (s)
• The number of steering wheel corrections per minute (reversals/min) • Time to correct action (s)
Independent variables were:
• Placement of rumble strip; 1=wide lane and 2=narrow lane • The order of the hit of lane departure (0–8)
• Design of rumble strip; 1=Pennsylvania, 2=Målilla, 3=Finnish and 4=Swedish. • Test person.
Departures to left (centre of the road) Placement (wide or narrow)
The analysis of variance did not show any significant differences between wide and narrow lanes (i.e. shoulder) for any of the dependent variables. There were significant effects with regard to the interactions between placement and type of design for the dependent variables describing the time gap between lane departures and time to correct action.
Type of design
The analysis of variance only showed significant differences between different types of rumble strips for time gap since last lane departure. The result showed that the time gaps between lane departures were shortest for the Finnish rumble strip (333.31 s) and
longest for the Swedish rumble strip (791.60 s). For the dependent variable describing the time gap between lane departures there were also significant interactions between placement and type of design of rumble strips.
Departures to the right (towards the shoulder) Placement (wide or narrow)
The analysis of variance showed significant differences between wide and narrow lane (main effects) for maximum excess. There were no significant interactions.
Design
The analysis of variance did not show significant differences between different types of rumble strips for any of the dependent variables. There were no significant interactions. During the second phase the drivers were asked what placement they preferred; 32 out of 40 said the wider shoulder, i.e. the lane width of 3.25. Based on this placement the drivers were also asked what type of design they preferred; 30 said “Swedish”, 5 “Pennsylvania”, 3 “Målilla” and 2 “Finnish”.
The majority of the drivers (95%) thought that rumble strips would contribute to
reducing the number of fatigue-related accidents. About 61% thought that there is a risk that sleepy drivers act in a way that contributes to a risky situation and 33% thought that there is a risk that milled rumble strips will mean that drivers extend the time spent driving.
It was concluded that despite rumble strip design and placement rumble strips had clear alerting effects and consistently induced correct averting action. Based on the drivers’ preference and the results, there seem to be no risk associated with using more
aggressive rumble strips such as Swedish or Pennsylvania. Regarding the placement, there seem to be no differences and it is important to obtain the opinions of truck and bus drivers before it is possible to make a recommendation.
It must be kept in mind that this study only included drivers of passenger cars. It may be that less aggressive rumble strips are not effective enough to wake up a driver of a heavy truck or a bus. It is also important to keep in mind that this study does not give answers with regard either to the long-term effect or with regard to the design of an optimal rumble strip to make sure that the driver is provided with enough feedback without disturbing people living in the vicinity.
The experiment was approved by an ethical committee (Regionala etikprövnings-nämnden i Linköping (EPN)), 2004 dnr 191/04).
Placering och utformning av frästa räfflor på landsväg – en simulatorstudie
av Anna Anund, Magnus Hjälmdahl, Håkan Sehammar, Göran Palmqvist and Birgitta Thorslund
VTI
518 95 Linköping
Sammanfattning
Frästa räfflor på mitten och vid kanten på smala 2-fältsvägar (≤ 9 meter) gör förare uppmärksamma på att de är på väg att lämna körfältet och får dem att på ett säkert sätt vidta motåtgärd.
Frästa räfflor har visat sig vara en effektiv åtgärd för att minska antalet trötthets-relaterade olyckor. Det finns dock ett behov av att veta vad som händer när förare somnar och kommer ut på räfflorna. Detta är nödvändig kunskap vid beslut om frästa räfflor kan användas på smalare vägar och såväl i mitten som på vägkanten av vägen. En simulatorstudie genomfördes för att utreda effekten av räfflor då förare som är på väg att somna kommer ut på dem. I försöket användes VTI:s III generations rörelse-baserade körsimulator.
I försöket användes räfflor både i mitten och på kanten av vägen. Fyra olika design av räfflor testades:
- Pennsylvania (bredd 50 cm; djup 1,2 cm; längd 17 cm; cc2: 30 cm) - Swedish (bredd 50 cm; djup 2,0 cm; längd 30 cm; cc 53 cm) - Målilla (bredd 35 cm; djup 1,0 cm; längd 15 cm; cc 120 cm) - Finnish (bredd 17,5 cm; djup 1,5 cm, längd 2,0 cm; cc 30 cm).
Designen varierade inte enbart avseende bredd, djup, längd och centrumavstånd. Det fanns även en skillnad avseende om de var kontinuerliga eller intermittenta.
Vidare testades två olika typer av placering av räffla vilket innebar att föraren hade olika manöverutrymme efter det att man kommit ut på räfflan. Konsekvensen var således att körfältsbredden varierades för de två placeringarna: 3,25 m alternativt 3,50 m. Ljud och vibrationer från körning på riktiga räfflor erhållna via fältstudier återskapades i simulatorn. Den väg som simulerades i försöket var en 9-meter bred väg med två körfält.
Såväl körbeteende (sidoläge, hastighet och rattvinkel) som förarens fysiologi
(hjärnaktivitet (EEG), ögonaktivitet (EOG) och muskelaktivitet (EMG)) mättes. Vidare fick förarna skatta sin subjektiva upplevelse av sömnighet var 5:e minut under
körningen. Detta skedde med hjälp av skattningsskalan Karolinska Sleepiness Scale (KSS). Syftet var att med hjälp av detta kontrollera om förarna var sömniga i samband med räffelpåkörningarna.
Data från 40 skiftarbetare användes i analysen. Skiftarbetarna kom till VTI direkt efter avslutat nattskift. I försöket deltog lika många män som kvinnor och de rekryterades via annonsering i dagspressen. De fick 150 Euro i ersättning för att de deltog.
Försöket var indelat i två faser: efter 10 minuters träning inleddes fas 1 som syftade till att beskriva primära effekter av räfflorna dvs. om de förhindrar olyckor eller rent av
skapar olyckor. Denna fas pågick i maximalt 90 minuter. Därefter inleddes fas 2 vilken syftade till att fånga förarnas uppfattning om vilken placering och vilken typ av räffla som är den mest optimala för att väcka en förare som på grund av trötthet är på väg att lämna körfältet.
Ett av de kritiska momenten i studien var om skiftarbetarna skulle vara tillräckligt sömniga, dvs. så pass sömniga att de somnade under körning. Detta visade sig vara ett mindre problem då majoriteten lämnade körfältet på grund av trötthet (37 av 40 förare). Även de tre som inte lämnade körfältet visade klara tecken på sömnighet. Förarna skattade även sin subjektivt upplevda sömnighet som stor (värde 7–9) med hjälp av KSS.
Sammanlagt inträffade drygt 400 avåkningar under de 40 förarnas körningar. I analysen har dock endast de 8 första avkörningarna för varje förare ingått. Anledningen till detta var att förare som hade ett stort antal inte skulle vara överrepresenterade i materialet. Det ska dock noteras att inte alla erfor så många som 8 avkörningar. Sammanlagt var det 219 händelser som användes; 61 av dessa var avvikelser till höger dvs. mot vägkanten och 158 var avvikelser till vänster dvs. mot vägens mitt.
Analysen genomfördes med hjälp av ANOVA och gjordes separata för avvikelser till höger respektive avvikelser till vänster.
Beroende variabler var:
• Maximal överskridande av linjen (m)
• Tid från överskidande av linjen till åter stabilt läge (s) • Hastighet vid stabilt läge (km/h)
• Tid sedan senaste överskridande av linjen (s)
• Antalet korrigeringar av rattvinkel per minut (omkastningar/min) • Tid till korrekt handling (s).
Oberoende variabler var:
• Placering av räfflor; 1=brett körfält and 2=smalt körfält • Ordningen på avkörningen (0-8)
• Typ av räffeldesign; 1=Pennsylvania, 2=Målilla, 3=Finnish and 4=Swedish • Test person.
Avvikelser till vänster (vägens mitt) Placering (bred eller smal)
Variansanalysen visade inte några signifikanta skillnader mellan brett och smalt körfält (gäller även bred och smal vägren). Det fanns signifikanta interaktioner mellan
placering och typ av räffeldesign för beroende variablerna som beskrev tid mellan avvikelser och tid till korrekt handling.
Typ av räffeldesign
Analysen visade på en signifikant skillnad mellan olika räffeltyper avseende för beroende variabeln som beskrev tid mellan avvikelserna. Tid mellan avvikelserna var kortast då den finska räfflan användes (333,31 s) och längst då den svenska räfflan användes (791,60 s). Det fanns även en interaktion mellan typ av räffla och design för beroende variabeln som beskrev tid mellan avvikelserna från körfältet dvs. räffelpå-körningarna.
Avvikelser till höger (mot vägkanten) Placering (bred eller smal)
Det fanns några signifikanta skillnader i resultat avseende brett eller smalt körfält för maximalt överskridande av kantlinjen. Det fanns inga signifikanta interaktioner.
Typ av räffeldesign
Det fanns inga signifikanta skillnader mellan olika typer av räffeldesign. Det fanns inte heller några signifikanta interaktioner.
Under fas 2 ombads förarna att ta ställning till vilken placering de föredrog: 32 av 40 föredrog en placering där körfältet var smalt dvs. 3,25. Detta innebär att man föredrog lösningen där ett större utrymme för åtgärd erbjöds. Förarna ombads med en utgångspunkt i den placering de föredrog att säga vilken typ av räffeldesign som de föredrog i syfte att påkalla en trött förares uppmärksamhet: 30 svarade “Swedish”, 5 “Pennsylvania”, 3 “Målilla” and 2 “Finnish”.
Majoriteten av förarna (95 %) trodde att räfflorna skulle bidra till att minska antalet trötthetsrelaterade olyckor. Cirka 61 % trodde att det finns en viss risk att räfflor kan bidra till ”nya” riskfyllda situationer och 33 % av förarna trodde att räfflor kan bidra till att förare kör längre tid i trött tillstånd jämfört med om inga räfflor fanns.
Slutsatsen är att oavsett typ av räffla och placering så hade räfflorna en klar effekt för att väcka förare och för att få dem att vidta korrekt motåtgärd. Baserat på förarnas
preferens och på resultatet från körningarna så verkar det inte finnas något som motsäger sig att rekommendera en mer aggressiv räffla av typ Svenska eller
Pennsylvania räfflan på denna typ av vägar. Beträffande placeringen så verkar det inte finnas någon avgörande skillnad i effekt. Före en rekommendation kan göras bör dock effekten för förare av lastbil och buss utredas.
Det är dock viktigt att komma ihåg att denna studie endast omfattade förare av
personbil. Det kan vara så att räfflor som förmedlar ett mindre intryck till förare inte i tillräckligt stor omfattning påverkar förare av t.ex. lastbil och buss. Vidare är det viktigt att komma i håg att denna studie inte ger svar på långtidseffekter av denna typ av åtgärd inte heller ges ett svar på hur en räffla ska se ut för att säkerställa att den har effekt för förare av alla fordonsslag utan att man får bieffekter i form av buller och som stör de som bor i anslutning till frästa vägsträckor.
Föreliggande studie har prövats av etisk kommitté (Regionala etikprövningsnämnden i Linköping (EPN), 2004 dnr 191/04).
1
Introduction and background
Research suggests that between 10 and 20% of all accidents are caused by sleep deprivation (Horne & Reyner, 1999; Lisper, 1977). Most common are accidents involving only one vehicle or accidents with oncoming traffic. There is a common belief among researchers in this area that analysis based on accidents reported by the police underestimates the problems posed by sleepy drivers (Åkerstedt, 2000; Åkerstedt & Kecklund, 2000). There is no doubt, however, that sleep deprivation is the cause of many accidents and no driver is exempt from the risk of falling asleep behind the wheel. One measure that can be taken to warn drivers who are about to leave the roadway is the use of milled rumble strips. The advantage of a milled rumble strip compared to the commonly-used profiled centre and edge line marking is that the warnings in the form of vibration and sound do not wear off. The profiled line marking is easily worn down by tyres and winter maintenance and their effect is rapidly decreasing, especially for heavy vehicles.
Historically, milled rumble strips have primarily been used at or in combination with the edge line marking but they can also be used in the middle of the road. In the US milled rumble strips have been used in this way for several years. They have used painted, pressed or milled rumble strips and the results indicate that they represent a very promising measure where accidents have been reduced by approximately 15% (Mahoney et al., 2003; Presaud et al., 2003). In Sweden, milled rumble strips have been used since the year 2000 and then on motorways. Evaluations (Larsson et al., 2001) have shown results to have been as good as in the US. In a study (Anund et al., 2004) it was shown that Swedish drivers believe in rumble strips as a traffic safety
countermeasure. Milled rumble strips could also be useful on Swedish 2-lane rural roads that are not wide enough to be separated by, for example, wire fences. The Swedish Road Administration is about to start to mill rumble strip on centre lines on narrow rural roads. On some of the roads with 2+1 lanes they are already in place instead of wire fences. There are also examples of roads of 9 metres and with 1+1 lanes that have milled rumble strips. The effect of the countermeasure seems to be positive (Anund, 2005). As the discussion above shows, there are strong arguments for the introduction of milled rumble strips on rural roads and their effect is well documented.
There are, however, a few issues that need more research and one of these is how a fatigued driver reacts when he/she hits a milled rumble strip. Another question is how the rumble strips should best be designed to be effective and allow enough room to manoeuvre without endangering the driver and other road users. This study will try to shed some light on these issues.
This study has been approved by the ethical board (Regionala etikprövningsnämnden i Linköping (EPN)), 2004 dnr 191/04).
2
Aim of the study
The aim of this study is to investigate what happens when fatigued drivers lose control and drift out of the lane on roads with milled rumble strips. Of special interest is how the drivers react and what countermeasures they take. This question is especially crucial on narrow roads where the room to manoeuvre is limited. A second aim of the study is to see how the effect on drivers varies between design and placing of the rumble strip. The research questions to be examined in this study are derived from the experiences of earlier research on fatigued drivers and on theoretical assumptions. They are illustrated in Figure 1 and are divided into three different categories based on the course of events when fatigued drivers are driving on roads with rumble strips. The first category
concerns the drivers’ reactions when they hit the rumble strip, the second concerns what measures are taken by the drivers at that point and the third category concerns how the drivers adapt their strategies after they have hit a rumble strip. The research questions are separated depending on whether they are related to the placement of the rumble strip or to the design of the rumble strip.
Reaction Corrective action Strategic choices
Placement of rumble strip Design of rumble strip
Figure 1 The design of the research questions in this study.
The main research issue regarding the placement is that the further to the right the rumble strip is located the stronger the driver reaction will be. This is due to the fact that time and space to manoeuvre before running off the road when they get the feedback from the rumble strip is smaller the further to the right the rumble strip is positioned. This in turn will lead to a more hastily corrective action which may be shown, for instance, in reaction time, steering wheel reversal rate and lane position. If the reaction is stronger it may also lead to the driver being more cautious and perhaps even more alert and he will therefore adapt his strategy to avoid such an experience in future. This may be shown in the time gap between incidents and mean speed between incidents. The research issue regarding rumble strip design is that the deeper the rumble strip, the more intense the feedback to the driver will be. This in turn will make the driver react more strongly and he will be more alarmed. The drivers’ corrective action may also be affected by the design which can be seen in the reaction time, the steering wheel reversal rate and the lane position. It is also likely that the deeper rumble strips will work as a greater deterrent than their more shallow counterparts and the drivers will adapt their strategy to avoid them. This may be seen in lane position, mean speed and time gap between incidents.
3 Method
3.1 Experimental setting – moving base driving simulator
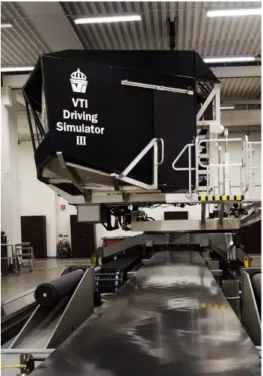
The study was carried out at VTI’s driving simulator III (VTI’s third generation moving base driving simulator). It was used to create realistic sensations in a laboratory
environment, including a:
- Cut-off passenger car cab - Computerised vehicle model - Large moving base system - Vibration table
- PC-based visual system - PC-based audio system
The driving simulator is shown in Figure 2. For technical specifications see Annex 2. The simulated car had a manual gearbox with 5 gears. The time delay introduced in the simulator is very short (40 ms), which is important when focusing on the control and manoeuvring aspects of driving. The noise, infra-sound and vibration levels inside the cabin corresponded to those of a modern vehicle. The car body used in this experiment was a Volvo 850.
The driving simulator model has been extensively validated. Simulation results have been compared to field test results of most standard vehicle dynamics manoeuvres (Steady State driving in a circle, step input on the steering wheel and frequency response) with good correspondence. This work has been documented in a number of reports (J. Aurell et al., 1999; J. Aurell, Nordmark, S., Fröjd, N., 2000; Jerand, 1997). Furthermore, a number of validation studies with an earlier version of a simulator used with the focus on driver behaviour have been carried out in a number of projects (Alm, 1995; Harms, 1993; Törnros, 1998; Törnros et al., 1997).
It is a difficult task to validate a driving simulator and, for this study, perhaps the most realistic validation is the comparisons that have been made between the vibrations from field studies with the simulated vibrations generated in the simulator (see chapter 3.6). The results show that correspondence is high. It was also noticed that the test subjects also experienced a high degree of realism during the test (see Figure 18).
3.2 Subjects
The results are based on the driving of 40 participants. They were recruited through an advertisement in a local newspaper. The selection of subjects strictly followed inclusion criteria defined in advance (see Annex 1).
Information about the drivers background was obtained via a questionnaire (see Annex 8). All questionnaires were originally written in Swedish and have been translated for this report.
3.3 Subject characteristics
Background
The subjects were aged from 23 to 56 years with an average age of 36 years (sd 8.38), and of these, 21 were female and 19 were male.
The subjects drove on average about 19,000 kilometres during the last year (sd 12,000 km), and they have had their driving licences for an average of 16.3 years (sd 8 years).
All of the subjects were shift workers. The majority (31 subjects) had been working night shifts for more than two years, four had been working for less than two years and three for less than six months. There were two subjects who did not answer this
question.
The drivers were asked how many days a month they work night shifts. The majority (22 subjects) worked for more than 10 nights each month, 7 worked for 6–10 nights each month and 8 for 3–5 nights each month. 3 subjects did not answer the question. Among the shift workers, 36 said that they enjoyed working the night shift. They were also asked how they normally returned home after a night shift. 30 subjects said they drove home by themselves, three went by bicycle, one walked and one used public transport. Five of the subjects gave multiple responses.
They were also asked if they normally became fatigued during the night shift and the majority said “Yes” or “Yes, often” (28 subjects), 10 answered “No, not often”. 2 subjects did not answer this question.
Experience of fatigue while driving and of incidents and accidents
The 30 subjects who drove home by themselves after work were asked if they had had experience of being very fatigued (fighting not to fall asleep) during the drive home. The results showed that 5 said “Yes, sometimes”, 17 said “No, not often” and 8 said “No, never”.
The subjects were asked if they, as drivers, had been involved in a fatigue-related incident during the last five years. An incident was defined as, for example, a near accident, wrong behaviour, driving off the road or periods of inattention. The majority (21) had not been involved in any incidents, 12 (32%) had experienced incidents and 5
did not know. Those who had experience were asked how many times they had been involved in fatigue-related incidents during the last 5 years. The results showed that 5 subjects had experienced 10 or more incidents each. The subjects were also asked what type of incident they had experienced. The following descriptions were received:
- Driving against red light
- Driving off the road (3 subjects) - Near accident – hit post box - Close to falling asleep - Swerving in lane - Inattention (3 subjects)
None of the drivers had been involved in a fatigue-related accident.
Sleep
The subjects were asked several questions about their sleep quality and their ability to fight fatigue during defined situations.
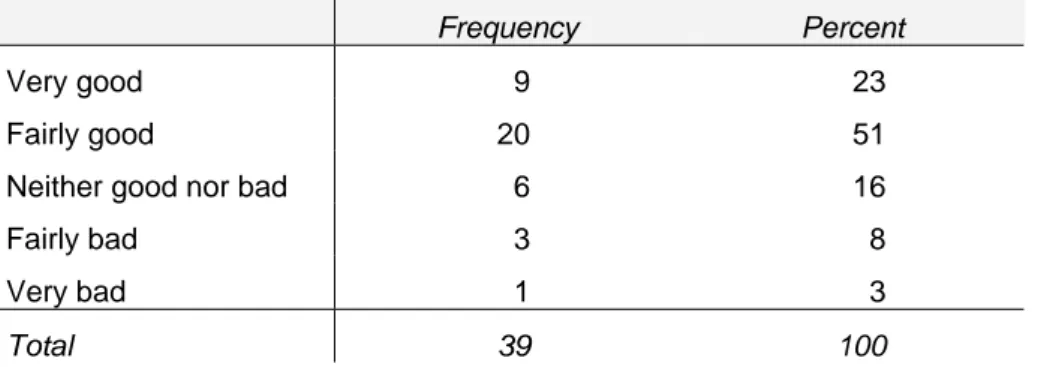
The drivers were first asked to judge their sleep quality (Question: “What is your
opinion about your sleep quality?”) (see Table 1).
Table 1 Subjects’ sleep quality. The number within the table corresponds to the number of subjects.
Frequency Percent
Very good 9 23
Fairly good 20 51
Neither good nor bad 6 16
Fairly bad 3 8
Very bad 1 3
Total 39 100
The majority found their sleep quality to be good to a greater or lesser extent (29 subjects), 4 found it to be bad to a greater or lesser extent (3 subjects) and 6 found it either good or bad. There was 1 person who did not answer this question.
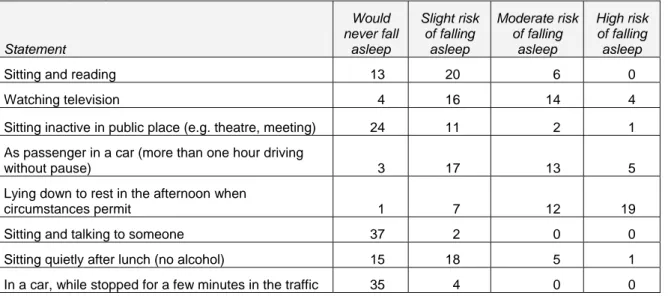
To observe the drivers’ sleepiness state in general the Epworth sleepiness scale was used (Johns, 1991). The ESS consists of 8 statements regarding different situations in daily life. Subjects were asked to rate on a scale from 0–3 how likely they would be to doze off or fall asleep in those eight situations, based on their usual way of life recently. The Epworth scale is validated and has shown high correlations with the more
Table 2 Epworth sleepiness scale, the number in the table corresponding to the number of subjects (n=39). Statement Would never fall asleep Slight risk of falling asleep Moderate risk of falling asleep High risk of falling asleep
Sitting and reading 13 20 6 0
Watching television 4 16 14 4
Sitting inactive in public place (e.g. theatre, meeting) 24 11 2 1
As passenger in a car (more than one hour driving
without pause) 3 17 13 5
Lying down to rest in the afternoon when
circumstances permit 1 7 12 19
Sitting and talking to someone 37 2 0 0
Sitting quietly after lunch (no alcohol) 15 18 5 1
In a car, while stopped for a few minutes in the traffic 35 4 0 0
Table 2 shows that situations in which the subjects found it most easy to nap or fall asleep were during an afternoon rest in bed and watching television. The situations with less risk of falling asleep were sitting talking to someone and driving while stuck in a traffic jam. The mean ESS was 7.5 (sd 2.8), ESS minimum was 2 and ESS maximum was 13. The ESS values observed for control groups within other studies (Johns, 1991) showed a mean ESS of 5.9 (sd 2.2), so subjects within this study reported higher sleep latency compared to “normal” people.
Since we were also interested in describing the subjects’ experience with regard to situations that shift workers may experience while going home from a night shift, we asked three more questions using the same approach as the ESS (see Table 3).
Table 3 Subject ratings regarding experienced sleep while going home from work.
Statement Would never fall asleep Slight risk of falling asleep Moder-ate risk of falling asleep High risk of falling asleep Total
When I am driving home after a night shift 27 11 1 0 39
When I have been driving for more than 30 minutes
on a motorway or featureless road 27 10 1 0 38
When I am travelling by bus or train 3 17 12 7 39
The results indicated that the majority did not experience a risk of falling asleep. But it has to be noted that about 25% reported that there was a slight risk of falling asleep when they were driving home.
3.4 Subject preparations and procedure
Since it was very important that the subjects should be sleepy during the experiment, they were recruited from among shift workers. They arrived at VTI after their night shift
had ended and their normal sleeping hours were due to begin. For safety reasons, the subjects were picked up at work and driven home afterwards by taxi.
Prior to the experiment the subjects received information on how to prepare for the study and they were instructed not to:
- drink alcohol for 72 hours before the experiment
- drink coffee, tea or other drinks that have an alerting effect for 3 hours before arriving at VTI
- eat for 3 hours before arriving at VTI
- take a nap during the night shift before the experiment - wear make-up when arriving at VTI
The procedure during the experiment was as follows:
Arrival at VTI
Two subjects where tested each morning when they first arrived at around 6.00 am and the second at around 7.00 am depending on when they got off work.
Before driving
Before driving, the subjects had to complete a few questionnaires and had to be fitted out for the experiment. This phase took place in the medical laboratory at VTI and lasted for approximately one hour.
There were several questionnaires that they had to complete and it was also important that the consent agreement was fully understood and signed. Documents that were handled were:
• Background questionnaire (Annex 8) • Shift schedule
• Sleep diary
• Acceptance of DVD-recording • Information about payment
At this point the subjects also received information about the sleepiness scale used for assessing their level of sleepiness; the Karolinska Sleepiness Scale (KSS) (see chapter 3.8.2) and they also got some time to practise using it.
This study was carried out in co-operation with the European SENSATION project (www.sensation-eu.org) and for this project physiological measurements such as brain activity (EEG), muscle activity (EMG) and eyelid measurements (EOG) were also used (see Annex 11). For these, electrodes had to be fitted to the subjects’ heads and faces and this was also carried out during the hour in the medical lab. The ensuing results were not used in this study. For more information on these measurements, see Annex 11.
Driving
When all the questionnaires were completed and the physiology equipment had been fitted and calibrated, the actual driving in the simulator started. The time in the simulator was divided into three parts: training, experiment and subjective rating on rumble strips. Altogether the session in the simulator lasted for between 70 and 120 minutes.
Phase 0, training: 10 minutes
During the training the subjects were able to become acquainted with the simulator and its performance. They were also instructed to drive on the rumble strips in order to experience what this felt like and they practised gauging their sleepiness according to the KSS-scale while driving. During and after the training the test leader talked to the subjects through the intercom to make sure that everything was ok and that they understood the task.
Phase 1, experiment: 45–90 minutes
When the training was completed, the experiment started. During the experiment, the experiment leader did not communicate with the subjects. Every fifth minute the text “Sömnig?” (“Sleepy?”) appeared in front of the subject and they then had to rate their sleepiness according to KSS. The scale was fitted to the centre of the steering wheel for reference.
When (if) the subject fell asleep and drove onto the rumble strip the experiment leader observed the subject’s reaction according to an observation sheet (see Annex 7). These observations were mainly done to make it possible to go back to the DVD recordings afterwards and to look in more detail at sections of interest.
Phase 2, subjective opinion on rumble strips: 10 minutes
When the experiment was finished, the subjects were interviewed on their opinion regarding the position of the rumble strips and the various types of rumble strips. This can be regarded as an interactive questionnaire where the experiment leader asked the questions (Annex 7) through the intercom while the subjects could experience the rumble strips when driving. The purpose was to obtain the opinion of drivers who were fatigued and who had experience of driving on rumble strip roads when fatigued.
After driving
When the driving was finished the subjects went back to the medical laboratory where they completed a questionnaire about their experience of rumble strips, both previous experience from real life and that which they gained during the experiment. They also completed a questionnaire on how they experienced driving in the simulator (not related to rumble strips).
While doing this they were served coffee or tea and sandwiches, the electrodes were removed and they also rated their sleepiness according to the KSS scale one last time. This part took less than 30 minutes and when finished the subjects left VTI by taxi. To summarise, the following questionnaires were used:
• Screening questions – to make it possible to describe the subjects who participated (see Annex 1)
• Before driving – to describe the subjects’ way of living the day and night before the experiment (see Annex 9)
• Questions after driving – to find out the drivers’ impression of the drive and of the simulator (see Annex 10).
3.5 Design and placement of rumble strip
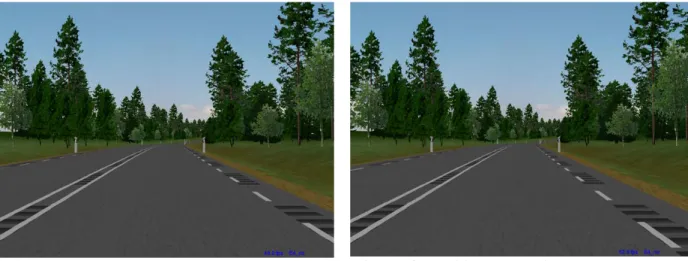
The road that was used had a speed limit of 90 km/h and the road width was 9 metres. The rumble strips were placed inside continuous road markings in the centre of the road and in combination with normal road markings on the shoulder. The scenario consisted of two placements, one closer to the verge (see Figure 3) and one placed a little bit more towards the centre of the road (see Figure 4). In placement 1 the width of the roadway (between lines) was 3.50 metres and in placement 2 it was 3.25 metres.
Figure 3 Rumble strip – Placement 1, wide roadway – narrow shoulder, Swedish design.
Figure 4 Rumble strip – Placement 2, narrow roadway – wide shoulder, Swedish design.
Four different designs of rumble strip were used in this study: Pennsylvania (width 50cm; depth 1.2cm; length 17cm; cc 30cm), Swedish (width 50cm; depth 2.0cm; length 30cm; cc 53cm), Målilla (width 35cm; depth 1.0cm; length 15cm; cc120cm) and
Finnish (width 17.5cm; depth 1.5cm, length 2.0cm; cc 30cm). The design of the rumble strips varied not only in terms of length, width, depth and distance between the rumble strips, but also with regard to intermittence and continuity.
For detailed specifications of the rumble strips and their respective placements on the road, see Annex 3 to Annex 6.
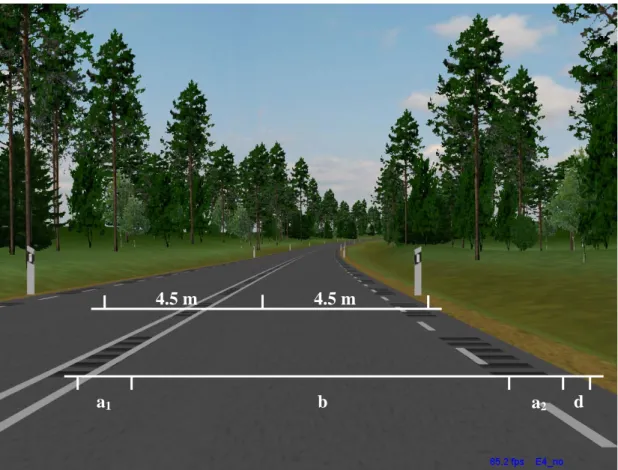
Since the width of the rumble strips varied between the designs, this affected the road layout. The road width was always held constant at 9 metres for all the designs and the roadway (“b” in Figure 5 below) was either 3.5 for placement 1 or 3.25 for placement 2. The width of the rumble strip (a1 & a2) varied for all designs, which meant that the
a2
b d
a1
4.5 m 4.5 m
Figure 5 The layout of the road and the measurements that are varied between designs and placements.
3.6 Generation of the milled rumble strips in the driving simulator
To generate the feeling of driving on milled rumble strips in the simulator, the sound system was used to produce noise, the moving base introduced vibrations into the simulator car cabin and the torque motor introduced vibrations in the simulator steering wheel. The different effects of driving on milled rumble strips were measured by driving an instrumented vehicle on existing milled rumble strips and these effects were then reproduced in the driving simulator.
Generation of sound
The sound was recorded when driving on existing milled rumble strips. This was done for each of the four types of rumble strip at two different speeds (90- and 110 km/h). For the Finnish rumble strips measures were also taken at 70 km/h. All measurements were taken using a passenger car (Audi A6). It should be underlined that differences are expected depending on type of car.
The recorded sounds were then replayed in the simulator sound system.
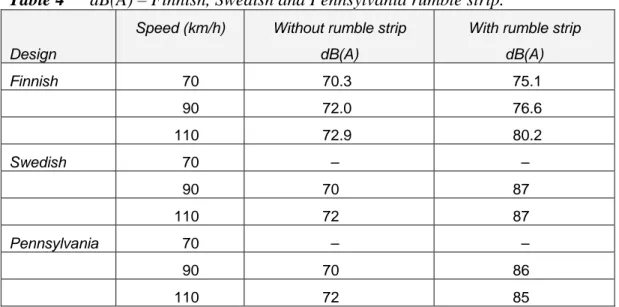
Noise level measurement
In the instrumented vehicle, the noise levels when driving on milled rumble strips were measured. This was only done for the Finnish rumble strip but measurements have been taken previously for Pennsylvania and Swedish rumble strips (Anund, 1998) (see Table 4).
Table 4 dB(A) – Finnish, Swedish and Pennsylvania rumble strip.
Design
Speed (km/h) Without rumble strip
dB(A)
With rumble strip dB(A) Finnish 70 70.3 75.1 90 72.0 76.6 110 72.9 80.2 Swedish 70 – – 90 70 87 110 72 87 Pennsylvania 70 – – 90 70 86 110 72 85
Generation of car cabin vibrations
The instrumented vehicle was equipped with accelerometers mounted between the two front seats as shown in Figure 6. The vertical acceleration was then simulated in the simulator by the use of hydraulic actuators.
Figure 6 Accelerometers mounted between the two front seats. Limitations of car cabin vibration reproduction
Due to limitations in the simulator moving base system for simulation of the vertical vibrations, the frequency content that can be reproduced from the measured vertical acceleration in the real car is band-limited to be below 20 Hz.
In Figure 7, the simulated accelerations in the simulator cabin are compared with the measured ones in the real car when passing the actual type of rumble strips. The time history signals as well as the PSD (Power Spectrum Density) are shown.
the real car that are shown are low pass filtered for easier comparison with the simulated ones. The PSD diagrammes for the corresponding unfiltered accelerations are also shown.
Pennsylvania and Swedish rumble strip
0 1 2 3 4 5 6 7 8 -2 0 2 m/ s 2
Vertical acceleration in the real car. Low pass(40 Hz) filtered. Pennsylvania rumble strips at 90 km/h.
0 1 2 3 4 5 6 7 8 -2 0 2 m/ s 2 time [sec]
Vertical acceleration in the real car. Low pass(40 Hz) filtered. Sw edish rumble strips at 90 km/h.
0 10 20 30 40 50 60 70 80 90 0 0.2 0.4 m 2/s 3
PSD vertical acceleration in the real car. Unfiltered and low pass(40 Hz) filtered. Pennsylvania rumble strips at 90 km/h. low pass filtered unfiltered 0 10 20 30 40 50 60 70 80 90 0 5 10 frequency [Hz] m 2/s 3
PSD vertical acceleration in the real car. Unfiltered and low pass(40 Hz) filtered. Sw edish rumble strips at 90 km/h. low pass filtered unfiltered 0 1 2 3 4 5 6 7 8 -2 0 2 m/ s 2
Vertical acceleration in the simulator cabin. Pennsylvania rumble strips at 90 km/h.
0 10 20 30 40 50 60 70 80 90 0 0.5 1 m 2 /s 3
PSD vertical acceleration in the simulator cabin. Pennsylvania rumble strips at 90 km/h.
0 1 2 3 4 5 6 7 8 -2 0 2 time [sec] m/ s 2
Vertical acceleration in the simulator cabin. Sw edish rumble strips at 90 km/h.
0 10 20 30 40 50 60 70 80 90 0 1 2 m 2 /s 3 frequency [Hz]
Målilla rumble strip 0 1 2 3 4 5 6 7 8 9 10 -2 0 2 m/ s 2 time [sec]
Vertical acceleration in the real car. Low pass(40 Hz) filtered. Målilla rumble strips at 89 km/h.
0 10 20 30 40 50 60 70 80 90 0 0.2 0.4 m 2 /s 3 frequency [Hz]
PSD vertical acceleration in the real car. Unfiltered and low pass(40 Hz) filtered. Målilla rumble strips at 89 km/h. low pass filtered unfiltered 0 1 2 3 4 5 6 7 8 9 10 -2 0 2 time [sec] m/ s 2
Vertical acceleration in the simulator cabin. Målilla rumble strips at 89 km/h.
0 10 20 30 40 50 60 70 80 90 0 0.5 m 2 /s 3 frequency [Hz]
PSD vertical acceleration in the simulator cabin. Målilla rumble strips at 89 km/h.
Finnish rumble strip
0 1 2 3 4 5 6 7 8 9 10 -2 0 2 m/ s 2 time [sec]
Vertical acceleration in the real car. Low pass(40 Hz) filtered. Finnish rumble strips at 90 km/h.
0 10 20 30 40 50 60 70 80 90 0 0.1 0.2 m 2 /s 3 frequency [Hz]
PSD vertical acceleration in the real car. Finnish rumble strips at 90 km/h.
Figure 7 Simulated acceleration in the simulator cabin compared with the measured ones in the car.
Generation of steering wheel vibrations
The car used for measuring effects of the milled rumble strips was fitted with an
accelerometer mounted on the steering wheel (see Figure 8). The measured acceleration of the steering wheel was then converted to a corresponding torque and simulated by the torque motor that controls the simulator steering wheel.
Figure 8 Accelerometer mounted on the steering wheel. Limitations of the steering wheel acceleration measurement
Ideally the acceleration of the steering wheel should have been measured without the driver affecting the steering wheel. This, however, was not possible when measuring in real traffic since the driver must have his/her hands on the steering wheel to keep the car in the correct position.
3.7 Study design
The experiment was carried out in two parts: the first part was designed to study the effect of rumble strips on sleepy people. Of particular interest were the subjects’
reactions, corrective actions and the space required to carry out the manoeuvre. Part two was designed to study the subjects’ preferences in terms of placement and acceptance of the various rumble strip designs. Of particular interest were the comfort/discomfort experienced, safety, noise and space for manoeuvres.
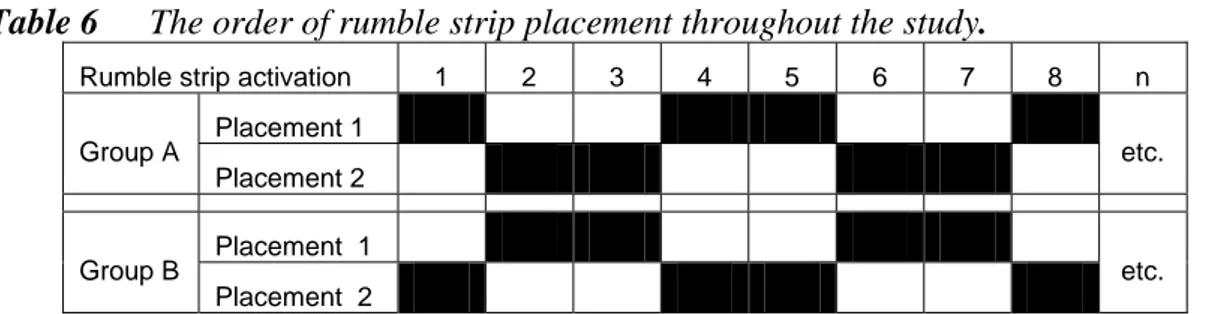
Since the main focus in this study was to examine the effects of two different placements of the rumble strips, a “within subject” design was used for rumble strip placement; for the possible effects of the design of the rumble strip a “between subjects” design was used (see Table 5). The forty subjects were divided into four groups and each group of ten subjects experienced one type of rumble strip. The position of the rumble strip was changed each time the driver had drifted outside the roadway and onto the rumble strip. The position changed when the driver had returned to his/her lane and was more than 30 cm inside the centre or edge line. The order of the placements was balanced so that half of the subjects in each group started with placement 1 and half with placement 2 (see Table 5).
Table 5 Study design.
Swedish Pennsylvania Målilla Finish
n=10 n=10 n=10 n=10
Placement 1
(narrow shoulder)
Placement 2
(wider shoulder) Between subjects
Within subjects
Table 6 The order of rumble strip placement throughout the study.
Rumble strip activation 1 2 3 4 5 6 7 8 n
Placement 1 Group A Placement 2 etc. Placement 1 Group B Placement 2 etc.
Subjects drove for a maximum of 90 minutes or until they themselves asked to terminate the experiment. Alternatively, the experiment could be stopped by the experiment leader if the subject was so sleepy that he/she had fallen asleep on several occasions and had severe difficulties in staying awake for even a short period of time. The aim of the test run was then considered to have been achieved and it was neither realistic nor necessary to continue. This means that the number of events varies between the subjects. For the analysis, the first eight rumble strip encounters will be used.
After part one of the test run was finished, the subjects were asked for their subjective opinion on the placement of the rumble strips. They tried both locations for the
Pennsylvania rumble strip; the test leader guided them and asked them a few questions according to a pre-defined questionnaire. When the subject had decided which location they preferred, he/she tried the various types of rumble strips and ranked these based on their preferences (see Annex 7 for the full questionnaire and experiment leader
instructions).
3.8 Measurements and parameters
This chapter is divided into two parts: driving performance and assessment of driver fatigue.
3.8.1 Driving performance
In Table 7, measurements recorded are shown. Speed and lateral position are defined as basic measurements. Mean speed and standard deviation of lateral position are
calculated and are defined as driving performance measurements. The sampling is done through time.
Table 7 Basic measurements recorded.
Basic driver behaviour measures Unit Comments
Distance travelled m Sampling starts at 200 m.
Speed km/h
Lateral position m Position of the middle of thecarinrelation to the centre line.
Steering wheel angle deg 0 = middle, positive clockwise (CW) Longitudinal m/s2
Lateral acceleration m/s2
Steering wheel torque Nm Positive counter clockwise (CCW) Steering grip sensor left V 0 – 0.5 V
Steering grip sensor right V 0 – 0.5 V
Lateral velocity relative road m/s Used for TLC calculations Lateral acceleration relative road m/s2 Used for TLC calculations
Based on the measurements shown in Table 7, variables for the analysis were computed (see Table 8).
Table 8 Variables used in the analysis.
Variable Description Used in
analysis
TP Test Person Independent
NR The order of the hit of the lane departure (1-8). 0=time period before the first hit Independent
PLAC Indicates if there was a wide lane =1 or a narrow lane = 2 Independent
SIDE Indicates the side of the lane departure; left = 1 right = 2 Independent
TYPE Design of rumble strip; 1=Pennsylvania, 2=Målilla, 3=Finnish and 4=Swedish Independent
VHIT Velocity at the moment of lane departure [km/h] Dependent
MAXEXD Maximum excess (Lateral position) [m]. Left: distance from rumble strip on right side to the left side of the left wheel. Right: distance from rumble strip left side to the right side of the right wheel (m).
Dependent
TIMESS Time from lane departure to “Steady State” [s] (times>=time for lane departure + 2 seconds (s)
Dependent
VSS Velocity at “Steady State” [km/h] Dependent
TIMEGAP Time since latest lane departure [s]. The time for the first lane departure is from the beginning of the drive.
Dependent REVRATE The number of steering wheel corrections per minute (1 grade) [reversals/min] Dependent TCA Time to correct action [s]. The time from lane departure until the driver makes the
first correct action.
Dependent
One situation/variable that first needs to be explained is “Steady State”. Steady State after hitting rumble strips is defined as the time until he/she is back in the lane and all actions (steering, braking etc.) are finalized i.e. the subject is driving “normally” again. Drivers have different driving behaviours and it is necessary to define a measurement that is based on the individual’s normal driving behaviour. Steady State is based on the “steering wheel angle rate” as a control variable. Steering wheel angle rate can be
regarded as normal as long as the measurements are on average plus/minus one standard deviation (defined for the time before the first lane departure). When a driver has a lane departure “Steady State” is reached when the driver is back in the lane and the steering wheel angle rate for at least 70% of 2 seconds is less than the defined normal steering wheel angle rate. In Figure 7 an example is shown. The time window is 2 seconds, shown via horizontal lines. When the drivers reach Steady State this is shown as a change in the horizontal line.
2.494 2.496 2.498 2.5 2.502 2.504 2.506 2.508 2.51 2.512 2.514 x 10⁴ -10 -5 0 5 10 15 20 Steer. angle (Steer ang. vel.)/2 Side pos left Side pos right Hit
Figure 9 Example of Steady State – TimeSS = 6.52 s.
The driver has quite quickly corrected the lane departure and got back into Steady State after 6.52 seconds.
9.09 9.095 9.1 9.105 9.11 9.115 9.12 x 10⁴ -10 0 10 20 30 40 Steer. angle
(Steer ang. vel.)/2 Side pos left Side pos right Steady State
Hit
Figure 10 Example of Steady State – TimeSS = 11.64 s.
It should be pointed out that the drivers swerved a great deal even when he/she was back in the lane.
In Figure 11 an example of incorrect action is shown. 7.582 7.584 7.586 7.588 7.59 7.592 7.594 7.596 7.598 7.6 x 10⁴ -30 -20 -10 0 10 20 30 Steer. angle (Steer ang. vel.)/2 Side pos left Side pos right Hit
Figure 11 Example of incorrect action.
In Figure 12 an example of correct action after lane departure is shown. 5.132 5.134 5.136 5.138 5.14 5.142 5.144 5.146 x 10⁴ -20 -10 0 10 20 30 40 50 60 Steer. angle (Steer ang. vel.)/2 Side pos left Side pos right Hit
In Figure 13 a correct action before lane departure is shown. 7.254 7.256 7.258 7.26 7.262 7.264 7.266 7.268 x 10⁴ -10 -5 0 5 10 15 20 25 Steer. angle (Steer ang. vel.)/2 Side pos left Side pos right Hit
Figure 13 Correct action before lane departure, TCA = 0.
To judge when a driver has performed a correct action, the “steering wheel angle rate” was used. A low pass filter (2 Hz) was used before using the measurement. Correct action = driver has an absolute “steering wheel angle rate” that is greater than
4 grades/second and in the right direction, meaning that the car is going back into the lane. This measurement was manually corrected since problems are posed if a driver performs a correct action before the actual lane departure (see Figure 11 and Figure 12). 3.8.2 Assessment of driver fatigue – Subjective sleepiness scale (KSS)
During the test it was crucial to define the subject’s level of sleepiness. One main reason for this was that we needed to know that the observations were made when drivers were sleepy. It is difficult to define the drivers’ scale of sleepiness or fatigue. It could be based either on objective measures with regard to physiology (EEG, EOG and EMG) or on subjective measures (subjective ratings scales). The optimum would be to use both, but since analysis of physiological data is very time-consuming it was not possible to do so within this study. In the experiment we have used only subjective ratings based on the Karolinska sleepiness scale (KSS). The KSS has been validated against objective measurements of sleep (Åkerstedt & Gillberg, 1990). The KSS were sent by post to the subjects before the experiment and they were instructed to train themselves to use the scale. They were also reminded and again trained in use of the
experiment the drivers rated their sleepiness every 5 minutes. The subjects were instructed to give a number that corresponded to how they felt during the last five minutes (since they scored the last time or since the start if it was the first time). They were instructed to use intermediate decimal steps if needed.
The modified version (Reyner & Horne, 1998) of the Karolinska Sleepiness Scale was used, (see Table ). They were instructed to use intermediate decimal steps if needed. A printout of the scale was placed on the steering wheel as a reminder for the subject.
Table 9 Karolinska Sleepiness Scale, modified by Reyner and Horn (1998).
Rate Verbal descriptions
1 extremely alert
2 very alert
3 alert
4 fairly alert
5 neither alert nor sleepy
6 some signs of sleepiness
7 sleepy, but no effort to keep alert 8 sleepy, some effort to keep alert
9 very sleepy, great effort to keep alert, fighting sleep
3.9 DVD recording
To make it possible to go back and see what happened and also to make it possible to show the system, all driving sessions were saved onto DVD. The DVD recorder used was a Philips DVD-R 70 recorder. The picture was split into four windows showing the road, the driver’s face from the front and the driver from a lateral view in which the whole body and face were visible. In the fourth window the physiological screen was captured. The subjects were asked to sign an agreement about being recorded on DVD while driving and that the recording could be used in the research.
3.10 Additional tests/measurements
The experiment was performed in collaboration with the Karolinska Institutet and with partners within the SENSATION EU projects. Some additional data with regard to drivers’ physiological and sleep behaviour were therefore collected. These data are not shown within this report but are available to interested partners. The data recorded were brain activity (Electroencephalogram – EEG), muscle activity (Electromyogram – EMG) and eye movements (EOG – electrooculogram). Before the subjects started to drive in the simulator some pre-tests were done, while drivers’ physiological data were recorded. The tests were: Bio-calibration, Karolinska Drowsiness Test (KDT), Reaction test, Pupillometri, Subjective rating of sleepiness. A detailed description of equipment used, settings and pre-tests can be found in Annex 11.
3.11 Statistical methods
Since there was an interest in the effects on several dependent variables for both placement and design of rumble strips, several analyses were performed. Data were analysed with analysis of variance and a significance level of 5% was used through all
tests. If an effect was significant it is shown. The F-values are not given in the text, but can be found in Annex 12. A post hoc test (Tukey) was also performed. If they showed significant differences they are also included in Annex 12.
Independent variables
The independent variables (factors) for which we were interested to find out the effects of the dependent variables were the following:
PLAC: Placement of rumble strip; 1=wide lane and 2=narrow lane
NR: The order of the hit of lane departure (1-8); 0 where assigned for the period before the first hit
TYPE: Design of rumble strip; 1=Pennsylvania, 2=Målilla, 3=Finnish and 4 Swedish
TP: Test person (Random and nested since all TP only experienced one type of design but both types of placements)
Since the hypotheses were focusing on placement and design of rumble strips these two factors were of most interest. There was also a need to eliminate the effects of test subject, order of lane departure.
Dependent variables
The dependent variables were chosen to try out the hypothesis defined in chapter 2 (Aim of the study). They were the following:
MAXEXD: Maximum excess – lateral position (m)
TIMESS: Time from lane departure to “Steady State” (s) VSS: Velocity at “Steady State” (km/h)
TIMEGAP: Time since last lane departure (s)
REVRATE: The number of steering wheel corrections per minute (reversals/min) TCA: Time to correct action (s)
The dependent variables used are described in detail in Table 8.
Mean and standard deviation for velocity and lateral position had values for all lane departures (hit of rumble strips) but also for the period before the first lane departure. For the rest of the dependent variables, data is only included from the first lane departure (order=1).
In the presentation of the results, the main effects on dependent variables for placement and type of design of rumble strip are shown, but also interactions on the first level. The analyses were separated for lane departure to the left and to the right. The responses from questionnaires are presented descriptively with mean and standard deviations.
Model
The model that was used was the same despite dependent variables. An example from the SPSS syntax file is used to present the model. The example deals with the dependent variable “maxexd”.
Example from SPSS-syntax:
UNIANOVA
maxexd BY plac nr type tp /RANDOM = tp
/METHOD = SSTYPE(3) /INTERCEPT = INCLUDE /POSTHOC = type ( TUKEY) /CRITERIA = ALPHA(.05)
/DESIGN = plac nr type tp(type) plac*type nr*type plac*tp(type) plac*nr. (This describes the model)
Number of observations
The subjects experienced lane departures to a very different extent depending on how sleepy they were. If the distribution of lane departures with a threshold on maximum 8 for each subject is used, the results show that there were in total 219 lane departures; 158 to the left and 61 to the right. Among the departures to the left, 78 were on narrow lane and 80 on wider lane. The departures to the right were also equally distributed between narrow and wide shoulder (31 on narrow lane and 30 on wide lane). The distribution of observed lane departures for the first lane departure for each subject, on the left and right side respectively, are shown in Table 10–Table 12. Some of the subjects only experienced one lane departure and some experienced 8 or more.
Table 10 Distribution of the first lane departures based on each driver’s first departure.
The first ”hit” Type
Swedish Pennsylvania Målilla Finnish Total
Placement Narrow 4 6 4 4 18
Wide 5 6 5 6 22
Total 9 12 9 10 40
Table 11 Distribution of lane departure on left side for placement (narrow/wide) and on type (Swedish, Pennsylvania, Målilla and Finnish).
Left side Type
Swedish Pennsylvania Målilla Finnish Total
Placement Narrow 16 28 18 16 78
Wide 15 29 16 20 80
Table 12 Distribution of lane departures on right side for placement (narrow/wide) and on type (Swedish, Pennsylvania, Målilla and Finnish).
Right side Type
Swedish Pennsylvania Målilla Finnish Total
Placement Narrow 1 6 8 16 31
Wide 3 5 11 11 30