Glanceability in Vehicle Head-Up
Displays
Jennifer Larsson
Interaktionsdesign Bachelor 22.5HP Spring/2018Contact information
Author:
Jennifer Larsson
E-mail: jennifer.m.larsson@gmail.com
Supervisor:
Henrik Svarrer Larsen
E-mail: henrik.svarrer.larsen@mau.se
Malmö University, Konst, kultur och samhälle (K3)
Examiner:
Elisabet Nilsson
E-mail: elisabet.nilsson@mau.se
Abstract
The purpose of this thesis is to explore glanceability in a vehicle Heads-Up Display, with a focus on what factors should be considered in order to design for glanceability. The project has been conducted in cooperation with Uniti and Jayway, with the intended outcome to increase the knowledge about how to design glanceable vehicle Heads-Up displays. Through literature research and user-centred approaches, a low-fidelity prototype was created. From usability testing the low-low-fidelity prototype, knowledge was gained about needs, opportunities, problems, and observations, which was used in order to create a medium-fidelity prototype in a Virtual Reality setting. Usability tests were conducted on the medium-fidelity prototype, and the results were used in order to draw conclusions about what are the most important factors to consider when designing for a glanceable experience in a HUD. Significant factors were identified as the need for customisation in the HUD, auditory feedback, as well as relevance and amount of information presented to the user.
Keywords: HUD, Heads-up Display, Virtual Reality, Glanceability, Augmented Reality, Car
Acknowledgements
I would like to thank all participants in the user tests and interviews for their time, and for making this thesis possible. I would also like to thank Joel Buhrman and Ludvig Åkesson, the authors of DriVR – A driving school simulator in VR for their assistance and for lending me their driving simulator for my prototype. I would like to thank my supervisor Henrik Svarrer Larsen for his guidance, and my contacts at Uniti, Kim Johansson and Bo Johansson Möller for their help.
1 Introduction ... 9
1.1Purpose ... 9
1.2
Delimitations ... 10
1.3
Target Group ... 10
1.4
Research question ... 10
1.5
Contribution ... 10
1.6
Ethics ... 28
2 Companies ... 11
2.1Uniti ... 11
2.2
Jayway ... 11
3 Theory ... 12
3.1Heads-Up Displays ... 12
3.2
Usability ... 15
3.3
Glanceability ... 15
4 Related work ... 16
4.1Existing heads-up in cars ... 16
4.2
Aftermarket ... 17
4.3
Heads-up display applications ... 18
5 Methodologies ... 19
5.1Design process model ... 19
5.2
User-centred approach ... 20
5.3
Literature research ... 21
5.4
Iterations ... 22
5.5
Interviews ... 22
5.6
Observations ... 23
5.7
Sketching ... 25
5.8
Prototyping ... 25
5.9
Usability testing ... 27
6 Design process ... 29
6.1Inspiration phase ... 29
6.2
Ideation phase ... 32
6.3
Implementation phase ... 39
7 Main Findings ... 45
8 Discussion / Conclusion ... 47
8.1Discussion and Self Critique ... 47
8.2
Future direction ... 49
8.3
Conclusion ... 50
References ... 51
Figure 1: Mazda 3. Photo by Dambrāns, K. (2014) CC-BY 2.0 ... 17
Figure 2: The Hudway HUD. Photo by Automotive Italia, CC-BY 2.0 ... 19
Figure 3. IDEO.org human-centred design process (IDEO.org, 2015). ... 19
Figure 4 An overview of the design process inspired by IDEO.org, (2015) ... 29
Figure 5: Navigational elements ... 32
Figure 6: Navigational element placement in the HUD ... 32
Figure 7: Sketched HUD elements ... 33
Figure 8: Elements of user's windshield ... 34
Figure 10: Grouped interview comments ... 37
Figure 11: The VR car simulator ... 39
Figure 12: Screenshot from the VR prototype ... 40
Figure 13: Interview results ... 43
Figure 14: Navigation element ... 47
Acronyms
HUD – Heads Up Display AR – Augmented Reality VR – Virtual Reality Hi-Fi – High-Fidelity Lo-Fi – Low-Fidelity Mid-Fi – Medium-Fidelity1 Introduction
Heads Up Displays (HUDs) are getting more common in modern cars, where they are most often focused on navigation and measuring speed (Alves et al.,2013). As an effect of the significant technological revolution, vehicles have gone through significant changes and improvements (Alves et al., 2013), and the HUD is an example of that. This thesis explores the concept of glanceability within a vehicle HUD. Glanceability is achieved when allowing users to grasp displayed information with a quick glance (Matthews et al., 2006). In a car, there is the obvious added risk whenever the user, i.e. the driver, takes their eyes off the road, and because of that reason, glanceability is an essential part of any car HUD (Sun et al., 2015). Utilizing a HUD, according to Liu & Wen (2004), reduces the duration and amount that the drivers’ sight needs to deviate from the road, by giving the required information directly in the line of the drivers’ vision. By doing this, the HUD allows the driver to receive the information they require by glancing at it, which can increase road safety by minimising attention gaps for the driver (Liu & Wen, 2004).
This thesis is written in collaboration with Jayway and Uniti, which are also considered to be stakeholders in this project. The target demographic, as well as the users researched in this thesis, are the same as Uniti’s target demographic, the creative class (Uniti, 2018). The research question that this thesis aims to answer is: “How can we design for a vehicle Heads-Up Display that does not interfere with the driver’s attention on the road, by using interaction design methods such as glanceability?” This thesis goes through the background theory, related works, the methods used to answer the research question, the results from the design process, as well as discussing the results.
1.1 Purpose
The purpose of this thesis is to explore essential methods and factors to consider when designing for glanceability in a vehicle HUD. The purpose will be accomplished by using Interaction Design methods in a user-centred approach, showing what can be done to improve the design and user experience of existing HUDs. By doing this with user testing methods such as usability testing, user interviews, and user observations, the goal is to contribute knowledge about how
users conceive a HUD, and what they consider to be glanceable design. Theory and existing works will support the research conducted in this thesis.
1.2 Delimitations
The fieldwork during this thesis is limited to user tests in lab environments in order to remove the risk of accidents that might occur if the users had been driving a real car. Additionally, Uniti does not yet have a drivable prototype in which to conduct the research. As a consequence of this, the field work might produce different results than if it was conducted in a real vehicle, with a HUD prototype. Furthermore, the focus of this thesis is specifically on glanceability in the HUD.
1.3 Target Group
For the purpose of this thesis, the target group is defined to match Uniti’s target audience, which is defined as “the creative class”1. According to Uniti, the characteristic of this target group is that they are working within creative professions, e.g., design, IT, media, science and art. The target group tend to consume much new technological material and are also most likely willing to pay a lot to get high quality and good design. Furthermore, as described in IDEO.org, (2015), the work in this thesis has been done with a human-centred design approach, which is centred around getting to know the people being designed for. Accordingly, there has been a focus on finding test subjects that match the target groups description.
1.4 Research question
How can we design for a vehicle Heads-Up Display that does not interfere with the driver’s attention on the road, by using interaction design methods such as glanceability?
1.5 Contribution
This thesis aims to contribute to the interaction design community that consists of insights and knowledge about essential methods and factors to consider when designing a vehicle HUD for glanceability. Furthermore, it will explore how to best display information in the HUD in a glanceable way, that keeps the driver’s vision
of the road unobscured. Finally, it aims to produce value for Uniti in the form of knowledge about how users in their target group expect interactions with a HUD like the one Uniti have in their cars to function.
2 Companies
This section will briefly go over the two companies, Uniti and Jayway, that this thesis has been conducted in cooperation with.
2.1 Uniti
Uniti is a Swedish company developing an electric city car, optimised for urban environments. Uniti has the ambition to design for a user experience that replaces the typical interactions between driver and vehicle, with touch, swipe and glanceable interactions (Uniti, 2018). Uniti is replacing the dashboard with a heads-up display to unlock new navigation and safety features, which in turn has replaced almost all the interaction points with digital touchpoints.
When agreeing to sponsor this thesis, Uniti wanted in return that the thesis would explore the possibilities of a HUD and how users prefer to interact with it. They wanted knowledge about how to place HUD elements for optimal usability, and which elements the user wants to have on their HUD. In return, Uniti has contributed information and knowledge about how their HUD is constructed, in addition to providing design mock-ups of how they are planning on designing their HUD elements. For this reason, their sketches have been used as inspiration when creating the prototype HUD elements, and to save time during the prototyping stage of this thesis.
2.2 Jayway
Jayway is a design-driven software studio that was started in the year 2000, as a Java-specialized consulting studio, which later went on to start up several smaller further specialised companies. By 2009 these specialised companies were all merged into one company, Jayway.
Jayway has contributed to this thesis by providing office space and a Virtual Reality car simulator developed by another group of thesis writers at Jayway and was used to create and run the medium-fidelity prototype.
3 Theory
In this chapter, the theories behind the technologies that will be used in this thesis will be described. It will touch upon Heads Up Displays, glanceability, designing for user experiences, and virtual reality, and how all of this is connected to the theme of the thesis and interaction design as a whole.
3.1 Heads-Up Displays
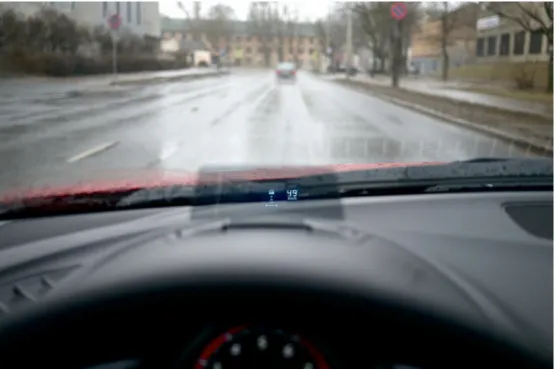
According to Oh et al., (2016), a Heads-Up Display in a car is a transparent digital image that is projected onto the windshield. The HUD often replaces instruments usually found on the dashboard, for example, the speedometer and navigation (Oh et al., 2016). A significant aspect of the HUD is to increase safety by displaying the visual elements in front of the driver’s vision. Thus, helping the driver focus on the road without needing to gaze at different screens to get the same information as the HUD is visualising (ibid.). Generally, heads-up displays in vehicles utilise a method that projects light onto the windshield, displaying the elements as reflections. A HUD generates a continuous superimposition between the HUD elements and the environment events (Oh et al., 2016). When using a HUD, it is critical to place elements in the right positions, this due to the complexity of how the background affects the readability of the information (Ward et al., 1995), and therefore the glance duration of the driver (Oh et al., 2016).
In an augmented reality head-up display (AR-HUD), elements are superimposed on the external visual world by projection onto the windshield (Sun et al., 2015), while giving the elements a sense of depth. With an AR-HUD, drivers have access to useful information displayed in front of their gaze, without needing to take their sight off the road (ibid.). The AR-HUD has the potential to make vehicles safer, but according to Sun et al., (2015) there are some concerns regarding driver distraction. This because when driving with an augmented reality head-up display, the driver
concentrates on the road while simultaneously attending information from the display, and this phenomenon could have a negative impact on safety. The essence of augmented reality is to integrate information to the driver without making the driver take away their gaze from the road while also enhancing visual information in the environment (ibid).
Uniti equips their cars with a HUD with a much larger area of use than many other on-market HUDs, which is needed since the HUD completely replaces a traditional dashboard (Uniti 2018). In this case, the design opportunity and design challenge revolve around displaying all information a driver finds necessary in a clear and glanceable way. Uniti’s goal is to create an AR-HUD, with several of the AR-HUD features outlined above.
3.1.1 Designing for heads-up displays
According to Sun et al., (2015) warnings on the HUD may not always give the intended outcome, on the contrary, they may result in the driver paying less attention to visual threats in the real world or the virtual world. Which may, in turn, lead to the driver missing essential safety threats, such as pedestrians or other vehicles. The AR-HUD may give an unexpected and unintended impact since it may be too demanding on the driver’s cognitive capacity in demanding situations (ibid). In order to make the most out of a HUD in a car, it is therefore essential to design for usability and glanceability. This while focusing on minimising interference with the user’s concentration and interaction with the vehicle (Liu & Wen, 2004).
Displaying information directly in the front of the drivers’ gaze has been shown to reduce glance duration, which in turn has been shown to improve driving performance, workload, and response speed of the driver (Oh et al., 2016). However, when designing for information being displayed in front of the driver, the superimposition of elements on top of the natural background could increase the gaze duration, due to the risk of the background influencing the visibility of text and icons in the display. The superimposition occurs if the elements on the HUD overlaps with objects such as pedestrians, buildings and other vehicles. The risk of this can be reduced by adjusting the number of objects in the HUD graphic area (ibid).
3.1.2 Risks with heads-up displays
One of the risks of utilising only a HUD for human-car interactions is that designers might want to make a lot of information available for the driver at once. This, in turn,
can lead to the driver not being able to access critical information by utilising glanceability and instead forcing the driver to lose their focus on the road (Sun et al., 2015). This issue leads to another issue with designing car HUDs, namely the need for drivers to divide their attention between the HUD elements and the road. When driving, the driver is continuously exposed to a flow of information that they must process and act upon. Putting this information in a location where it can be interacted with in a glanceable way can perhaps help the driver to maintain focus on the road at a greater extent (Sun et al., 2015). Sun et al., (2015), further pose that there might be an issue with designing for a balance between the information that HUD elements provide to the user and the need to not obscure the user’s focus or vision of the road. What is more, one phenomenon that can limit a user when driving is inattentional blindness, i.e. the inability to see and grasp visual information. This phenomenon might occur when a driver focuses on one primary task, while in another spatially commingled environment is presented with secondary information, in which case the secondary information is missed or misread (Sall et al., 2017). According to Sall et al., (2017) this can occur in a HUD, depending on the cognitive demand from the environment, such as when driving on a busy road. It is possible that information on the HUD that is related to the driving might be detected, but less important information to the driver, such as text messages or other notifications, might not be detected (ibid).
According to Oh et al., (2016) superimposition of road environment and display when using a HUD, had an adverse effect on the glance duration. Because of this, drivers should in superimposition situations use caution to reduce glance duration when looking at the HUD display. Superimposition can have an adverse effect on drivers due to the characteristics of a HUD, especially when text information is displayed.
3.1.3 Heads-up displays with audio
As will be discussed more closely in section 6 of this thesis, during the observation phases it was discovered that a majority of the test subjects would have preferred auditory feedback from the HUD, in addition to the visual feedback already provided. Therefore, further knowledge about using auditory feedback in HUDs was researched and will be presented here.
In a study Alves et al., (2013) compared two different approaches when using a head-up display, with or without warning sounds. In the study they used traffic signs to
indicate warnings on the augmented reality heads-up display, this due to the driver being already familiar with the signs and their meanings. The result of their study showed that the participants preferred the approach with warning sounds over the approach without any warning sounds. The participants found it more useful, even though there was no difference in the driving performance of the participants. According to Houtenbos et al., (2017) it may be beneficial for the driver with audio-visual feedback because the driver is then consciously informed about various traffic situations. Stanton & Edworthy (1999) say that “Driving is primarily a visual task and auditory feedback is thought to be beneficial where the visual information may be overburdened”. Although audio feedback to the driver may give beneficial effects, a side effect is an increased mental workload, and that can cause distractions (Houtenbos et al., 2017). Auditory feedback can attract a driver’s attention regardless of the orientation of eyes and head. Therefore, auditory feedback can be called gaze free.
3.2 Usability
Usability is responsible for confirming if users respond to the design in the way the designer intended, and that the overall experience, as well as specific interactions, are useful, usable and desirable. The strength of usability is in identifying problems (Cooper et al., 2014).
3.3 Glanceability
According to Matthews et al., (2006), glanceable design means enabling the users to grasp information displayed to them with a quick glance. Elements that can affect if the information displayed is glanceable to the user is the amount and type of information displayed, but also design elements such as colour, size, shape, position and contrast. When designing for glanceability, there should be a balance between these elements, to minimise the risk of it demanding too much attention. Furthermore, according to Matthews et al., (2006), glanceability is significantly affected by the sort and quantity of information displayed on the display, e.g. a heads-up display. For this reason, the quantity of information displayed will affect how the user interprets the information. Too many sources of information on the heads-up display will most likely be much more complicated for the user to interpret. Design components which also influence glanceability, are shape, colour size, contrast and position (ibid).
According to Matthews et al., (2006) glanceability refers to presenting relevant and essential information to your users in a way that allows them to easily and quickly understand and act on it. The information needs to be presented in a way that lets the user easily get a grasp of it, e.g. by careful use of text, colours, images, and icons (Matthews et al., 2006).
In order to make the most out of a HUD in a car, it is therefore essential to design for usability and glanceability. This while focusing on minimising interference with the users’ concentration and interaction with the vehicle (Liu & Wen, 2004).
4 Related work
During research for this thesis, several examples of related work were discovered, which has been used in different ways in order to gain knowledge about the field and to inspire the prototyping and observational phases. The reason behind the decision to research existing HUDs was to gain a wide knowledge about industry standards and existing features in HUDs. In order to gain as wide of a knowledge base as possible, this was not focused on only built in HUDs, but also mobile applications and aftermarket HUDs. As a result of this, I wanted to gain insight into how related products are designed for glanceability. Apart from this, I also wanted to gain insight into what the key aspects of designing for a HUD is, with a focus on glanceability. Through this research work, knowledge could be built about the field, and as a consequence, the design problem could be identified. This, in turn, gave a solid ground from which to base the design process. In this section, some of the related work, and how they have affected this thesis, will be presented.
4.1 Existing heads-up in cars
There are several other HUD solutions for vehicles on the market today, apart from Uniti. I have researched these during this thesis in order to gain knowledge about how HUDs in general work, what features they have, and what users generally consider to be important for a good user experience. As opposed to aftermarket HUDs, which I will discuss further in the next section, built in HUDs are often built into the car, behind the steering wheel, where they project the HUD onto the windshield (Adams, 2018).
During the research, the focus was mainly on a few different solutions. The Mazda 3 Sedan, which has a separate display where the HUD is displayed, not very unlike an aftermarket HUD (Mazda, nd). While researching this HUD, the goal was to gain a deeper insight into how Mazda displayed the information they wanted to show the user on their HUDs relatively small screen (see fig.1), while doing so in a glanceable way.
Figure 1: Mazda 3. Photo by Dambrāns, K. (2014) CC-BY 2.0
The 2018 Honda Accord (Honda, nd) projects the HUD onto the windshield, with minimal user configuration abilities, e.g. position, colour, or brightness. Based on reviews where this functionality was requested, it was decided to ask questions about customisation during the observational test phase, to gain further insight into how important customisation is for glanceability. The Nissan Xmotion SUV (Hawkins, 2018), which is currently only a concept being shown by Nissan, shows what is currently being innovated by other companies than my co-operators. This knowledge has given a valuable insight into what could be the future of vehicle HUDs.
4.2 Aftermarket
According to the U.S. Department of Commerce (2009), aftermarket accessories are vehicle parts made for comfort, convenience, performance, safety, or customisation, and are designed for adding to the vehicle after the initial sale. In this section,
aftermarket HUDs that have been researched, and how they have been used to influence this thesis, will be described.
Navion by Wayray (Wayray, 2018) is an aftermarket holographic navigation system, which overlays navigation onto the road, much like the way that Uniti is planning on handling their navigation. Navion was used as inspiration when creating my mock-up navigation elements for my usability tests, due to it being an established product on the market, with a great wealth of example videos and photos available.
Furthermore, commercial reviews and user stories about other existing aftermarket products have been researched to identify pain points, issues, and possibilities with existing HUDs. Information that was later considered when creating the prototypes. Kivic (kivic-one, 2017) was a good example of a HUD with a clean and simple interface, which was used as inspiration when designing the prototypes.
However, since aftermarket HUDs are often smaller devices that project their information on a smaller area than built-in HUDs, it was decided to not put as much weight on the issues with aftermarket HUDs, as have been put on built-in HUDs, due to these obvious differences. Instead, the focus was put on how they were designed for showing the information on a smaller area in a glanceable way, what information they showed and what the users found useful amongst that information, as well as how users interacted with the different HUDs.
4.3 Heads-up display applications
There is a collection of different HUD apps on the Apple App Store and Google Play store which promise the same functionality as the traditional HUD setup.
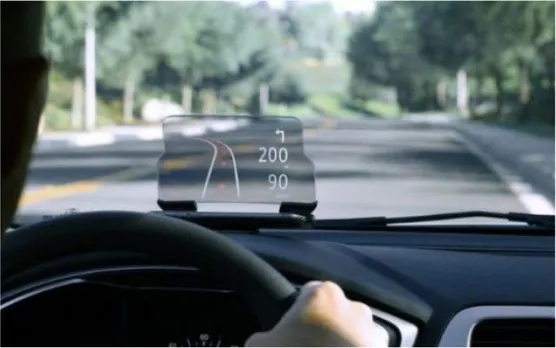
The applications that were researched at were developed by a company called Hudway (Hudway LLC, nd), and consisted of a collection of popular navigation widgets, e.g. speedometer, eco-driving and trip information, and a GPS navigation application. In order to function as a HUD, the user’s smartphone is placed close to their windshield, so that the smartphone screen is reflected in the windshield, creating a HUD display directly on it. An obvious drawback with this is that most smartphones do not have screens that are bright enough in order to for this work during daylight (Hudway LLC, nd) unless the user has a separate glass product that enhances the visibility of the HUD (see fig 2). From researching these applications, I gained knowledge about how to display different kinds of information, as well as gaining insight into design problems and how they could be solved.
Figure 2: The Hudway HUD. Photo by Automotive Italia, CC-BY 2.0
5 Methodologies
In the following chapter, the methodologies used throughout this paper, and how they relate to Interaction Design, will be described.
5.1 Design process model
During the thesis, the process has been inspired by IDEO.orgs´s human-centred design process model (see figure 3). IDEO.org (2015), suggest that human-centred design believes that the people who face the design problem every day are the ones that the designer can learn from, get a better understanding from and create design solutions for. No matter what kind of design challenge, in IDEOs design model, every project in a way or another goes through three phases: Inspiration, Ideation and Implementation.
Inspiration: During the inspiration phase the designer will get a better understanding
of the people they are designing for, their behaviours and desires (IDEO.org, 2015). During the thesis design process, the inspiration phase contributed to a better understanding of the design problem, and whom to design for, by gathering relevant information about the topic. In this thesis, the inspiration phase utilised various design methods, e.g. Interview, observation, sketching and literature research. In order to understand how to develop the design further, it is critical frame the design challenge properly (IDEO.org, 2015).
Ideation: During the ideation phase the designer gathers all the information that they
discovered during the inspiration phase. With this information, the designer can identify design opportunities and generate various ideas, which help to be able to test and refine design solutions (IDEO.org, 2015). During the thesis design process, the ideation phase helped to define design solutions for the design problem further and trying to solve the design problems found during the inspiration phase. During the ideation phase, some design methods were used, such as sketching, interview and low-fidelity prototype. The inspiration phase helped to get a better understanding with the help of research to ask the right questions during interviews, which assisted in further developing the design solution (IDEO.org, 2015).
Implementation: During the implementation phase the designer bring the final design
solution to implementation, and it can be presented in a prototype (IDEO.org, 2015). During this thesis, the implementation phase included prototyping and usability testing.
5.2 User-centred approach
User-centred designing involves collecting much information about the users and their tasks and then using this information to inform the design process (Rogers et al., 2011). Studying users in their “natural habitat” as they use a product, can provide
knowledge and insights that other data-gathering techniques might miss. Another important part of a user-centred approach is user involvement in the process, through evaluation studies or even allowing users to contribute actively to the design (Rogers et al. 2011).
In essence, a user-centred approach means that the real users and their goals, not just the technology, should be the main reason behind the development of a product (Rogers et al., 2011). As a result, a well-designed system should be directly relevant to the work it sets out to accomplish, should make the most out of the user’s skill and judgement, and should support rather than constrain the user (Rogers et al., 2011)
5.3 Literature research
Literature research was conducted in order to gain insight into the field this thesis intends to contribute to. This method includes gathering and using data and information that previous researchers have collected, recorded, and analysed (Muratovski, 2015). The literature studies have not only been aimed at conducting the necessary work in this thesis but also to give a better understanding for the readers (Muratovski, 2015). According to Baxter et al. (2015), it is important to conduct research of existing products, the domain of the project, as well as the target group before project initiation, as to not duplicate previous work and knowledge. In this thesis, existing products have therefore been researched in order to create prototypes based on the gathered information.
This literature was chosen because it gave a solid ground to base the research on and helped get an idea of the design problem, and also to formulate design solutions. A good amount of literature that described the possibilities and problems with HUDs was found, which gave a solid understanding of how to design for HUDs. On the other hand, there were issues with finding previous work about conducting usability tests in VR, which resulted in having to generate new knowledge about how to conduct the tests. This knowledge was generated by conducting several trial runs before the actual usability tests and basing most of the test setup on knowledge about usability testing outside of VR.
In the case of literature about modern vehicle HUDs, as well as literature about VR, two articles were chosen, i.e. Helft, (2017), and Adams, (2018). Due to these being articles, and therefore not containing academic references, it was kept in mind that they might be subjective opinions and not objective facts. The articles were found to
be beneficial since they provided more up-to-date information about two fields in rapid development.
5.4 Iterations
Working with iterations allows designs to be continually refined based on continuous feedback (Rogers et al., 2011). When designers and users start engaging with the product, discussing requirements, needs, expectations, and aspirations, they will come to new insight into how to work with the design. Since activities need to be repeated, iterations are needed to make use of new insights. (Rogers et al., 2011). In this thesis, iterations were applied by taking feedback received from the different phases of the prototype iterations and used it to make sure that the subsequent iterations were as informative as possible, in addition to taking the knowledge gained from the low-fidelity prototype phase in order to improve the medium-fidelity prototype.
5.5 Interviews
According to Cooper et al. (2014), it is important to conduct user interviews with both current and potential users if redesigning or redefining an existing product. The users of a product should be the primary focus of the design effort since they are the people who are personally utilising the product to accomplish a goal as opposed to their managers or support team. Potential users are users who are good candidates for using the product in the future, e.g. by being in the target group. According to (Cooper et al., 2014), interviewing both current and potential users will clarify how the current user’s experiences with the product might influence how they behave, think about, and interact with the product. Furthermore, according to Muratovski (2015), it is important to consider the interviewees’ privacy when conducting interviews in this way, and for that reason, permission to record was requested from each interviewee. The interview questions were also phrased in a way to avoid influencing the interviewee’s answers. To achieve this, they were non-biased and not worded in ways that would elicit a response that would be beneficial for this thesis. According to Goodman et al., (2012), there is always previous assumptions about how the interviewee will answer the posed questions, although being aware of these assumptions and expectations will make avoiding them easier, which in turn can lead to more honest and better-directed answers. As a consequence of the focus on
human-centred design, and thus the need to get feedback in the users’ own words (IDEO.org, 2015), the low-fi interviews were conducted in the interviewee’s vehicles, where they felt comfortable. Due to the nature of the mid-fi tests being at the Jayway offices, it may not have been an ideal and comfortable test environment for all interviewees, since not all of the interviewees were Jayway employees.
During this thesis, two sets of interviews were conducted. In order to get a broader knowledge of user behaviours, the interviews were approached from different ways (Cooper et al., 2014). The interviews started out in a more exploratory way, focusing on gathering knowledge about the user's perspective while keeping the questions open-ended in order to give room for the users to reveal behaviours and concerns that might not have been anticipated going into the usability tests (Cooper, 2014). For subsequent interviews, this knowledge helped get a better understanding of specific domains, where the questions could be further focused in order to get more clarifying answers. Which in turn connected the dots between different user viewpoints (Cooper, 2014). After each set of interviews, the results were processed, and the answers were assigned to four different categories, i.e. observation, needs, problems and possibilities, which were inspired by Nessler (2017).
5.6 Observations
According to Cooper et al., (2014), most users are incapable of accurately assessing their behaviours, and even more so when they are not in the context of that behaviour. In fact, most users have a fear of seeming dumb, incompetent, or impolite, and therefore may want to avoid talking about behaviours and interactions that they find problematic or hard to understand. As a result of this, interviews performed outside the context of the situation the designer wants to understand will result in less accurate and less complete data. In general, the designer can interview users about how they think and how they behave, or they can observe the user’s behaviour first hand. As one might expect, the latter of these two routes provides superior results (ibid).
Another reason that observations were used when the users conducted the tests was that interviews could produce convincing, but ultimately misleading, suggestions (Goodman et al., 2012). Users can idealise their needs and desires, and under those circumstances, their answers might not correspond to actual needs, behaviours, or values (Goodman et al., 2012). A designer needs to understand how people live, and
how they might want to live differently, and as such the task of user research is not just to discover product requirements (Goodman et al., 2012).
What the designer also need to keep in mind is that most people are unable to explain their actual behaviour and when and why they behave in a certain way while using the product. This especially noticeable when the users are removed from the situation context (Goodman et al., 2012). According to Cooper et al. (2014), users also avoid talking about software behaviours that they consider incomprehensible or problematic, in fear of seeming incompetent or impolite.
Therefore, user observations were also conducted in order to get a better understanding of the users and how they use the product (Rogers et al., 2002). When conducting the user observations and interviews, it was done out in the field, namely in a car, to get a better understanding and uncover what the test subjects did, how they thought, and how and why they behaved in a certain way. This method will help get a better understanding of the design problem and how the users use the product and what is valuable to them. This understanding, in turn, brought important details of the users’ behaviour to attention.
During the observations, a number of scenarios were presented to the users, which helped the user interact with the elements of the HUD in a natural way. Furthermore, talk out loud tests were conducted, where the user was asked to talk about the interactions as they were performing them and asked them to explain how they interpreted the elements and if the information could be taken in by a glance. Apart from the user observations done on the prototypes, field visits were also conducted, where existing users of other models of HUDs were interviewed. Field visits consist of going out and meeting people where they are at their most comfortable, at their regular places and activities (Goodman et al., 2012). Field visits move your research to a place where it is important to your target users, i.e. in their vehicles, and it uncovers what the users do and how they behave, showing what is valuable to them (Rogers et al., 2002). This was done to establish how existing users of HUDs interact with them and to discover what needs and issues these users have with their HUDs.
5.7 Sketching
Sketches, as well as prototypes, are instantiations of the design concept (Buxton, 2007). However, they serve different purposes and are therefore concentrated at different stages of the design process. Sketches dominate the ideation phase, while prototypes dominate the later stages of the process within the design funnel. In the early phases of the design process, sketches help the designer to test and explore different concepts, as well as during phases where there are still uncertainties about the design (Buxton, 2007). The major reason to use sketches for these situations is that they are cheap and disposable, and designers can quickly create different sketches in order to explore different concepts. As a result, sketching allows the designer to afford exploration, learning, and getting a deeper understanding of the field. Furthermore, spending time and money on higher fidelity work in the very beginning of the design process can have a negative effect on the process (Buxton, 2007).
Throughout the design process in this thesis, sketching enabled the possibility to explore and visualise ideas, as well as communicate ideas iteratively.
5.8 Prototyping
Within the process of interaction design, prototyping can be an essential tool. Prototypes can be used throughout the design process to test ideas and enable users and designers to discover and test the usability and functionality of the product. Prototypes enable the designer to start testing in an early state and allowing the designers to find any issues (Bansemir et al., 2014 in Marcus, (Ed.). 2014).
To make sure that the design process is user-focused and have been thoroughly tested, the designer should start with low fidelity paper prototypes and increasingly becoming more advanced as the design process moves forward (Bansemir et al., 2014 in Marcus, (Ed.). 2014).
Prototyping is an effective tool to test the technical usability of the suggested design and functions and help the designer to get a better impression of the user experience. (Rogers et al., 2011).Prototypes can both represent the complete user interface or parts of it and can be made by pen and paper or by code. Often, prototypes are used to address issues in the design and development process (Bansemir et al., 2014 in Marcus, (Ed.). 2014). The designer might test the whole system to get an overview.
Alternatively, they can test specific parts in order to have a more in-depth discussion with the users. While both these approaches might produce different outcomes from the testing, they can help the designer form a more in-depth understanding of what the problem might be, and ultimately how to solve it. Low-fidelity prototypes are used for testing design concepts, and they help to make design decisions in an early stage of the design process (Bansemir et al., 2014 in Marcus, (Ed.), 2014).
5.8.1 Low-fidelity prototyping
According to Bansemir et al., (2014) in Marcus, (Ed.), (2014), low-fidelity prototypes are characterised as easy and quick concrete representations of concepts, which are created in order to improve the product and to get quick feedback. They have low development costs, as well as a low technology cost, which allows the designer to experience with different design alternatives (Bansemir et al., 2014 in Marcus, (Ed.), 2014). With low-fidelity prototypes, the designer can use a set of materials, for example, paper, cardboard, or many others. (Bansemir et al., 2014 in Marcus, (Ed.). 2014). Low-fidelity prototypes can positively influence the design process, to create a common understanding of an interface and are served as thinking tools to show an idea that the designer has (Bansemir et al., 2014 in Marcus, (Ed.). 2014).
Paper prototypes were used in order to get a better understanding of the design problem and to get a better insight into what might be the problem from the user's perspective (Bansemir et al., 2014 in Marcus, (Ed.), 2014). The goal was to get an insight into how the users interacted with the different HUD elements and their understanding of the information displayed, as well as how they used the elements in different scenarios. Testing usability with a low-fidelity prototype can be challenging, due to the difficulties users might have to form an opinion on how to interact with and understand the prototype. Therefore, it can be a good idea to test the actual conceptual idea with a low-fidelity prototype and then continue with developing a medium-fidelity prototype for further testing (Engelberg & Seffah, 2002).
With paper prototypes, a designer can throughout the design process, test ideas as well as the usability and functionality of the intended product. It enables the designer to start testing and find possible issues at an early stage in the design process (Bansemir et al., 2014 in Marcus, (Ed.), 2014).
5.8.2 Medium-fidelity prototyping
According to
Engelberg & Seffah
, (2002), a medium-fidelity prototype includes more detailed information and content than fidelity prototypes. Where a low-fidelity prototype might not contain more than a small subset of features, a medium-fidelity prototype contains a wider range of features, but in a schematic or approximate form. This level of prototyping was chosen during the thesis project to make usability tests on the target group possible.The outcome when usability testing with a medium-fidelity prototype is much more rewarding than testing with a low-fidelity prototype, this because of the user behaves and interacts more naturally with the medium-fidelity prototype. Furthermore, a very beneficial attribute of medium-fidelity prototypes is that they have sufficient detail for usability testing, and has a much lower cost and time to produce as compared to high-fidelity prototypes (ibid).
Developing a medium-fidelity prototype was chosen in order to gather knowledge about how users interacted with the prototype, and if they understood the various elements on the HUD. The goal was to gain a deeper insight into possible problems with the designs and how the users want to interact with the product (Cooper et al., 2014). While usability testing the medium-fidelity prototype, a better insight of the importance of depth and placement of the various heads-up display elements was achieved.
5.9 Usability testing
According to Cooper et al., (2014), usability testing is a collection of techniques used to measure how a user interacts with a product. Furthermore, they say that a benefit of using usability testing is that the designer gets a better insight into a product's usability, and how the user interacts with the product. This reveals areas where the user might have problems understanding the product (ibid). However, usability testing requires a fairly complete and coherent design to test against. Consequently, this type of testing should be used late in the design cycle, when there is a prototype to test against, with the goal to validate the design decisions in the said prototype (ibid).
5.9.1 Usability testing in Virtual Reality
During the course of this thesis, some problems finding relevant previous research about user testing vehicular interfaces in Virtual Reality, and especially HUD interfaces were encountered. Because of this, general user interface testing in Virtual Reality was researched in order to base the user tests on existing knowledge. One of the difficulties with user testing in VR was getting a perception of how the user experienced the different HUD elements. In fact, the goal of the VR user tests was to gain knowledge about how the user would naturally act with the HUD in a test environment as close to real life as possible. One of the major features the tests were designed to cover, was the glanceability relevancy described in 3.3, i.e. the HUDs way of displaying elements based on relevance. According to Helft, (2017), VR user testing can be difficult because the designer is completely isolated from the user, i.e. the user can’t see or hear the designer and the designer can’t see what the user sees, as opposed to ordinary user tests. Isolation was not an issue during my user tests since the users could hear and interact with me during the tests in the driving simulator. Everything the users saw was displayed on a separate screen that could be observed, and as such the tests could be conducted in the same way as the usability tests that were conducted in the real-life car.
5.10 Ethics
When conducting research, it is crucial to consider ethics and guidelines within this area. Ethical considerations while researching are an important matter, this to aim to promote the research for knowledge and to have a responsibility for the safety of the participants (Swedish research council, 2017).
A significant issue to keep in mind when doing my research was that I have a responsibility to the people who take part in the research. Early in the process, it became obvious that it would be a safety issue to conduct the research in a moving vehicle, which is why conducting the research in a VR simulator was chosen. However, this approach also carries some level of a safety issue for the participants, such as motion sickness. Because of this, the participants were informed about the possible risks with VR, and that if they felt any discomfort, or if they did not want to continue anymore, they were free to stop at any time. Everyone who was involved in the research gave their explicit permission and signed a document informing them about what being researched and that they were anonymous. The users were also informed that they could choose to abort the tests at any time and asked for their
permission to quote them in this paper, and for their permission to publish possible photos.
6 Design process
In this chapter, the Design process that has been used when writing this thesis will be described (see figure 4). It will go through the process of creating prototypes for the observational tests, as well as the observational tests themselves. In this process, work was done on connecting the research findings and filling in the missing gaps, by using the methods described in section 5.
Figure 4 An overview of the design process inspired by IDEO.org, (2015)
6.1 Inspiration phase
The inspiration phase contributed to a better understanding of the design problem and whom to design for, by gathering relevant information about the topic. The gathering of information was done by utilising various design methods, i.e. interview with Uniti, framing the design problem, and literature- and user research.
6.1.1 Interview with Uniti
At the start of the project, an interview with Uniti was held, with the purpose to cooperatively define their agenda and what their hopes and expectations were on the project. The interview was held in the form of a discussion since the goal was to
increase knowledge about Uniti as a company, and what they thought about their HUD. The expectation was to gain insight into what they thought was most important to focus on when trying to answer the design question, and where they had gaps in the research they had conducted on their own. One of the major insight from the interviews was that the Uniti HUD had the main focus on AR, giving their HUD elements a sense of depth. Therefore, the prototype had to replicate this in order to produce results about glanceability that Uniti could benefit from. The knowledge gained from this interview served as the starting point for the literature research.
6.1.2 Literature research
As mentioned in section 5.3, literature studies were conducted in order to build a base knowledge about the field that this thesis aims to investigate. Furthermore, acting on insights from the interview with Uniti, another goal was to gain knowledge about VR and user testing in VR, to be able to produce a prototype using VR technologies. A good amount of literature that described the possibilities and problems with HUDs was found, but there were issues finding previous work about conducting usability tests in VR, which resulted in having to rely on previous knowledge about how to conduct the tests. In order to get satisfactory results, several trial runs were conducted before the actual usability tests and most of the test setup was based on knowledge about usability testing outside of VR.
6.1.3 Framing the design challenge
In order to understand how to develop the design further, it is critical to frame the design challenge properly (IDEO.org, 2015). To properly frame the design challenge, knowledge gained from the literature research was used in order to build a clear idea of the challenge, and from which viewpoint the thesis should look at it. When doing this, an attempt was made to formulate different ideas about how to tackle the design challenge, while avoiding thinking to narrow or too broad (IDEO.org, 2015). By defining the design challenge, the topic could be defined more clearly. The started off by looking at the design challenge as more of a safety problem, but as knowledge of the field grew, the focus was instead shifted onto increasing knowledge about glanceability HUDs. When framing the design challenge, attempts were also made to define what the design problem was, as well as possible solutions to this problem. When defining the design challenge, several limitations were found with the design process. One of the significant limitations was user testing a HUD with the size and
functions of the Uniti HUD. As a consequence of the Uniti HUD covering a large part of the windshield, as well as working with depth as a major part of their design, user testing with low-fidelity prototypes proved to be insufficient. To avoid this limitation, it was decided to conduct the usability tests in VR, which in turn proved to be a limitation, due to the difficulty of getting a natural interaction between the user and the HUD. These difficulties stemmed from the fact that the HUD elements had to be rendered in a lower resolution than what they would have rendered in on a real HUD, which in turn made some elements less glanceable.
6.1.4 User research
As a consequence of using a human-centred approach, it was crucial that it was understood at an early stage of the project who the target audience was (IDEO.org, 2015). With the help of Uniti, a target group this process should be aimed at was defined. With this research, the goal was to get an insight into the user's needs and motivations, what they want, and what they want to accomplish. According to Cooper et al., (2014) user research is a critical tool to apply when designing. In order to understand my users better, it was planned to conduct user interviews and observations, as a way to get insight into the user’s motivations and needs. Through conducting user research, the goal was to gain a deeper knowledge about how the design problem could be approached, and with the help of interviews and user observations gain a deeper understanding of the design problem.
6.1.5 Insights
During the inspiration phase, a deeper understanding of the field and the design possibilities of the design problem was gained. This understanding led to a need to gain further insight into how the users want to interact with a HUD, what the user’s needs are when interacting with a HUD from a glanceable perspective. Furthermore, a deeper understanding of the user was gained, which can help in the process going forward. The literature research, in particular, showed that there could be risks with users getting distracted during driving (Sun et al., 2015), and accordingly this was kept in mind when designing the low-fidelity prototype and the medium-fidelity prototype. The knowledge gained from the user research, literature research, and from framing the design problem, provided insight into design possibilities and limitations which in turn became the basis of the design process.
Because of the focus on user-centred design (IDEO.org 2015), there was a need to get an even more in-depth understanding of the users of the product. For this reason, conducting field studies during the ideation phase was done in order to collect information from real users in a practical way.
6.2 Ideation phase
The ideation phase helped to define design solutions for the design problem further. During the ideation phase design methods such as sketching, user interviews, and low-fidelity prototyping were used.
When drawing patterns from the inspiration phase mentioned in section 6.1, a deeper understanding of the field and the design possibilities of the design problem was gained. With this deeper understanding, with the help of low-fidelity prototypes, it was set out to discover how users wish to interact with a HUD.
6.2.1 Sketching
As mention in section 5.7, sketches help the designer test and explore different concepts. In order to start user testing as early as possible, sketching was started on early low-fidelity sketches at the start of the ideation process (see figure 5).
Figure 5: Navigational elements
As mentioned in section 3.3 by Matthews et al., (2006), the position of the object has a considerable influence on whether an object is glanceable or not. For this reason, sketches placing elements at different positions in the HUD were created (see figure 6). This sketching was done in order to explore how users interacted with information depending on the placement of the element.
Sketches were used to illustrate the design concept and to visualise ideas. Sketching helped explore the design concept, and as a result, the field this thesis is aimed at could be explored, learned about, and a deeper understanding could be gained.
6.2.2 Low-fidelity Prototype
Figure 7: Sketched HUD elements
By using this knowledge, two different prototypes were produced. The first one created was a low-fidelity prototype consisting of sketched HUD elements on paper (see fig 7), which was then put up on the windshield of the interviewee’s car (see fig 8).
With this prototype, the goal was to examine what Matthews et al., (2006) states about how different factors can have an impact on how the user interpret the information they are presented within the different elements, and how that can affect glanceability. Through this low-fidelity usability test, key insights were gained which could be brought into the next iteration of the usability tests.
Figure 8: Elements of user's windshield
One user mentioned that they considered it to be important that the HUD did not present too much information to the user. Furthermore, they said that:
“It should be as clean as possible, for example only show the gas meter and the speedometer, and maybe a warning triangle underneath. Then there’s not a too much covering your field of
view.”
The initial prototype was mainly used in order to test the concept of the HUD and to explore how users wanted to interact with the elements. As well as a tool to gain insight into which elements were glanceable, and which elements demanded too much attention from the users.
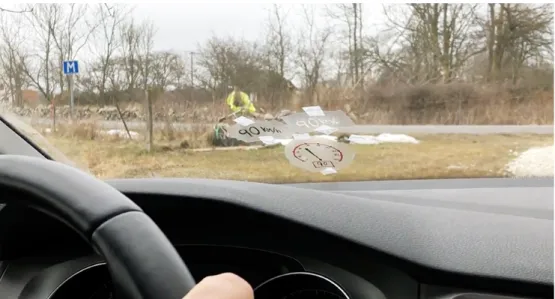
Acting on insights from the literature research, prototypes were sketched from a transparent material that allowed for testing different variations in colourised elements (see fig. 9). This sketching was done in order to gain an insight into how that might affect the driver, and if different colours could give different amounts of glanceability as proposed by Matthews et al. (2006).
Furthermore, transparent sketches were used in order to gain make the elements look a bit more realistic, allowing the users to get a better understanding of how to interact with the HUD. The goal of the prototypes was to get a deeper understanding of how the users interacted with the HUD, and how to design for glanceability, allowing the user to absorb the information presented to them without the HUD demanding too much attention. Another insight that was to gain from having elements with different colours was how the users experienced the colour coding, e.g. if colourising the elements had a negative or positive effect on the driver. This insight could, in turn, be relevant when displaying traffic information on the HUD (Matthews et al., 2006).
6.2.3 User observation and User Interviews
User observations were conducted of the low-fidelity prototype while in the user’s car, as to gain a better insight into their behaviour and mindset. In order to give the users a better understanding of how they could interact with the HUD, different scenarios were created (see Appendix A). The scenarios were then repeated with different HUD setups, where different colours, sizes, and placements were used, which Matthews et al., (2006) suggest are factors that can affect glanceability. The interviews were conducted simultaneously with the user observations, allowing for tailored interview questions to how the user's acted during the observation, as well as posing follow up questions to their thoughts (Goodman et al., 2012). During the interviews, the hope was to collect quick preliminary feedback from users, in order to use this feedback when designing the following medium-fidelity tests. The central insight to gain, was if a user could understand the information displayed on Figure 9: Semi-Transparent colourised HUD elements
the windshield in a glanceable approach, and to get a better understanding of how to design for a glanceable design.
As a consequence of this, the layout of the interviews was structured like conversations, and as a result, the users produced much valuable information about how they wanted to interact with the head-up display, as well as a good overview over their needs. Apart from this, knowledge was gained about possible design solutions, possible problems that can occur when using a HUD, as well as the importance of how the HUD elements are placed (Oh et al., 2016), in order to contribute to increased glanceability (Sall et al., 2017). Making the users think out loud allowed access to unfiltered thoughts at the moment, which was beneficial in order to gain knowledge about the glanceability in the prototypes, as well as allowing the interviewees to share their immediate thoughts and feelings.
During every iteration, the results were analysed in order to help reveal insights that could redefine the problem, spark new ideas, and learn more about the users. According to Löwgren and Stolterman (2004), there are several ways to use the results from the interview and observation session, and a standard way to do it is by sorting the answers into categories that seem appropriate. As mentioned in 5.2.2 I, therefore, split the results into four categories, inspired by (Nessler, 2017): needs, opportunities, observation, and problems.
6.2.4 Insights
As mentioned, the results of the interviews were divided into four categories, i.e. observation, needs, problems, and possibilities, (see fig. 10), in order to gain a deeper understanding for the result and to be able to find and map possible connections between the different test subject’s answers. As a result of this, several conclusions could be made, and new knowledge could be gained about how the users interacted with the HUD.
Figure 9: Grouped interview comments
Another issue the users raised was the need for auditory feedback, to offload the information displayed on the HUD. One user said:
“Maybe it should even say something to me, the navigational system should say that in 200 meters turn that way.”
Furthermore, they mentioned how important it is to show clear symbols of what is happening. As an example of this case, one of the example elements were an element that shows an alert if there is a traffic jam on the road ahead, by displaying a warning triangle (see fig 7). This element proved to be confusing for the driver because they could not by glancing at the element understand what it meant. Only after focusing on the element they realised that it was a traffic jam and not a warning about a problem with the vehicle. Since these tests were done from a user perspective on how to increase the glanceability in HUDs, this was a good result, due to it providing
increased knowledge and insight into the needs and behaviours of the users. Which in turn gave an insight into how to continue the work on getting a better understanding of the design problem, and in extension how to provide a solution. During the usability tests, one user mentioned that it was important for them to have a distinct and straightforward interface, with the possibility to customise the HUD.
“I think it is very individual with how you feel about colours, and maybe you should be able to choose for yourself.”
However, as mentioned in 3.1 by Oh et al., (2016), it is important to not overload the HUD with elements in order to keep it glanceable. Because of this, it is important not to let the users display too many elements at the same time. Therefore, limiting the number of elements and amount of information shown to the bare minimum, in addition to letting the users themselves have input on which elements should be shown, and when they should be shown, was shown to be a general need for the users. A major issue for users was if too much information was being displayed in the HUD during stressful situations, e.g. when being presented with traffic jam information when in an already stressful situation. In these cases, the elements being presented contain too much information to be absorbed by a glance. Furthermore, the elements should not be too large or placed in less than ideal areas of the HUD, since that creates a risk of them obscuring the user's view of the traffic, e.g. pedestrians or other vehicles.
Furthermore, it was shown to be essential for the users to be presented with relevant symbols when something occurred on the road, e.g. when there was a warning for a traffic jam. Users tended to associate the warning triangle shown when indicating a traffic jam (as seen in fig 7) with a problem with the vehicle. For this reason, the HUD should show a more relevant and clear symbol, as to more clearly depict what it is warning the user about, as to avoid confusion. Also, users expressed a need to have enough information to make informed decisions on how to proceed when the navigational elements were shown, e.g. whether a possible traffic jam is actually on the user’s route, and therefore if it would be relevant to take any proposed routes. In general, the users preferred when the HUD elements were placed directly above where they would expect the corresponding dashboard instruments to be placed. Apart from this, I received shared opinions on whether to show a battery indicator or a range indicator for showing the battery level and battery range of the car. One user
thought that it was easier to understand the range meter while driving since it showed an approximation of how much of the total range they had already driven, but on the other hand, other users found it hard to understand and preferred the battery indicator. However, an issue that arose during usability testing was a difficulty to get the users to focus on the glanceability of the elements. Instead, they generally focused on the placement and looks of the elements. As a consequence of this, gaining insight into glanceability was a challenge.
6.3 Implementation phase
During this thesis, the implementation phase included creating a medium-fidelity VR prototype, which was used to conduct usability tests on a HUD.
6.3.1 VR-prototype
Figure 10: The VR car simulator
The medium-fidelity prototype was developed by building upon my knowledge from the user tests run on the Low-fidelity prototype, in order to further prove the patterns observed in the results from previous user tests. Sketches were created of the different HUD elements, in various sizes and colours, as mentioned in 5.2.2. (Sun et al., 2015). These were then placed into a Virtual Reality car simulator (see fig. 11) by using the game development engine Unity, in a way that replicated how an AR HUD works.
The reasoning behind the choice to develop the medium-fidelity prototype in a VR car simulator was to enhance the HUD experience by replicating an AR-HUD experience. Furthermore, another goal was to get a grasp of how to design for an AR-HUD and making the elements on the AR-HUD glanceable (Sun et al., 2015).
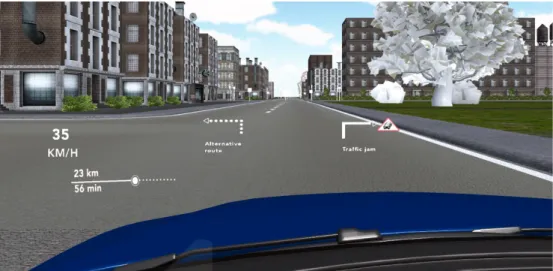
Figure 11: Screenshot from the VR prototype
The VR prototype was made with the help of a group of thesis workers at Jayway, who were building a driver’s education-simulator. HUD elements were created, which were then placed as textures in front of the car in order to emulate what an AR-HUD would look like (see figure 12).
6.3.2 Usability testing in VR
One of the advantages of these tests over the Low Fidelity user observations, was that in a VR environment a sense of depth in the HUD elements could be created, that could not be created in the Low Fidelity tests. The sense of depth is important in these tests, since the types of HUDs that are used in vehicles are often designed to emulate that the information is projected onto a space in front of the user. In the case of Uniti's HUD, this distance is about 15 meters. Apart from this, the testers could use a HUD with functionality, i.e. the speedometer showing the actual speed of the vehicle, while driving, which was naturally not possible during the Low Fidelity tests. While the testers were using the simulator, their view was observed on a separate screen, and they were asked questions about their experience, making them think aloud (Goodman et al., 2012), and describe what they were doing. This experience contributed to the interviews that followed and allowed for more detailed answers as a result of the users being asked to expand on their thoughts.