Postadress: Besöksadress: Telefon:
Box 1026 Gjuterigatan 5 036-10 10 00 (vx)
551 11 Jönköping
NEW GENERATION IRONING BOARD FOR
COMPACT
Johanna Lang
MASTERTHESIS
2016
Master in Product Development with a specialization
INDUSTRIAL DESIGN
Postadress: Besöksadress: Telefon:
Box 1026 Gjuterigatan 5 036-10 10 00 (vx)
551 11 Jönköping
NYA GENERATIONENS STRYKBRÄDA FÖR
COMPACT LIVING
Johanna Lang
This degree project is performed at the School of Engineering in Jönköping in the subject field Industrial Design. The project is a result of the master program Industrial Design. The writers are responsible of the result, conclusions and reflections.
Tutor:Thomas Arnell, Lars Eriksson
Extent: 30 points (D-level)
Date: 11/07/2016 Filing number:
Abstract
ii
Abstract
This report describes the product development thesis that was conducted as an end project in the Master programme Industrial Design at Jönköping University.
The thesis has been about developing, designing and building an ironing board for compact living. The name for the product that has been developed is UNI and it is a multifunctional ironing board which can either be mounted on the wall or hanged over the door. When the ironing board is not in used, it can be folded up and will then act as a mirror. When the ironing board is folded down, parts of the mirrors frame will be folded down and act like a supporting leg for the ironing board. On the inside is shelves and hooks mounted. Here can the owner store small things like keys and jewelleries.
To get the best final result, have the design process Bootcamp Bootleg been used. This design process is divided in to five different stages where different methods are used to help with moving the project forward.
The CAD-programme SolidWorks 2014 was used to create the CAD-models and the renderings where made in the rendering programme Keyshot 5.
The physical model which was made during this thesis, was made in a scale of 1:1. The materials that were used for the model were hard foam, metal, wood, acrylic mirror, wadding and fabric.
This thesis has been performed in collaboration with the company Rörets Industrier AB located in Jönköping, Sweden.
iii
Sammanfattning
Denna rapport beskriver examensarbete inom produktutveckling som gjordes som det slutliga projektet på Master programmet Industrial Design på Jönköpings universitet. Detta examensarbete har handlat om att utveckla, formge och bygga en strykbräda för compact living. Namnet på den produkt som blivit utvecklad är UNI och det är en multifunktionell strykbräda som kan monteras på en vägg eller hängas över en dörr. När strykbrädan inte används, kan den fällas upp och användas som en spegel. När
strykbrädan är nedfälld kommer delar av spegels ram att fällas ner och fungera som ett stöttande ben. På insidan finns de hyllor och krokar monterat. Här kan ägaren förvara små föremål som nycklar eller smycken.
För att få ett så bra resultat som möjligt, har design processen Bootcamp Bootleg använts. Denna process är uppdelad i fem olika steg där man använder olika metoder för att föra projektet framåt.
CAD-programmet SolidWorks 2014 har använts för att skapa CAD-modellerna och renderingarna har gjorts i renderingsprogrammet Keyshot 5.
Den fysiska modellen som gjorts under examensarbete, har gjorts i skala 1:1. Materialen som använts i vid bygget av modellen var hårt skum, metall, trä, spegelglas och tyg.
Detta examensarbete har gjorts i samarbete med företaget Rörets Industrier AB lokaliserat i Jönköping, Sverige
Table of Contents iv
Table of Contents
Abstract ... ii Sammanfattning ... iii Table of Contents ... iv Acknowledgements ... xiv Abbreviations ... xv Programmes ... xv 1 Introduction ... 6 1.1 Background ... 6 1.2 Objectives ... 6 1.2.1 Research Questions ... 6 1.3 Company information ... 7 1.4 Delimitations ... 7 1.5 Disposition ... 7 1.5.1 Introduction ... 7 1.5.2 Theoretical Background ... 7 1.5.3 Method ... 81.5.4 Approach and Implementation ... 8
1.5.5 Result ... 8
1.5.6 Conclusion and discussion... 8
1.5.7 Attachment ... 8
2 Theoretical Background ... 9
2.1 Overcrowded household ... 9
2.2 Design Science ... 10
2.2.1 Science in design ... 10
2.2.2 Future of design science ... 10
2.3 Approaches when designing ... 11
2.3.1 User-based approach ... 11 2.3.2 Designer-based approach ... 11 2.3.3 Research-based approach ... 11 2.3.4 Theory-based approach ... 11 2.4 Bootcamp Bootleg ... 12 2.4.1 Empathize ... 12
v 2.4.2 Define ... 13 2.4.3 Ideate ... 13 2.4.4 Prototype ... 14 2.4.5 Test ... 15 2.5 Double Diamond ... 16 2.5.1 Discover ... 16 2.5.2 Define ... 16 2.5.3 Develop ... 17 2.5.4 Deliver ... 17 2.6 Appearance ... 18 2.7 Human Factors ... 19 3 Method ... 22 3.1 Design Brief... 22 3.2 PERT-Chart ... 22
3.3 WBS – Work Breakdown Structure ... 22
3.4 Gantt-Schedule ... 22
3.5 Stakeholder Analysis ... 23
3.6 Questionnaire Study ... 23
3.6.1 Observation: Structured ... 23
3.6.2 Interview: Conjoint Analysis ... 23
3.6.3 Interview: Close Ended Questions ... 23
3.7 Brainstorming ... 23 3.8 Target group ... 24 3.9 Personas ... 24 3.10 Functional analysis ... 25 3.11 Image Board ... 26 3.12 Sketching ... 26 3.13 Design Analysis ... 26 3.14 CAD - modelling ... 26 3.15 Rendering ... 26 3.16 Physical Model ... 27
3.16.1 Design model and Functional Model ... 27
Table of Contents vi 4.1 Empathizing ... 28 4.1.1 Design brief ... 28 4.1.2 Planning ... 28 4.1.3 Questionnaire Study ... 29 4.1.4 Design analysis ... 30 4.2 Define ... 32 4.2.1 Stakeholder Analysis ... 32 4.2.2 Target group ... 33 4.2.3 Image board ... 33 4.2.4 Persona ... 34 4.2.5 Functional analysis ... 36 4.3 Ideate ... 36 4.3.1 Sketching ... 36
4.3.2 More sketching and CAD-models ... 39
4.3.3 Final CAD- model and Renderings ... 39
4.3.4 Name and Logo ... 40
4.4 Prototype ... 41
4.4.1 Physical Model... 41
4.4.2 Frame ... 42
4.4.3 Legs ... 42
4.4.4 The board ... 43
4.4.5 Hangers for the door ... 43
4.4.6 Steps for painting ... 44
5 Result ... 45
5.1 Final Concept ... 45
5.2 CAD – model ... 45
5.3 Renderings ... 46
5.3.1 Main components ... 46
5.3.2 Ironing board folded up ... 47
5.3.3 Ironing board folded down ... 48
5.3.4 Inside of the ironing board ... 49
5.3.5 Cover ... 49
vii
5.3.7 Different styles ... 51
5.4 Main Dimensions ... 53
5.5 Mounting the ironing board ... 54
5.6 Physical Model ... 55
5.6.1 Frame ... 55
5.6.2 Board ... 55
5.6.3 Locking the board in place ... 56
5.6.4 Back of the model ... 57
5.6.5 Inside ... 57
5.6.6 Hinges ... 58
5.6.7 Hangers for the door ... 59
5.6.8 Legs ... 60
5.6.9 Straps for the legs... 60
5.6.10 Style ... 61
5.6.11 Final model ... 61
6 Conclusion and discussion ... 62
6.1 Design process ... 62
6.2 Design brief and direction ... 63
6.3 Planning ... 63
6.4 Design process ... 64
6.5 Questionnaire study ... 64
6.6 Design analysis - Stockholm and London ... 65
6.7 Stakeholder and functional analysis ... 66
6.8 Image board and Scandinavian style ... 66
6.9 Target group and Personas... 66
6.10 Sketching ... 67
6.11 Final design ... 67
6.11.1 Styles ... 67
6.11.2 Mounted on the wall ... 67
6.11.3 Hanged over a door ... 68
6.11.4 Hooks ... 68
6.11.5 Cover... 68
Table of Contents viii 6.13 Physical model ... 69 6.13.1 Frame ... 69 6.13.2 Board... 69 6.13.3 Mirror ... 69 6.13.4 Hinges ... 70 6.13.5 Legs ... 70
6.13.6 Straps for the legs ... 70
7 References ... 71 8 Attachments ... 73 8.1 Attachment 1 – PERT-chart ... 74 8.2 Attachment 2 – WBS-chart ... 75 8.3 Attachment 3 – Gantt-schedule ... 76 8.4 Attachment 4 – Stakeholder ... 81
8.5 Attachment 5 – Questionnaire study ... 82
8.5.1 Questionnaire ... 82
8.5.2 Answers ... 84
8.6 Attachment 6 – Trend analysis ... 91
8.6.1 Furniture and light fair, Stockholm ... 91
8.6.2 Skandium, London ... 92
8.7 Attachment 7 – Image board ... 93
8.8 Attachment 8 – Personas... 94
8.8.1 Felix and Amanda ... 94
8.8.2 Henrik Lundberg ... 95
8.8.3 Emelie Andersson ... 96
8.9 Attachment 9 – Functional analysis ... 97
8.10 Attachment 10 – Sketches ... 99
8.11 Attachment 11 – Renderings of the four concepts ... 105
8.12 Attachment 12 – Renderings of the final concept ... 109
8.12.1 Main components ... 109
8.12.2 Ironing board folded up ... 110
8.12.3 Ironing board folded down ... 112
8.12.4 Inside the Ironing board ... 113
ix
8.12.6 Hanging over a door ... 115
8.13 Attachment 13 – Different styles ... 120
8.14 Attachment 14 – Physical model ... 124
Table of Figures Figure 1 - Showing the different steps in the Bootcamp Bootleg design process [6] ... 12
Figure 2 - Showing the first step in the Bootcamp Bootleg design process [8] ... 12
Figure 3 - Showing the second step in the Bootcamp Bootleg design process [8] ... 13
Figure 4 - Showing the third step in the Bootcamp Bootleg design process [8] ... 13
Figure 5 - Showing the fourth step in the Bootcamp Bootleg design process [8] ... 14
Figure 6 - Showing the fifth step in the Bootcamp Bootleg design process [8] ... 15
Figure 7 - Showing the design process Double Diamond [7] ... 16
Figure 8 - Showing the first stage in the double diamond design process [9] ... 16
Figure 9 - Showing the second stage in the double diamond design process [9] ... 17
Figure 10 - Showing the third stage in the double diamond design process [9] ... 17
Figure 11 - Showing the fourth stage in the double diamond design process [9] ... 17
Figure 12 - Showing the height when standing straight up [10] ... 19
Figure 13 - Showing the height from the feet to the eyes when standing straight up [10] 20 Figure 14 - Showing the elbow height, to bony point with straight arm [10] ... 20
Figure 15 - Showing recommended height of work surface for different types of work [12] ... 21
Figure 16 - Showing target group and market ... 24
Figure 17 - Showing the different ironing board which were tested during the first section of the questionnaire study... 29
Figure 18 - Showing the design analysis that where made based on Furniture and Light Fair in Stockholm... 30
Figure 19 - Showing the design analysis that where made based on the visit to "Skandium" in London ... 31
Figure 20 - Showing the a visual image of the Stakeholder Analysis that was created ... 32
Figure 21 - Showing the image board that was made to represent the target group ... 33
Figure 22 - Showing image board that was made to represent the competitors’ products 34 Figure 23 - Showing a summary of the Felix and Amanda persona ... 34
Figure 24 - Showing a summary of the Henrik Lundberg persona ... 35
Figure 25 - Showing a summary of the Emelie Andersson persona ... 35
Figure 26 - Showing Concept 1 ... 37
Figure 27 - Showing Concept 2 ... 37
Figure 28 - Showing Concept 3 ... 38
Figure 29 - Showing Concept 4 ... 38
Figure 30 - Showing the logo that was created for the ironing board ... 40
Figure 31- Showing the components that have been milled ... 41
Figure 32- Showing image of mounting the top of the frame (Part 1) ... 42
Table of Contents
x
Figure 34 – Showing the step of mounting the top with the frame legs ... 42
Figure 35 - Showing the legs with the bent metal rails mounted ... 42
Figure 36 - Showing the wood skeleton with a mounted mesh net on ... 43
Figure 37 - Showing the hangers for the door ... 44
Figure 38 - Showing the frame and shelves covered in several layers of filler ... 44
Figure 39 - Showing the front of the CAD-model... 46
Figure 40 - Showing the back of the CAD-model ... 46
Figure 41 - Showing the ironing boards main components ... 46
Figure 42 - Showing the front of the ironing board when it is folded up ... 47
Figure 43 - Showing the back of the ironing board when it is folded up ... 47
Figure 44 - Showing the top of the ironing board when it is folded up... 47
Figure 45 - Showing the an enlarged image of the leather strap hooked on rifle button the front of the ironing board when it is folded up ... 47
Figure 46 - Showing the bottom of the ironing board when it is folded up ... 47
Figure 47 - Showing the front when the ironing board is folded down ... 48
Figure 48 - Showing the ironing board from the side when it is folded down ... 48
Figure 49 - Showing a zoom view of how the ironing board looks folded down without the frame ... 48
Figure 50 - Showing the metal hook in side view... 49
Figure 51 - Showing the metal hook in front view ... 49
Figure 52 - Showing the shelves, hangers and hooks when the frame is removed ... 49
Figure 53 - Showing the pattern chosen for the ironing board ... 49
Figure 54 - Showing the front with the door hangers are mounted ... 50
Figure 55 - Showing a perspective view of the ironing board when the door hangers are mounted ... 50
Figure 56 - Showing the door hanger from the side ... 50
Figure 57 - Showing the door hanger from the front ... 50
Figure 58 - Showing an exploded view of the door hanger ... 50
Figure 59 - Showing the ironing board folded up and hanging over a door ... 51
Figure 60 - Showing the ironing board folded down and hanging over a door ... 51
Figure 61 - Showing the black concept with a mirror ... 51
Figure 62 - Showing black concept with a black board ... 52
Figure 63 - Showing the white concept with a mirror ... 52
Figure 64 - Showing the white concept a black board ... 52
Figure 65 - Showing the frame of the physical model ... 55
Figure 66 - Showing the leather strap mounted with rivets ... 55
Figure 67 - Showing the board with the fabric side up ... 56
Figure 68 - Showing the board with the mirror side up ... 56
Figure 69 - Showing an enlarged view of top piece, leather strap and the rifle button ... 56
Figure 70 - Showing the push lock inactivated without the board ... 57
Figure 71 - Showing the push lock activated without the board ... 57
Figure 72 - Showing the top of the back of the ironing board on the inside ... 57
Figure 73 - Showing the bottom of the back of the ironing board on the inside ... 57
xi
Figure 75 - Showing the hinges which fasten the legs to the frame which holds the mirror
... 58
Figure 76 - Showing the hinges which mounts the ironing board to the holder ... 59
Figure 77 -Showing the door hangers in a front view ... 59
Figure 78 - Showing the door hangers in a side view ... 59
Figure 79 - Showing the supporting legs for the ironing board when the board is in use 60 Figure 80 - Showing the supporting legs for the ironing board when the board is not in use ... 60
Figure 81 - Showing the straps which are mounted to the leg and frame ... 60
Figure 82 - Showing some part painted in a black semi-gloss spray paint ... 61
Figure 83 - Showing one of the hooks painted in a silver paint ... 61
Figure 84 - Showing the finished physical model when folded up and mounted on a wall ... 61
Figure 85 - Showing the finish physical model when mounted on a wall ... 61
Figure 86 - Showing the different stages of the design process Bootcamp Bootleg [6] .... 62
Figure 87 - Showing the double diamond design process ... 62
Figure 88 - Showing the logo for the product ... 69
Figure 89 - Showing the PERT-chart that was created for this thesis ... 74
Figure 90 - Showing the WBS - chart created for this thesis ... 75
Figure 91 - Showing Gantt-schedule part 1 of 5 ... 76
Figure 92 - Showing Gantt-schedule part 2 of 5 ... 77
Figure 93 - Showing Gantt-schedule part 3 of 5 ... 78
Figure 94 - Showing Gantt-schedule part 4 of 5 ... 79
Figure 95 - Showing Gantt-schedule part 5 of 5 ... 80
Figure 96 - Larger image of the stakeholder analysis ... 81
Figure 97 - Graph showing the gender division on the people who took part in the questionnaire study ... 84
Figure 98 - Graph showing the age division on the people who took part in the questionnaire study ... 84
Figure 99 - Graph showing answer for Question 1 in the questionnaire study ... 84
Figure 100 - Graph showing answer for Question 2 in the questionnaire study ... 85
Figure 101 - Graph showing answer for Question 3 in the questionnaire study ... 85
Figure 102 - Graph showing answer for Question 4 in the questionnaire study ... 85
Figure 103 - Graph showing answer for Question 5 in the questionnaire study ... 86
Figure 104 - Graph showing answer for Question 6 in the questionnaire study ... 86
Figure 105 - Graph showing answer for Question 7 in the questionnaire study ... 86
Figure 106 - Graph showing answer for Question 8 in the questionnaire study ... 87
Figure 107 - Graph showing answer for Question 9 in the questionnaire study ... 87
Figure 108 - Graph showing answer for Question 10 in the questionnaire study ... 87
Figure 109 - Graph showing answer for Question 11 in the questionnaire study ... 88
Figure 110 - Graph showing answer for Question 12 in the questionnaire study ... 88
Figure 111 - Graph showing answer for Question 13 in the questionnaire study ... 88
Figure 112 - Graph showing answer for Question 14 in the questionnaire study ... 89
Table of Contents
xii
Figure 114 - Graph showing answer for Question 16 in the questionnaire study ... 89
Figure 115 - Graph showing answer for Question 17 in the questionnaire study ... 90
Figure 116 - Showing a larger image of the trend board from the Furniture and light fair in Stockholm ... 91
Figure 117- Showing a larger image of the trend board from the store Skandium in London ... 92
Figure 118 - Showing a larger image of the image board created for compact living ... 93
Figure 119 - Showing detailed information about the persona Felix and Amanda ... 94
Figure 120 - Showing detailed information about the persona Henrik ... 95
Figure 121 - Showing detailed information about the persona Emelie ... 96
Figure 122 - Showing sketches of iron holders ... 99
Figure 123 - Showing sketches of ironing boards for compact living (1 of 4) ... 100
Figure 124 - Showing sketches of ironing board for compact living (2 of 4) ... 101
Figure 125 - Showing sketches of ironing boards for compact living (3 of 4) ... 102
Figure 126 - Showing sketches of ironing boards for compact living (4 of 4) ... 103
Figure 127 - Showing hooks and hangers for the interior of the ironing board ... 104
Figure 128 - Showing a larger image of Concept 1 ... 105
Figure 129- Showing a larger image of Concept 2 ... 106
Figure 130 - Showing a larger image of Concept 3 ... 107
Figure 131 - Showing a larger image of Concept 1 ... 108
Figure 132 - Showing a larger image of the main components of the ironing board ... 109
Figure 133 - Showing larger images of the ironing board when it is folded up ... 110
Figure 134 – Showing a larger image of the leather strap on the front of the ironing board when it is folded up ... 111
Figure 135 - Showing a larger image of the top of the ironing board, when it is folded up ... 111
Figure 136 - Showing a larger image of bottom of the ironing board, when it is folded up ... 111
Figure 137 - Showing larger images of the ironing board when it is folded down ... 112
Figure 138 - Showing the inside decor of the product ... 113
Figure 139 - Showing the inside of the ironing board when the frame is removed ... 113
Figure 140 - Showing a larger image of how the ironing board would look like mounted on a wall, when it is folded up ... 114
Figure 141 - Showing a larger image of how the ironing board would look like mounted on a wall, when it is folded down ... 114
Figure 142 - Showing larger images of how the ironing board would look when the door hangers are mounted on ... 115
Figure 143 - Showing larger images of the door hanger from different views ... 116
Figure 144 - Showing a larger image of the door hanger in an exploded view ... 117
Figure 145- Showing a larger image of how the ironing board would look like hanging over a door, when it is folded up ... 118
Figure 146 - Showing a larger image of how the ironing board would look like hanging over a door, when it is folded down ... 118
xiii
Figure 147 - Showing a larger image of how the ironing board would look like in a room,
when hanging over a door and it is folded up ... 119
Figure 148 - Showing a larger image of how the ironing board would look like in a room, when hanging over a door and it is folded down ... 119
Figure 149 - Showing a larger image of the black concept with a mirror ... 120
Figure 150 - Showing a larger image of the with a black board ... 121
Figure 151 - Showing a larger image of the white concept with a mirror ... 122
Figure 152 - Showing a larger image of the white concept with a black board ... 123
Figure 153 - Showing a larger image of the finished physical model when it is folded up and mounted on a wall ... 124
Figure 154 - Showing a larger version of the finished physical model when it is folded down and mounted on a wall ... 125
Table of Tables Table 1 - Showing the height when standing straight up ... 19
Table 2 - Showing the height from the feet to the eyes when standing straight up ... 20
Table 3 - Showing the elbow height, to bony point with arm straight ... 20
Table 4 - Showing the recommended height of work surface for different types of work 21 Table 5 - Showing an example on a functional analysis made for a washing machine ... 25
Table 6 - Showing the functional analysis created for the User ... 97
Table 7 - Showing the functional analysis created for the Costumer ... 97
Table 8 - Showing the functional analysis created for the Producer ... 97
Table 9 - Showing the functional analysis created for the Reseller ... 98
Table 10 - Showing the functional analysis created for the Assembler ... 98
Table 11 - Showing the functional analysis created for the Sales Company ... 98
Table 12 - Showing the functional analysis created for the Distributor ... 98
Acknowledgements
xiv
Acknowledgements
I would like to say a special thank you the following people for their interest, support and guidance in this thesis.
Kenneth Johansson
Purchasing Manager at Rörets Industrier AB in Jönköping, Sweden. Thomas Arnell
Teacher at Jönköping University in Jönköping, Sweden.
I would also like to say a big thank you to all the other teachers at Jönköping University who have helped me during this thesis and to all the people who were involved in the questionnaire study.
xv
Abbreviations
CAD - Computer Aided Design
CNC - Computer Numerical Control
Programmes
CAD-models – SolidWorks 2014 Education Edition
Renderings – Keyshot 5
Introduction
6
1 Introduction
In this chapter, the reader will get a short introduction to the content of this thesis.
1.1 Background
Many people are currently living in small apartments, all over the nation. But just because you live in a small apartment, does it not mean that you do not need some of the same things that people who are living in a big houses does. Living in a small space apartment can also be referred to as compact living situation.
There are different ways that you can make your small apartment feel bigger, this can be either by design, smart storage ideas or by using multifunctional furniture’s.
When you are living in a one room apartment, you should only have things which are essential or things that you really love, because you are going to be looking at them at all times. So a furniture for compact living should not only have multifunction’s, it should also look attractive and have the right appearance to fit your style.
A product that most people have at home is an ironing board. But when you are living in a small apartment there might not be so much space for storing it.
1.2 Objectives
The goal with this thesis is to create a multifunctional ironing board for compact living. The ironing board should be easy to access and easy to store after using it. When the ironing board is not in use, it should not look like an ironing board. The ironing board should both be able to be mounted on the wall or hanged over a door.
The target group for the ironing board is single people or couples without children, having a compact living. They should be in the ages between 25-30 years old and they should have their own apartment, either co-operative apartment, rented apartment or apartment rented second hand.
1.2.1 Research Questions
The research question for this thesis is:
How could an ironing board for compact living look so it will fit the stakeholders living environment?
This research question leads to the question
What functions can you combined with the ironing board What are the ongoing design trends?
To accomplish the goal of this thesis and give answers to the research questions, the thesis will go through a design process that includes the steps of Empathizing, Defining, Ideating, Prototyping and Testing.
7
1.3 Company information
This thesis has been conducted together with the company Rörets Industrier AB. Rörets Industrier AB is a Scandinavian company that belongs to the Finnish
SINITUOTE group. They have their own factory in Poland and their main products are ironing boards, covers and airers.
They are the largest manufacturer of ironing boards in Northern Europe and have been a supplier for IKEA in over 30 years. Rörets Industrier AB is market leader in the
Scandinavian countries, Finland, Poland and the Baltic States. During 2012 was over 1 million ironing boards manufactured. [1]
1.4 Delimitations
This thesis does not focus on brand identity for the company Rörets Industrier AB. This means that the design languages for this product will not go in style with the company’s current product line.
The design process will end after the physical model have been made. The last step in the design methodology, where the user will test the physical prototype in its future
environment, will not be included in this thesis.
The style for the ironing board will focus on fitting the target group, which are people between 25-30 years old without children, who are living in an apartment that can be classified as a compact living.
1.5 Disposition
Here will the outline of the report for the thesis be presented.
1.5.1 Introduction
The reader will here get an introduction and some background to the thesis that have been conducted.
1.5.2 Theoretical Background
In this chapter, will the reader be able to get an understanding for two different design methodology and how they are used.
An introduction to the ergonomic aspects that needs to be taken in to consideration when creating a product like this.
Introduction
8
1.5.3 Method
All the methods that were used during this thesis will be presented here.
1.5.4 Approach and Implementation
Here, the reader will get an insight in how this thesis were conducted. There will also be some partial result.
1.5.5 Result
In this chapter is only the final result presented. Here the reader will be able to read about the final CAD-model, final renderings and the physical model that was built.
1.5.6 Conclusion and discussion
In this chapter will mainly focus on the discussion and the conclusions drawn from working on this thesis.
The chapter also contains a comparison between different design methodologies.
1.5.7 Attachment
Here will different result be presented. Some result will be put as attachments to make the report easier to read.
Larger versions of some of the picture from the approach and implementation, and from the result will be presented here.
9
2 Theoretical Background
This chapter includes a definition of overcrowding, design methodology that has been used during this thesis and the important ergonomic aspects that have been taken in to consideration when creating this product.
2.1 Overcrowded household
15 % of the Swedish population is living in an overcrowded household. This number has decreased from 20 % during the 1980s, to 15 % during 2012. [2] But the Swedish
population have increase during this time as well from 8.3 million [3] to 2012 9.6 million [3]. If these 15 % is calculated on the Swedish population today, there are almost 1.5 million people living in an overcrowded household.
Sweden is still generally classified as to having a low number of overcrowded households. Younger people, people living alone and people living in the big cities are the ones which is most often living in an overcrowded household. [2]
The definition for overcrowded households in Sweden is that a household should have a kitchen, bathroom and a bedroom for each person living in the household. If this is not fulfilled, then the household is classified as overcrowded. One exception is if there is a couple living in the household, then they are expected to share the bedroom.
There are different norms when it comes to overcrowding: [4]
Norm 1 and 2 were used during the 1970 and 1975. Norm 3 has been used since 1980 and from 1990 have also norm 4 been used. [5]
According to Boverket, which is an authority for planning, building and housing, 2 out of 3 people living overcrowded household is living alone in a one room apartment. [5] It is most common for younger people to have an overcrowded household. One of every third person in the ages 16 – 24 years old and one out of every fourth person in the ages 25 – 34 years old are living in an overcrowded household. [2] An explanation for this can be the increasing number of people studying and the problem for younger people to get a job which leads to them choosing a smaller household based on their economics. [5]
Norm 1 – More than 2 people/room, where kitchen is counted as a separate
room.
Norm 2 – More than 2 people/room, when the kitchen is not counted as a
separate room
Norm 3 – More than 1 person/room, where the kitchen is counted as a separate
room
Norm 4 – More than 1 person/room, where the kitchen is not counted as a
Theoretical Background
10
Around 70 % of the people who are living in an overcrowded household is living in a rental apartment and around 20 % are living in a cooperative apartment. [5]
2.2 Design Science
Design is art and science combined but Design Science is a relative new discipline within the research community. The reason for creating scientific methods within the design process is because the design should be approached with a combination of analytic and creative sense. [6]
2.2.1 Science in design
Science is built on knowledge and when creating a product it is important to think about the users and get an understanding for human behaviour. By creating a research to get an understanding for this, you will bring out the science in the design process. [6]
Design research should always be at the service of humanity. This is because design is something which is used in everything from everyday products, to products which is used to put people on the moon. [6]
Alongside of the development of new technology, new ways of design science needs to be taken in to consideration. With the help of social media connecting people, products with apps which provides a large amount of data quickly, the designer can get information from the user in a much faster way. This should be taken advantage of and used, both when creating new products or developing already existing product. [6]
But even if it is important to use methods in the design process and create new methods, which we could follow when designing products, it is equally important to respects the creative and non-linear way of thinking when creating designs. If our analytical minds gets involved too early in the design process, it can possible lead to destroying good design ideas. [6]
2.2.2 Future of design science
To increase the knowledge about design science, it is important to get articles about research and similar out to the public. The articles published in the Design Science journal might be the first contact that you have with a specific topic and when reading it, it is important to be able to follow it. The Design Science journal expects a person, who is completely new to the topic, to understand at least 40 % of the articles content. [6]
11
2.3 Approaches when designing
When designing a product as an industrial designer, there are different approaches you can use during the project to make the products more authentic. [7]
2.3.1 User-based approach
Here the design team involves the user by using their feelings and aspirations as a driving force in the project. The user will be involved in different steps during the project, they can for example be involved in an early idea-generation and/or later in more advance testing of the final concepts. [7]
2.3.2 Designer-based approach
In this type of project, can the designer be seen as an author for his or hers work. Just like a real author wants to get people to feel a certain way when reading their books, the designer have the change to affect people with their design. It is here that the individual designer’s vision and principles are shown. [7]
2.3.3 Research-based approach
With this approach, the design team tries to measure the relation between different design decisions and emotional responses. This is a method which can be used when there already are exciting products on the market and the design team are working on a product optimization. This is done by selecting some products variants and let people test them. With the help of a questionnaire study, the design team can get the subjects individual emotional to each of the products. By using statistical techniques can the design team analyse the answers and come to a conclusion. [7]
2.3.4 Theory-based approach
The theory-based approach is used when the design team is creating a product, which does not already exists on the market. With this approach, it’s about creating a new relationship between the user and the product. [7]
Theoretical Background
12
2.4 Bootcamp Bootleg
The design process used during the thesis is called Bootcamp Bootleg. This design
process contains five steps, see Figure 1, and it was developed at the Institute of Design at Stanford. During these five steps there are different methods that can be used to gather necessary information to get the project moving forward. The steps are called Empathize, Define, Ideate, Prototype and Test and they will be explained below. [8]
2.4.1 Empathize
Figure 2 - Showing the first step in the Bootcamp Bootleg design process [8]
The first step in the Bootcamp Bootleg design process is empathize, see Figure 2. It is during this step that the designer gathers the information and get empathy for the user. Here the design team will study the user with the help of different methods to get an understanding for who they are designing for. [8]
The empathizing stages can be divided in to three steps:
Observe - Observe the users and how they behave in their own
environment. To understand the future user is very important since they are the ones that are going to use the product or service in the end.
13
Engage - Interact with the users and interview them with different
methods. By engaging with the users, the design team can learn how the users think and what they value.
Immerse - Experience what the user experiences. This will give the design team a change to view the product or problem in first hand and experience exactly what the user’s experiences. [8]
2.4.2 Define
Figure 3 - Showing the second step in the Bootcamp Bootleg design process [8]
The second step in the Bootcamp Bootleg design process is Define, see Figure 3. During this step, the design team will define the problem based on the information that were gathered during the empathize step and create a problem statement. Here will the frame for the project be put up and what the end goal of the project should be is defined. This step is critical to the design process, because it is here that the problem which the design team is striving to address is defined. [8]
2.4.3 Ideate
Theoretical Background
14
The next step in the Bootcamp Bootleg design process is the Ideate step, Figure 4. It is during this step that the design team will focus on idea generation. The design team will go from identifying the problem to creating different solutions for the users.
There are different methods for generating ideas, but the end goal for this step is to create a big volume of concepts to get a wide range of possible solutions for the user. [8]
2.4.4 Prototype
Figure 5 - Showing the fourth step in the Bootcamp Bootleg design process [8]
This step in the design process is called Prototype, see Figure 5. It is here that the concepts goes from sketches on paper to become physical prototypes. The prototypes which are made, should reflect where the design team is in the design process. If the design team is doing prototypes early in the process, then the prototypes should be fast and simple and the further the team gets, the better finish should the prototypes have. Creating prototypes and letting users try them is the most successful way to get the user to experience and interact with generated concepts. [8]
Prototypes has gone from just testing the concepts functions to evolve into different categories:”
Empathy gaining - Prototyping is a tool to deepen your understanding
of the design space and your user, even at a pre-solution phase of your project.
Exploration: - Build to think. Develop multiple solution options.
Testing: - Create prototypes (and develop the context) to test
and refine solutions with users.
Inspiration: - Inspire others (teammates, clients, customers,
15
The goals of prototyping is often a bit of all the categories above. Reasons to prototype:
Learn - If a picture is worth a thousand words, a prototype
is worth a thousand pictures.
Solve disagreements - Prototyping is a powerful tool that can eliminate
ambiguity, assist in ideation, and reduce miscommunication.
Start conversations - A prototype can be a great way to have a different
kind of conversation with users. Fall quickly and
cheaply
- Creating quick and dirty prototypes allows you to
test a number of ideas without Manage the
solution-building process
- Identifying a variable to explore encourages you to
break a large problem down into smaller, testable chunks.” [8]
2.4.5 Test
Figure 6 - Showing the fifth step in the Bootcamp Bootleg design process [8]
The last step of the Bootcamp Bootleg design process is Test, see Figure 6. During this step will a low-resolution model be placed in the proper context of a user’s life.
It is important that the design team do this type of testing, both so that the prototype can be refined but also to learn more about the users. [8]
Theoretical Background
16
2.5 Double Diamond
Another design process model is the Double Diamond. This process is a simple visual way of showing how the design process should work and it has been developed at the Design Council in the United Kingdom. The model is divided in to four stages, Discover, Define, Develop and Deliver, see Figure 7. These stages will be explained below. [9]
2.5.1 Discover
The first stage is called “Discover”, see Figure 8. It is here the project starts and where the design team should do different researches for the project like, market- , user- and design research. The goal for this stage is to gather all the information needed for conduction the project. [9]
Figure 8 - Showing the first stage in the double diamond design process [9]
2.5.2 Define
The next stage of this design process model is “Define”, see Figure 9. The design team will, based on the information gather during the Discover stage, define the project. At the end of the defining stage, is a brief be created. [9]
17
Figure 9 - Showing the second stage in the double diamond design process [9]
2.5.3 Develop
The third stage is the “Development” stage, see Figure 10. This is the ideation stage and it is here all the sketches will be developed, iterated and tested. The goal for this stage is to create as many concepts as possible and so that the design team have as much solutions as possible. [9]
Figure 10 - Showing the third stage in the double diamond design process [9]
2.5.4 Deliver
The fourth and final stage of the Double Diamond design process is the “Deliver” stage, see Figure 11. Here will the finalized product be presented and launched on the market. [9]
Theoretical Background
18
2.6 Appearance
When creating and selling a product, it is important to think about the optical properties of the product. The colour and gloss of the paint is equally important as the choice of material when it comes to the optical properties.
Every human have pre-learned rules which we automatically apply to everything we see. This lets us recognize and interpret the things we see. Walking by a vase of flowers for example. If you walk by it fast, then you might only see that it is a vase of flowers on the table and thereby only apply the pre-learned rules for this. But if something makes you drawn to the flowers and you look more closely at them, then you will apply more rules to be able to interpret what you see. This may lead to you recognizing the type of flower and perhaps evoke memories where this type of flowers have a specific meaning.
Measuring appearance is complicated. When we look at something, we use the response from our visual sense to interpret the light, objects, space, location and movement all working together. Based on what we see, we will make judgements which will lead to us making a specific decision. The light around the product can actually make us buy a product or reject it. When you are buying a car, you might be influenced to buy the car because the surface and glossiness makes us think about high quality and prestige. The visual interpretation can sometimes work against us, since the perception happens fast and automatically. The complete appearance will depend on many different attribute, which occurs when light is shining on the object. [10]
19
2.7 Human Factors
When creating a product, it is important to think about the ergonomics for the user. When looking at the different dimensions of the human body which is going to have an effect the product, I used the computer program called “PeopleSize Visual
Anthropometry Software”. This is a database where you can get information about people’s size based on government surveys.
When searching for people size, you can choose what country you would like to get the people size from. The product that I am creating should be used in Scandinavian homes and thereby based on the sizes of people from Scandinavia. Unfortunately Scandinavia do not have the measurements that I am looking for. Because of this I have chosen to use the information from the country that is geographically closest to us, which is the people size from the German males and females.
Table 1-Table 3 contains different measurement on the body. These numbers represent 99% of the German population in the ages between 25-50 years old. Figure 12 - Figure 14 shows how the measurement has been taken. [11]
Table 1 - Showing the height when standing straight up
“Measured vertically from the floor to the highest point of the head, compressing the hair. The person stands erect, looking ahead, the arms relaxed at the sides. The shoulder blades (scapulae) and buttocks will ideally be in contact with a vertical surface.” [11]
Height Age Min
(mm) (mm) Max
German male 25-50 1613 1943
German female 25-50 1507 1817
Figure 12 - Showing the height when standing straight up [10]
Theoretical Background
20
Table 2 - Showing the height from the feet to the eyes when standing straight up
“Measured vertically from the floor to the outer border of the eye socket. The person stands erect, looking ahead, the arms hanging loosely at the sides. The shoulder blades (scapulae) and buttocks will ideally be in contact with a vertical surface.” [11]
Table 3 - Showing the elbow height, to bony point with arm straight
“Measured vertically from the floor to the bony prominence on the outer surface of the elbow. The person stands erect, arm hanging straight at the side. This gives a slightly longer measurement than with the elbow bent to 90 degrees.” [11]
Height to the eyes Age Min
(mm) (mm) Max
German male 25-50 1497 1823
German female 25-50 1406 1702
Elbow height, to bony
point with arm straight Age (mm) Min (mm) Max
German male 25-50 997 1243
German female 25-50 940 1155
Figure 14 - Showing the elbow height, to bony point with straight arm [10]
Figure 13 - Showing the height from the feet to the eyes when standing straight up [10]
21
The average height of males and females based on country. [12]
Average height based on country Height (cm)
Swedish Male 177,9
German Male 181
Average height based on country Height (cm)
Swedish Female 164,6
German Female 165
When working in a standing position, it is important to have the right height on the work surface. This height differs depending on what type of work that will be performed on the work surface, see Table 4 and Figure 15. [13]
Table 4 - Showing the recommended height of work surface for different types of work
Type of work Example Height Height of
work surface Precision Work Writing,
Electronic assembly 5 cm above elbow height. To give support 95 – 120 cm
Light Work Assembly line,
Mechanical work 5 – 10 cm below elbow height 85 – 110 cm
Heavy Work Work that demands
downward forces 20-40 cm below elbow height 65 – 95 cm
Method
22
3 Method
The methods that were used during this thesis will be described below.
3.1 Design Brief
During the design brief will the design team get all the information needed to start the project. The design brief should contain what the project should be about and the
information needed to fulfil the expectations. The main focus should be future result and outcomes and not focus on the aesthetics of the design of the product. The design brief should be more of a proposal for the project and not have a clear solution to it. [14]
3.2 PERT-Chart
PERT stands for Program Evaluation Review Technique and is a visual tool used in project management. The PERT- Chart consist of nodes and vectors. The nodes can represent milestones or events and the nodes are connected with directional lines called vectors. The nodes can be either parallel or serial. If two nodes are parallel, then it means that the tasks are independent on each other and can be conducted during the same time. If the nodes are serial, that means that the tasks need to be finished in a specific order. [15]
3.3 WBS – Work Breakdown Structure
A WBS-Chart (Work Breakdown Structure Chart) gives a visual of all the tasks needed to be done in order for the project to be finished. This chart also consist of nodes and vectors, showing how all the tasks are connected to each other. The difference from the PERT-Chart is that this chart is based on a hierarchy tree. The first nodes are the
headlines for the different tasks. Under these headlines, there are several other nodes that symbolizes the tasks. Depending on how detailed the WBS-Chart should be, the design team can continue breaking down the nodes and making them sub-headlines. [16]
3.4 Gantt-Schedule
A Gantt-Schedule is a visual schedule put on a time axis. To create a Gantt-schedule the design team have to identify the different activities that is going to be conducted in the project. These activities are then placed on the time axis in the order in which the activities should be carried out. The length of the bars indicates how long time it should take to complete the activity. If two or more bars are overlapping on the time axis, it indicates that these activities should be conducted parallel to each other.
Deciding on how long each activity should be assigned can be difficult if the designer are lacking in experience. A good way to start can be to place out the different deadlines on the time axis and then place out the activities based on if they should be completed before or after the specific deadline. After placing out all the activities, it will be easier for the designer to predict how long time each activity will take. [14]
23
3.5 Stakeholder Analysis
A stakeholder analysis is a process which the design team uses when trying to identify the different groups that will be affected of the final result of the project. The stakeholders should be organized based on the impact that the project will have on them and the impact that they will have on the project. [17]
3.6 Questionnaire Study
Since the design team is not the end user, it is important to get an understanding of the end user’s wants and needs. Collecting information from the end user can be done in many different ways. [14]
The methods used during for this questionnaire study will be explained below.
3.6.1 Observation: Structured
A structured observation is when a specific type of behaviour is observed. The design team creates an event where people will come and conduct the task that the designer wants to study. This type of method is easily studied but it does not give an explanation for the behaviour. [17]
3.6.2 Interview: Conjoint Analysis
This type of interviewing method is used to get insight to how people value different features on a product or service. This method is very useful when deciding what features new products should or should not have.
When using this methods, the designer shows some features to the respondent. The respondent will either rate the features or choose the best combination of features. [17]
3.6.3 Interview: Close Ended Questions
Close ended questions are a questions which the subject can answer with a simple yes or no. This type of answer does not need to be interpreted by the designer. This method is a very fast way to both interview people and analyse the subject’s response. [17]
Example of these kind of questions: Is this a spoon?
Do you like milk?
3.7 Brainstorming
The goal with brainstorming is to generate a large quantity of concepts and ideas. A good way to use brainstorming is to sit in group and try to generate as many ideas as possible. The reason why design team should sit in a group is so that all the team members can build their ideas on the other members’ ideas. During a brainstorming session there
Method
24
should never be any criticism on any of the concepts. It does not matter how crazy the idea might be, another members might get a really good idea by building from the crazy one.
The brainstorming method can be used throughout the whole design process, whenever ideas or solutions are needed. [8]
3.8 Target group
Every person is different and like different things. Because of this, it is important that the design team knows who they are designing for. This group is called for the projects target group. The target group is different from the market. The market is everyone that can potentially can buy the product, while the target group is the ones which the design team have in mind when they are designing and who they see as the main buyer for the
product, see Figure 16. [14] This group of users shares mutual goals, approach and behaviours when interacting with the specific product or service. [18]
When the design team have established who target group, they can start gathering information about what the buyer appreciates and how that will affect the product that the design team is creating. Another thing that design team should take in to
consideration, is that it is not always the user that buys the product, it could be a parent that buys a toy for his or hers child. [14]
Figure 16 - Showing target group and market
3.9 Personas
A persona is a fictional character created by the design team. The personas are not real people but they are based on the target group that the design team is designing for. [18] When gathering information for the personas, the design team can for example look at demographics, habits or a sources of motivation. At last the character is given a name. It is important that everyone in the design team really buys in to the persona and its
characteristics. This character should motivate the design team and keep them on track, not make the team confused. [8]
25
3.10 Functional analysis
A functional analysis is a method used to collect data. This data is in the forms of functions that product should have or could have. A functional analysis should only express the function is a verb and a noun and not a description in how the final technical solution should look. A functional analysis will get the best result if it is carried out with all team members during a brainstorming session. This is important since all members should have a chance to contribute to the finished result. [19] [20]
Functional Analysis table contains:
Feature – The function (verb)
Noun – A noun that is connected to the feature
Note – A note about noun
Type – Classification of the function –
Main function (MF), Necessary function (NF), Desirable function (DF), Unnecessary function (UF) Description of the classification of the functions:
Main function – The primary function. If this function is not fulfilled,
then the product does not work.
Necessary function – These functions should be met
Desirable function – These functions is desirable, but not a priority
Unnecessary function – These functions are for a various reason is considered
unnecessary Table 5 - Showing an example on a functional analysis made for a washing machine
Feature (Verb) Noun Note Type
Clean Cloth With a machine MF
Offering Refilling of cleaner NF
Offer Drying Centrifuge NF
There should be one functional analysis for each stakeholder. The reason for this is that some of them have different wants and needs for the product. For example an assembler wants the product to be easy to mount, while this might not be a demand from the user unless the user and the assembler happen to be the same person.
Method
26
3.11 Image Board
Image Board, also called Mood Board is a picture collage which is used to give inspiration to the design team. The image board can show feelings that the design team wants the target group to feel or it can be to show the environment in which the target group is living or working in. These pictures can be good to make sure that everyone in the design team going in the same direction [14]
3.12 Sketching
Sketching is a good technique when it comes to both visualizing the idea to others and trying out different solutions. A sketch can show things that might be hard to explain. The sketches can be made in both two- and three dimensions, depending on what is important to show. When lots of sketches are done, it is easy to compare and them with each other and choose the best concept. In the beginning, the sketches should be simple and just show the necessary details. When the project then evolves, so should the sketches and they should go more into details the further on in the project that you come. [14]
3.13 Design Analysis
When the design team is designing a product it is important for them to keep track on the ongoing trends and see what might be popular in the future. Design and trend analysing for future trends can be hard to do, because the design team can never really be know what will be popular a year from now. There are two ways to go, either the design team can see what is popular today and maybe make small changes or as few companies dare, create their own trends. [14]
3.14 CAD - modelling
A CAD-model can give the design team an early understanding for how the sketch would look like in real life. This is also a good step to have between sketching and model
making, because you can really see the dimensions and the different objects compared in size with each other. It is also good when you fast want to compare different designs with each other. [14]
3.15 Rendering
After a CAD-model is created, the design team can use a rendering program to make the CAD-model more realistic and show how it would look in real life. The design team can create different types of renderings, it can be a rendering representing just the product or the how the product would look like in its future environment. [14]
27
3.16 Physical Model
After a sketch has been created on a paper and then made in to a CAD-model in the computer, it can be a really good thing to create a physical model. The physical model can be very easy and basic or very advanced and look exactly like it would when it is
produced, this is all depending on when in the design process that it is made. When creating a model, the design can really experience how the product would be to use. The design team can also see things with model that had not been noticed during sketching and making of the CAD-model. When the model is rough, it is called a mock up and they could just be tape on the wall or cubes that has been drawn on. When a model is created in end of the product, it can be divided in to two kinds of models, design models and functional models. [14]
3.16.1 Design model and Functional Model
A design model, looks just like it has been produced. A design model does not work, it only has the same look and use of material as the product while the functional model have them same functions as the real product.
A functional model is a model which works just like the real product would. This could be made in to a smaller scale model, but normally it is in scale of 1:1.
The design model and functional model can sometimes be combined.
A model is normally in the same shape, of the same material and have the same functions as the finish product, the things that can be different is the manufacturing method. The reason for not using the same manufacturing methods is because the machines and tools are usually very expansive. [14]
Approach and Implementation
28
4 Approach and Implementation
This chapter will present the approach of this thesis and also how the methods have been implemented throughout it. The approach for this thesis has been a mixture of designer-based (see Chapter 2.3.2) and research-designer-based (see Chapter 2.3.3) and it will be presented in the stages of design process Bootcamp Bootleg as has been described in Chapter 2.4 at page 12.
4.1 Empathizing
The first stage is the empathizing stage. Here will the design brief, planning of the thesis and questionnaire study be presented.
4.1.1 Design brief
The first thing in I did in this thesis was to get a design brief. The company that I worked with, did not give me so much information about what they wanted during the brief. They wanted to see what I could do without giving me any boundaries, but if I had any
questions about ironing boards, I could always ask them.
4.1.2 Planning
After the design brief, I started with planning the thesis.
PERT-chart
I started with creating a PERT-chart. I began with identifying the different milestones for the thesis. These milestone were written down on post-it notes to make them easier to arrange. The post-it notes were then placed in order of which they were going to be conducted and whether or not they were depending on other milestones to be finished before. When all the post-it notes were arranged in a satisfying way, lines were drawn between the notes to make the critical path visual and to give a clear view of which milestones were depending on others. The PERT-Chart was then put in the computer and printed.
The PERT-chart which was created for this thesis can be seen in Attachment 8.1
WBS-chart – Work breakdown structure chart
When the PERT-chart was done, I continued with breaking down the different
milestones and thereby creating a WBS-chart. The post-it notes that were used during the creation of the PERT-Chart was used here as well. The milestones were placed in the order, which they were going to be conducted and used as headlines for the WBS-Chart. These headlines where broken down in to tasks and written on post-it notes, one note for each task. These where then placed under each headline. The WBS-Chart was then put in the computer and printed.
29 Gantt-Schedule
The next part of the planning, was creating a Gantt-schedule which would give me all the tasks on a timeline. The tasks for the Gantt-schedule was based on the tasks that were identified during the creation of the WBS-chart.
The tasks where placed in a column, in the order in which they should be conducted. Before the estimation on how much time each task would take, was the different fixed dates place out on the timeline. These dates were the dates for the mid-presentation, final presentation and the date for when it is time to send the report to the opponent. Based on these dates, it is easier to estimate on how much time each task maximum could take. The time estimations where created from end to beginning.
The Gantt-Schedule that was created for this thesis can be seen in Attachment 8.3
4.1.3 Questionnaire Study
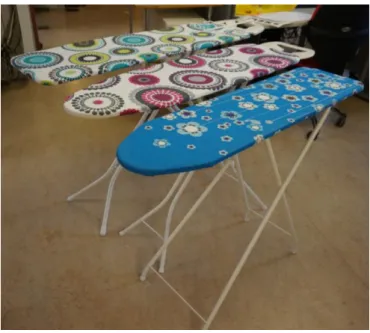
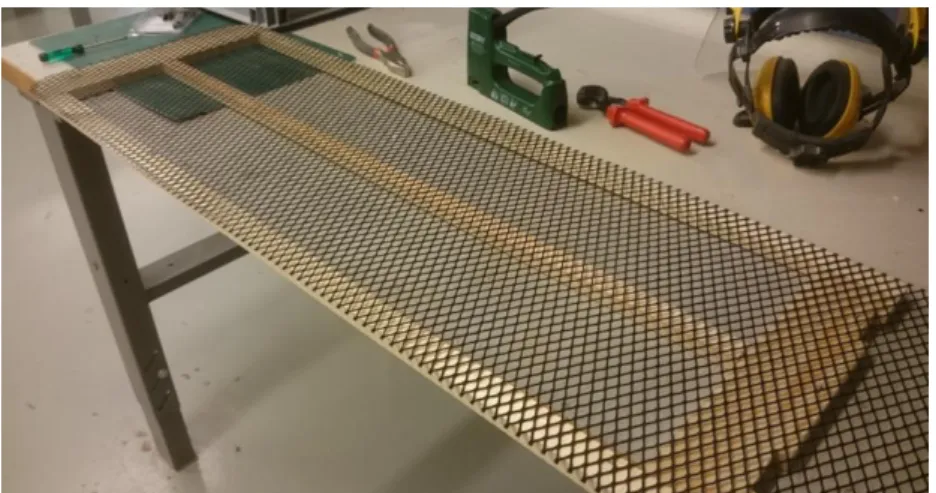
To get valuable information from users of ironing boards, was a questionnaire study conducted. This was a way to get some thoughts from users and information about their wants and needs. The questionnaire study included 20 people that were observed and interviewed separately. The sex ratio was 12 male and 8 female in different ages. The questions that were asked were divided in to three sections.
The first section was about observing the subjects when they interacted with ironing boards that were brought to the interview. These ironing boards had different styles and shapes, see Figure 17. The ironing board with blue cover is the one which is referred to number 1, the ironing board with pink cover is referred to as number 2 and the blue- green to number 3.
Approach and Implementation
30
The second section of the interview focus on the ironing board that the subject have at home and the usage of it.
The third focused on the future ironing board for the subject. What they value the most when they buy an ironing board and new functions that the user would like to see in the future.
The questions asked during the questionnaire study can be seen in Attachment 8.5.1. The answers given by the subjects can be seen in Attachment 8.5.2.
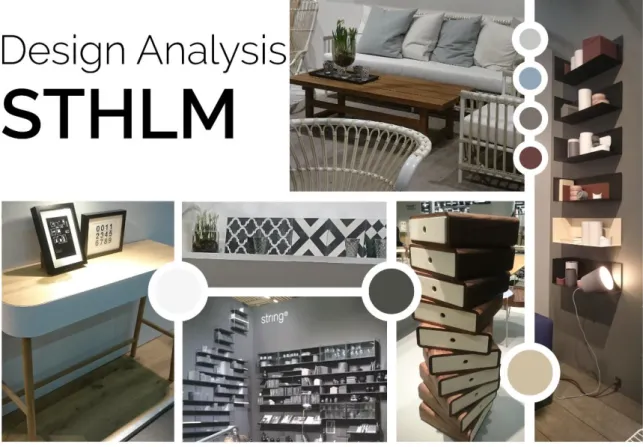
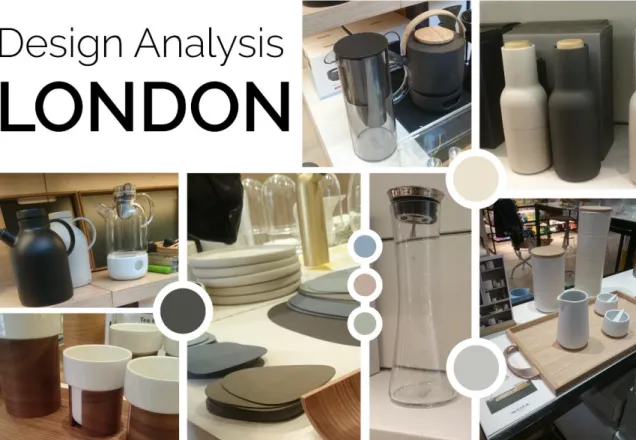
4.1.4 Design analysis
During this thesis was two design analysis made and compared. The first analysis was made after a visit to the “Furniture and Light Fair” in Stockholm, Sweden. The second design analysis was create after a trip to a store in London, UK called “Skandium”, where they sell Scandinavian design interiors.
Larger images of Figure 18 and Figure 19 can be seen in Attachment 8.6.
Furniture and Light Fair, Stockholm
31
At the Furniture and Light Fair in Stockholm, you could see soft colours with a lot of natural material like wood and concrete. There were a lot of geometric shapes mixed with each other, either in black and white or in different soft pastel colours.
As shown on Figure 18, there are a lot of furniture’s where the designer have taken a natural material like unpainted wood and used it together with material that has been painted in a toned down colour.
Compared to last year, the nature has gotten a larger voice and is now moving from the outside in.
Skandium, London
Figure 19 - Showing the design analysis that where made based on the visit to "Skandium" in London
In the “Skandium” store in London, you could defiantly see the Scandinavian design. They had the same colour scheme that you could see during the furniture and light fair in Stockholm.
Approach and Implementation
32
4.2 Define
After all the information was gathered, I started to define the project by creating a stakeholder analysis and creating a functional analysis on the different stakeholders that have the most impact on the product. I also decided which target group I wanted to design for and made personas within this target group
4.2.1 Stakeholder Analysis
The defining stage started with creating a stakeholder analysis. This would give me an overview of who would have an impact on the product and which stakeholders I needed to take in to consideration when creating the functional analysis. To make the analysis more clear, was a stakeholder analysis chart created, see Figure 20.
A larger image of Figure 20 can be seen in Attachment 8.4.
Figure 20 - Showing the a visual image of the Stakeholder Analysis that was created The stakeholder that were identified were:
User – The persons who are going to use the product
Customer – The persons who are going to buy the product
Reseller – The company who are going to sell the product to the customer
Sales Company – The company who are going to sell the product to the reseller
Designer – The person who is designing the product
Assembler – The company who are going to assemble the product
Producer – The company who are going to produce the parts for the product
Government – The government and their laws
Community – The community around the product
33
4.2.2 Target group
It is impossible to create a product that everyone is going to like. This means that you as a designer have to choose a target group to design for. I did not get a specific target group to design for during my design brief, so I could choose for whom I wanted to design for myself. When choosing target group, I started brainstorming around what types of target groups I could design for. In the end I choose to create an ironing board for people in the ages between 25-30 years old. They have no children and are either living alone or
together with a partner. They have recently started working or they have been working for a couple of years, but they feel that they have an enough income to be able to put some extra money on furniture’s and decorations. They are living in a city somewhere in Sweden and their apartment can be considered as a compact living apartment.
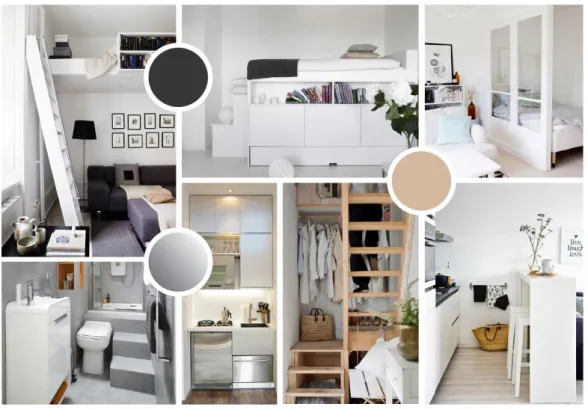
4.2.3 Image board
To get inspiration when sketching ironing boards for the target group, was an image board created, see Figure 21. This image board was made to represent the environment in which the product could be placed in. When creating the image board, I took in to
consideration the design elements that were shown in Stockholm and in London. The reason for doing this is so that the product that I would create was going to fit in to an environment that have the same feeling as the products seen on the furniture and light fair and in the store in London.
A larger version of Figure 21 can be seen in Attachment 8.7.
![Figure 1 - Showing the different steps in the Bootcamp Bootleg design process [6]](https://thumb-eu.123doks.com/thumbv2/5dokorg/5442807.140721/23.892.106.559.562.809/figure-showing-different-steps-bootcamp-bootleg-design-process.webp)
![Figure 4 - Showing the third step in the Bootcamp Bootleg design process [8]](https://thumb-eu.123doks.com/thumbv2/5dokorg/5442807.140721/24.892.103.557.827.1057/figure-showing-step-bootcamp-bootleg-design-process.webp)
![Figure 5 - Showing the fourth step in the Bootcamp Bootleg design process [8]](https://thumb-eu.123doks.com/thumbv2/5dokorg/5442807.140721/25.892.107.510.297.534/figure-showing-fourth-step-bootcamp-bootleg-design-process.webp)