Submitted 17 March 2014 Accepted 8 May 2014 Published 22 May 2014 Corresponding author Juha M. Alatalo, juha.alatalo@ebc.uu.se Academic editor Hannah Buckley
Additional Information and Declarations can be found on page 13
DOI 10.7717/peerj.406 Copyright 2014 Alatalo et al. Distributed under
Creative Commons CC-BY 4.0 OPEN ACCESS
Dominance hierarchies, diversity and
species richness of vascular plants in an
alpine meadow: contrasting short and
medium term responses to simulated
global change
Juha M. Alatalo1, Chelsea J. Little1, Annika K. J¨agerbrand2and Ulf Molau3
1Department of Ecology and Genetics, Uppsala University, Visby, Sweden
2VTI, Swedish National Road and Transport Research Institute, Stockholm, Sweden
3Department of Biological and Environmental Sciences, University of Gothenburg, Gothenburg, Sweden
ABSTRACT
We studied the impact of simulated global change on a high alpine meadow plant community. Specifically, we examined whether short-term (5 years) responses are good predictors for medium-term (7 years) changes in the system by applying a factorial warming and nutrient manipulation to 20 plots in Latnjajaure, subarctic Sweden. Seven years of experimental warming and nutrient enhancement caused dramatic shifts in dominance hierarchies in response to the nutrient and the combined warming and nutrient enhancement treatments. Dominance hierarchies in the meadow moved from a community being dominated by cushion plants, deciduous, and evergreen shrubs to a community being dominated by grasses, sedges, and forbs. Short-term responses were shown to be inconsistent in their ability to predict medium-term responses for most functional groups, however, grasses showed a consistent and very substantial increase in response to nutrient addition over the seven years. The non-linear responses over time point out the importance of longer-term studies with repeated measurements to be able to better predict future changes. Forecasted changes to temperature and nutrient availability have implications for trophic interactions, and may ultimately influence the access to and palatability of the forage for grazers. Depending on what anthropogenic change will be most pronounced in the future (increase in nutrient deposits, warming, or a combination of them both), different shifts in community dominance hierarchies may occur. Generally, this study supports the productivity–diversity relationship found across arctic habitats, with community diversity peaking in mid-productivity systems and degrading as nutrient availability increases further. This is likely due the increasing competition in plant–plant interactions and the shifting dominance structure with grasses taking over the experimental plots, suggesting that global change could have high costs to biodiversity in the Arctic.
Subjects Biodiversity, Conservation Biology, Ecology, Ecosystem Science, Plant Science
Keywords Alpine tundra, Climate change, Plant community diversity, Meadow, Functional groups, Nutrient addition, Species richness, Warming, Global change, Arctic
INTRODUCTION
Global change is expected to lead to widespread biome and biodiversity shifts across spatial scales, from the regional to the global (Sala, Chapin & Armesto, 2000;Grimm et al., 2013). Many of the fastest changes in physical conditions are predicted to occur in polar and alpine ecosystems, including increasing growing season length, permafrost degradation, and increasing nutrient mobilization, due to a climate warming that is unprecedented in the last two millennia (IPCC, 2007;Kaufman et al., 2009). As a result, these ecosystems are assumed to be particularly vulnerable to climate change (Callaghan & Jonasson, 1995), with some species even going extinct (Klein, Harte & Zhao, 2004). Observational studies have already shown shifts in plant community structure over the last several decades of climate warming in high-latitude and high-elevation tundra, particularly the proliferation of shrubs and grasses (Capers & Stone, 2011;McManus et al., 2012;Callaghan et al., 2013).
Ecosystem responses to global change are complex, nonlinear, and spatially and temporally heterogeneous. Warming is predicted to be the largest driver of change in arctic, alpine, and boreal regions, but nitrogen deposition is also expected to have a large effect, especially in alpine ecosystems (Sala, Chapin & Armesto, 2000). Within a single landscape, warming and nutrient amendment may change in their relative importance from low to high elevations (Graglia et al., 2001). The effects of both have been examined experimentally. Early analyses and meta-analyses of experimental warming in alpine and arctic systems found immediate phenological changes, short-term responses in terms of plant growth, and medium- and long-term responses in terms of plant reproduction and community structure (Arft et al., 1999;Van Wijk et al., 2004;Hollister, Webber & Tweedie, 2005). Nutrient enhancement in these systems also produced short-term growth responses but were sometimes followed by declines in abundance (Dormann & Woodin, 2002;Campioli, Leblans & Michelsen, 2012). There are many potential explanations for the complexity of these responses. The changes themselves create biotic effects such as increased plant competition and changes in litter accumulation, which may in turn affect demography (Foster & Gross, 1998;Olsen & Klanderud, 2014). Species also exhibit different degrees of phenotypic plasticity, and may thus vary in their ability to succeed, survive and thrive under the anticipated changing conditions (Campioli, Leblans & Michelsen, 2012). More recent meta-analyses of temperature manipulation experiments have shown that responses vary sizes to warming treatments and may increase over time, likely due to a combination of all of these factors (Elmendorf et al., 2012). Longevity may also play a role, as short lived species have been predicted to be more sensitive to climate change than more long-lived species (Morris et al., 2008). This implies that many alpine and Arctic plant species could buffer against climate change due to their long-lived nature. In the longer run, however, the long life span of arctic and alpine plants in combination with their capacity for sexual reproduction will determine their fate as evolutionary adaptation is a slow process in comparison with the projected pace of warming (Molau, 1993). It is questionable whether evolution can keep pace with climate change on global scale, thus increasing the extension risk (Jump & Pe˜nuelas, 2005;Parmesan, 2006).
While dividing plant species by functional type may not always yield consistent results within a group (Dormann & Woodin, 2002), the size and speed of responses to simulated global change may nonetheless be somewhat generalizable by plant functional type. For instance, grasses are commonly increasing in abundance under both warming and nutrient treatments (Graglia et al., 2001;Klanderud & Totland, 2005;Campioli, Leblans & Michelsen, 2012). Shrubs have also been detected as expanding in the arctic in recent years (McManus et al., 2012). Another important functional group is cushion plants, which have great influence on ecosystems in polar and high alpine areas throughout the world as they often function as facilitator species across trophic levels (Cavieres & Arroyo, 2002;Molenda, Reid & Lortie, 2012;Roy et al., 2013). Unfortunately, there are very few experimental studies on climate change impact on cushion plants, but the few that exist have shown contrasting responses to warming (Day et al., 2009;Alatalo & Little, 2014). The ability of functional groups to compete for light, nutrients, and other resources varies, and the responses may depend on interactions with co-inhabiting species; for instance, the most abundant (“dominant”) species or functional group in a community can have a strong influences on the biotic conditions of the other species by either negative, competitive interactions or by positive, facilitative interactions (Grime, 1998;Klanderud & Totland, 2004). For instance, an increase in shrub cover may lead to a decrease in species richness (Pajunen, Oksanen & Virtanen, 2011) while the presence of nitrogen-fixing legumes facilitates a richer plant community (Olsen, Sandvik & Totland, 2013). With changes in abiotic conditions, dominant species in more productive alpine plant communities may monopolize added N and P at the expense of their neighbors (Onipchenko et al., 2012), or may show changes in both their competitive response and competitive effect under experimental warming (Niu & Wan, 2008). Thus the redistribution of vegetation types in arctic and alpine ecosystems can create major shifts in dominance hierarchies (Klanderud & Totland, 2005), resulting in feedback loops accelerating changes in ecosystem structure and functioning (Graglia et al., 2001).
There are a growing number of studies on simulated global change effects on alpine plant communities at the community level, by warming and by nutrient addition. However, at present there are only a few factorial studies with experimental warming and nutrient addition on alpine plant communities (for example,Chapin et al., 1995;
Alatalo, 1998;Klanderud & Totland, 2005;J¨agerbrand et al., 2009;Campioli, Leblans & Michelsen, 2012), and not one of them attempts to assess if short term (<5 years)
responses are consistent with medium (6–10 years) or longer term (>10 years) responses. This represents a notable gap in knowledge, as an Alaskan study suggests that short term responses are poor indicators of longer term studies (Hollister, Webber & Tweedie, 2005). We used a factorial experimental design to assess community and functional group response of vascular plants to warming and nutrient perturbations in northern Sweden over a period of seven years. The abundance of lichens, bryophytes, and vascular plants have already been shown to have changed after five years of manipulations in this experiment (Alatalo, 1998;Molau & Alatalo, 1998;J¨agerbrand et al., 2009). In this study, we
examine whether short-term responses are good predictors for longer-term changes in the system, i.e., are short-term responses consistent with longer-term responses.
MATERIALS & METHODS
Study area
Fieldwork took place at the Latnjajaure Field Station (LFS) in northern Sweden, at 1000 m elevation in the valley of Latnjavagge (68◦
21′ N, 18◦
29′
E). Continuous climate data were provided from the early spring of 1992 onwards. Climate is classified as sub-arctic (Polunin, 1951) with snow cover for most of the year, cool summers, and relatively mild, snow-rich winters. Mean annual temperatures ranged from −2.0 to −2.7◦C between 1993 and 1999, with winter minima of −27.3 to −21.7◦
C. Mean annual precipitation during this time period was 808 mm, with individual years ranging from a low 605 mm in 1996 up to 990 mm in 1993. The warmest temperatures come in July, which had mean temperatures ranging from +5.4◦C in 1992 to +9.9◦C in 1997.
Physical conditions in the valley vary from dry to wet and poor and acidic to base-rich, with a variety of plant communities to match. This field experiment focused on a meadow community. Previous work in the valley has shown that despite a geographic situation of subarctic-alpine, vegetation of the area is more representative of the Low Arctic, with
Cas-siope tetragona, Dryas octopetala, and Carex bigelowii among the dominant species (Molau & Alatalo, 1998). At the beginning of this field experiment, the plots were characterized by sedges, shrubs, and cushion plants: C. tetragona, C. bigelowii, Carex vaginata, Silene acaulis and Vaccinium vitis-idaea were present in every plot in the meadow community, while
Polygonum vivparum and D. octopetala were present in 75% or more plots.
Experimental design
In July 1995, 20 plots(1 × 1 m) with homogenous vegetation cover were chosen in the meadow plant community and randomly assigned to treatments in a factorial design. There were 8 control (CTR) plots and 4 plots for each of the experimental treatments: warming (T for temperature enhancement), nutrient addition (N) and combined warming and nutrient addition (TN). Warming was induced by Open Top Chambers (OTCs) that increase temperature by 1.5 to 3◦C compared to control plots with ambient temperature (Marion et al., 1997;Molau & Alatalo, 1998). Nutrient addition consisted of 5 g of nitrogen (as NH4NO3) and 5 g of phosphorus(P2O5) per m2, dissolved in 10 L of meltwater. In 1995 all plots were analyzed with a point-frame method (Walker, 1996) to determine the species occurrences under natural conditions before implementing the experimental treatments. The OTCs were then left on plots with warming treatments year-around, and nutrient addition was applied directly after the initial vegetation analyses in 1995 and a few days after snow melt in the subsequent years (1996–2001).
Measurements
All vascular plants in the plots were identified to species level and cover of each species was assessed using a 1 × 1 m frame with 100 grid points (Walker, 1996) in the middle of the 1995, 1999, and 2001 growing seasons. To ensure accuracy and reproducibility,
the same grid frame was used for each measurement, and fixed points at the corner of each plot allowed the frame to be placed in the same position within the plot at each different measuring point. Only the first hit of each species was recorded. This method has been shown to be accurate in detecting changes in tundra vegetation (May & Hollister, 2012).
Data analysis
From the point-frame data, we summed the number of touches to pins within each plot to produce plot-level cover measures for each species, which were aggregated into total cover for each plot. Species richness was tallied as the total number of species present at the 100 points within the plot. The cover data, showing the number of hits for each species, were used to calculate the Shannon diversity index and Pielou’s evenness index in each plot (Oksanen et al., 2012).
For each response variable, normality and homogeneity of variance were assessed using standard diagnostic procedures. All statistical analyses were performed in R version 2.15.3 (R Core Team, 2013). A mixed-effects model with fixed factors of nutrient and temperature manipulation, random factors of year and plot was used to analyze responses in total cover, species richness, diversity, and evenness for the whole community using the lme4 package (Bates, Maechler & Bolker, 2012), using restricted maximum likelihood (REML). A generalized linear mixed-effects model using Poisson errors was used for total cover and species richness. Diversity and evenness were normally distributed and a generalized model was not necessary. Backward model selection was performed using second-order AIC (AICc) scores (Mazerolle, 2013) due to the small sample size. For model validation, we examined residuals and q-q plots. Where the interaction of the fixed factors was significant, multiple comparisons were performed within the generalized linear model framework using the glht function of the multcomp package (Hothorn, Bretz & Westfall, 2008).
We also analyzed responses for each of six functional groups: cushion plants, deciduous shrubs, evergreen shrubs, forbs, grasses, and “sedges” (including both Juncaceae and
Cyperaceae). We used each species’ pin-hits to calculate each functional group’s cover, and
from this its relative cover as a percentage of the total cover in each plot. Functional group cover was analyzed using the same generalized linear model as total cover, described above. Shannon diversity was calculated separately for the deciduous shrub, evergreen shrub, and forb functional groups and analyzed using mixed-effects models as described above. Cushion plant, grass, and sedge functional groups rarely had more than one or two species present in a plot, and as a result analyzing the Shannon diversity lacked utility. Instead, for each plot we used the more simplistic measure of species richness for these three functional groups, categorizing the change from 1995 to 1999 and from 1995 to 2001 as either losing species richness, maintaining the same number of species, or gaining species richness. The distribution of these responses between treatment groups was compared to what would be expected based on cell size and the global mean using Fisher’s exact test, with p-values based on 10,000 replicates of Monte Carlo simulation.
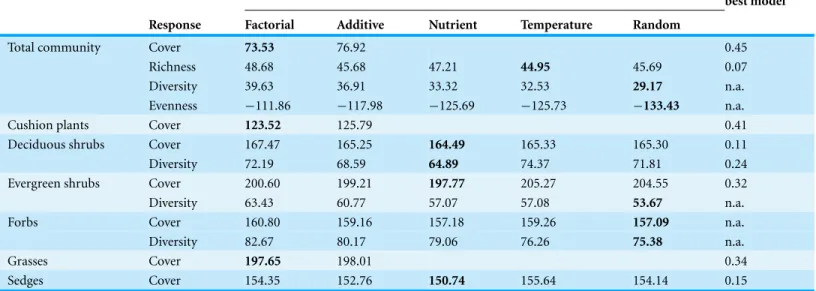
Table 1 Stepwise selection of generalized linear mixed-effects models for community responses to simulated global change, including plot and year as random factors. AICc values for models are listed, beginning with the most complex model (factorial: nutrient × temperature manipulation)
and moving backward until the best model is found. This process tests first an additive model (nutrient + temperature manipulation), then univariate models (nutrient manipulation only; temperature manipulation only) and finally a random effects model including only the random factors. The AICc of the best model is highlighted in bold, and the marginal R2(explaining variation from only the fixed factors) of the best model is also listed.
AICc values for models in backward stepwise selection Marginal R2of best model Response Factorial Additive Nutrient Temperature Random
Total community Cover 73.53 76.92 0.45
Richness 48.68 45.68 47.21 44.95 45.69 0.07
Diversity 39.63 36.91 33.32 32.53 29.17 n.a.
Evenness −111.86 −117.98 −125.69 −125.73 −133.43 n.a.
Cushion plants Cover 123.52 125.79 0.41
Deciduous shrubs Cover 167.47 165.25 164.49 165.33 165.30 0.11
Diversity 72.19 68.59 64.89 74.37 71.81 0.24
Evergreen shrubs Cover 200.60 199.21 197.77 205.27 204.55 0.32
Diversity 63.43 60.77 57.07 57.08 53.67 n.a.
Forbs Cover 160.80 159.16 157.18 159.26 157.09 n.a.
Diversity 82.67 80.17 79.06 76.26 75.38 n.a.
Grasses Cover 197.65 198.01 0.34
Sedges Cover 154.35 152.76 150.74 155.64 154.14 0.15
RESULTS
The model selection results for mixed-effects models of all total community and functional group responses are summarized inTable 1. Treatment effects from linear comparisons within the selected model are described below.
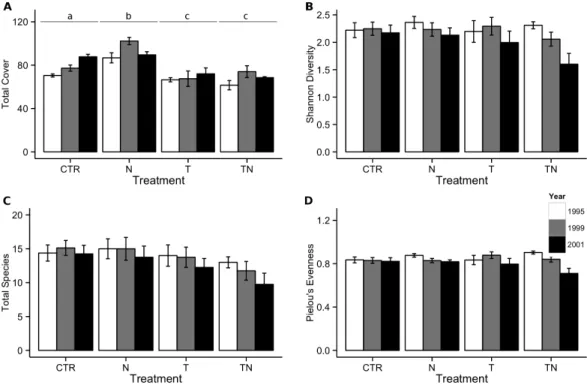
Seven years of experimental warming and nutrient addition had a significant interactive effect on total cover of vegetation in the plots. All experimental treatments showed cover differences from the control plots, with the temperature and combined temperature and nutrient treatments decreasing compared to the control plots while the nutrient-only treatment showed a cover increase compared to the control plots (Fig. 1A). A total of 51 species were observed in plots over the course of the seven-year experiment, with individual counts per plot ranging from 6 to 21 species at a given time point. The difference between species richness in warmed and unwarmed plots was only marginal (linear comparisons, p = 0.07;Fig. 1B). This corresponded to no significant effects of any of the treatments on either Shannon diversity (Fig. 1C) or Pielou’s evenness (Fig. 1D).
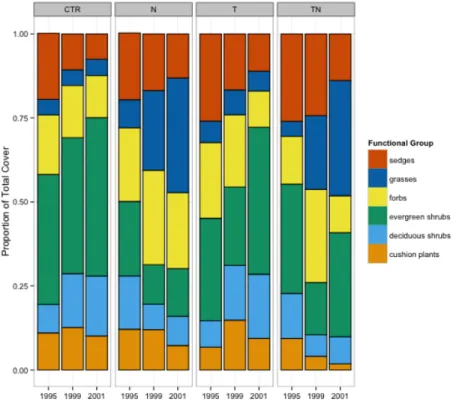
Drastic shifts in dominance structure were observed in the nutrient and combined temperature and nutrient manipulation plots over the course of the 7-year experiment (Fig. 2), with grasses increasing in the nutrient and nutrient plus warming treatments, while sedges and deciduous shrubs decreased in cover.
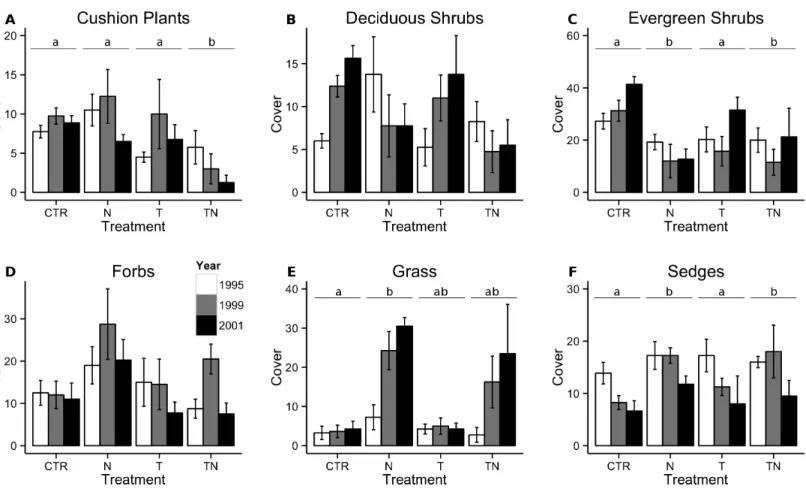
Cover of cushion plants responded to a significant interaction between the nutrient and temperature manipulations, with the cover in the combined treatment plots significantly lower than in any of the other plots (linear comparisons, p< 0.001;Fig. 3A). In both 1999
Figure 1 Total cover, species richness, Shannon’s diversity, and Pielou’s evenness within the meadow community. Total cover (A), species richness (B), Shannon’s diversity (C), and Pielou’s evenness (D) in
the control (CTR), nutrient addition (N), warming (T), and combined nutrient addition and warming (TN) plots in the meadow community. Means are separated by measurement year, with a white bar for 1995, a grey bar for 1999, and a black bar for the final measurement in 2001. Labels for treatments in (A) represent groupings based on significant(p < 0.05) differences from multiple comparisons performed within the generalized linear mixed-effects model. There were no significant differences between treat-ments for the other response variables. Error bars represent one standard error of the mean within each treatment and year.
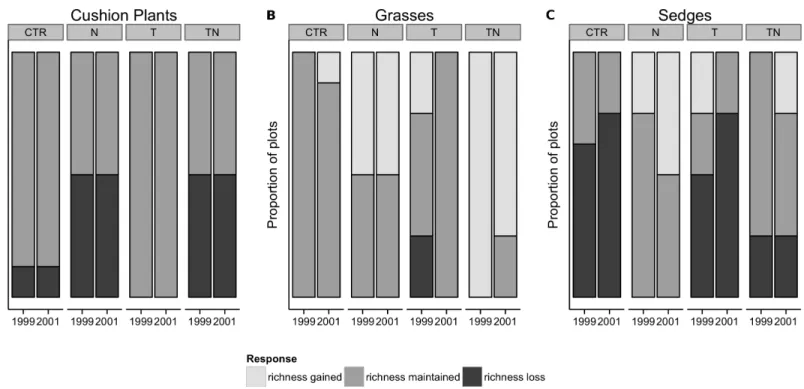
and 2001, 20% of plots across the entire experiment had decreased in species richness com-pared to 1995, whereas the rest had maintained the original number of species (Fig. 5A). No plots gained species of cushion plants. The distribution of the losses between treatment types was not different than that expected by chance (Fisher’s exact test, p > 0.20).
The effect of nutrient manipulation was included in the best model for cover of both deciduous and evergreen shrubs. For deciduous shrubs, there was no significant difference between cover in plots with and without the nutrient treatment (linear comparisons, p = 0.07,Fig. 3B), however diversity declined significantly in the plots which had added nutri-ents (linear comparisons, p< 0.001;Fig. 4A). Conversely, evergreen shrub cover decreased significantly with the nutrient manipulation (linear comparisons, p< 0.001,Fig. 3C), but diversity of evergreen shrubs showed no response to any of the treatments (Fig. 4B).
Forb cover (Table 2,Fig. 3D) and diversity (Fig. 4C) in the plots was unaffected by any of the manipulations.
Grass cover responded to a significant interaction between the nutrient and temperature manipulation. Grass cover increased in the nutrient treatment compared to the control treatment (linear comparisons, p = 0.004), with intermediate abundance in the other
Figure 2 Cover of different functional groups, by treatment and year. Percentage of the total cover
within the plots made up by six different functional groups, by treatment and year.
plots (Fig. 3E). By 1999, seven of the treatment plots had increased in richness but none of the control plots had changed in richness, which represented a significant effect of the perturbations (Fisher’s exact test, p = 0.002;Fig. 5B). By 2001, additional gain and loss of species richness had negated this effect (Fisher’s exact test, p > 0.05). Sedge cover increased significantly in the plots receiving nutrient amendment (linear comparisons, p = 0.01), especially in 1999 although the effect had waned by 2001 (Fig. 3F). The majority of plots either decreased in species richness or maintained the same number of species by 1999 and 2001, and the distribution of changes among the treatments was not different than that which would be predicted by the global mean (Fisher’s exact test, p> 0.10;Fig. 5C).
DISCUSSION
Total vascular plant cover in the alpine meadow increased significantly with nutrient perturbation over the seven-year experiment, maintaining the direction of its short-term response into the medium-term. The most notable responses to simulated global change came at the functional group level, where cover and diversity of some functional groups showed consistent short- and medium-term responses to perturbations (nutrient addition, warming and combined nutrient addition and warming) while after seven years of perturbations others showed either recovery from their initial responses, or intensification of those responses. In particular, the nutrient and the combined warming and nutrient treatment caused changes in the dominance structure in the meadow. Cover of grasses increased dramatically in the nutrient and the combined warming and
Figure 3 Total cover of cushion plants, deciduous shrubs, evergreen shrubs, forbs, grasses, and sedges. Total cover of cushion plants (A),
deciduous shrubs (B), evergreen shrubs (C), forbs (D), grasses (E), and sedges (F) within the plots. Bar colors and treatment codes are as inFig. 1. Letter labels above the bars for treatments, where present, indicate that linear comparisons performed within the generalized linear mixed-effects model showed significant(p < 0.05) differences between treatments. There were no significant differences between treatments for the other response variables. Error bars represent one standard error of the mean within each treatment and year.
nutrient enhancement treatments in the meadow community, with response increasing over the course of several years. This increased their relative dominance compared to the previously shown shorter-term responses (Alatalo, 1998;J¨agerbrand et al., 2009). These results are in line with other studies, as graminoids have been reported to increase dramatically in abundance in response to nutrient addition in several previous studies in alpine and arctic communities (Theodose & Bowman, 1997;Klanderud & Totland, 2005;
Calvo et al., 2005;Campioli, Leblans & Michelsen, 2012;Onipchenko et al., 2012). Sedges that traditionally have been incorporated into the “graminoids” functional group in many previous studies showed a contrasting pattern, with abundance decreasing among years in all treatments in the meadow community. This is in contrast to other studies that have indicated that sedges may have more positive responses than grasses (Bowman et al., 1993;
Walker et al., 2001;Soudzilovskaia & Onipchenko, 2005;Bassin et al., 2007). These studies have suggested that the positive response is because traits such as lower nutrient losses and slow turnover rates are more important in nutrient limited habitats for competitive success (Aerts, 1999). Furthermore, it has previously been reported that species respond differently
Figure 4 Shannon’s diversity index for deciduous shrubs, evergreen shrubs, and forbs. Shannon’s
diversity index for deciduous shrubs (A), evergreen shrubs (B), and forbs (C) within the plots. Bar colors and treatment codes are as inFig. 1. Letter labels above the bars for treatments in (A) indicate that linear comparisons performed within the linear mixed-effects model showed significant (p < 0.05) differences between treatments. There were no significant differences between treatments for (B) or (C). Error bars represent one standard error of the mean within each treatment and year.
to temperature and nutrient perturbations at different sites (Elmendorf et al., 2012;Press et al., 1998), thus the species composition of the “functional group” at a specific site may influence the community’s responses. Indeed, the functional group designation has not always yielded consistent results in global change experiments (Dormann & Woodin, 2002). In that case, a possible explanation for our contrasting results may be that the sedge species found in our meadow community might not be as responsive as the sedge species from other sites reporting a positive response for the functional group.
Previous short-term studies have found positive short-term responses of forbs to nutrient addition (Henry, Freedman & Svoboda, 1986;Bowman et al., 1993;Calvo et al., 2005;Onipchenko et al., 2012), including a five-year study in this same community (J¨agerbrand et al., 2009). However, we found that this response had disappeared after seven
Figure 5 Changes in species richness from 1995 levels for the low-diversity functional groups of cushion plants, grasses, and sedges by treatment and year. Changes in species richness from 1995 levels for the low-diversity functional groups of cushion plants (A), grasses (B), and sedges (C) by
treatment and year. Fisher’s exact test showed that for grasses (B), treatment significantly(p = 0.002) affected the gain or loss of species by 1999, but for the other functional groups the gain or loss of species within the treatments was not significantly different than predicted by the global mean.
years of perturbations. In all treatments, mean forb cover decreased to a level near or below its initial starting value. Warming also caused contrasting short- and longer-term responses: after seven years of warming the forbs had declined their cover, while having previously not responded to shorter-term treatment (J¨agerbrand et al., 2009). Contrasting responses were also found in a short-term study in the Swiss Alps, where species-specific responses of different forbs to nutrient addition varied between negative, neutral and positive (Bassin et al., 2007).
Evergreen shrubs showed a significant and complex response to nutrient addition. After seven years the cover of evergreen shrubs had recovered from the short-term negative response to the combined warming and nutrient addition that was reported in a previous study (J¨agerbrand et al., 2009), gaining their previous relative share of the dominance hierarchy in terms of cover. However, cover had increased in the control and temperature treatments over seven years, an effect which seemed to be dampened by the nutrient perturbation. Nevertheless, the appearance of a recover by evergreen shrubs is interesting as, for instance, in a four-year study in Norway the evergreen shrub Dryas octopetala lost its dominant position in the community to graminoids in response to nutrient addition and combined warming and nutrient addition (Klanderud & Totland, 2005). It has been suggested that evergreen shrubs are more likely to decline in response to nutrient addition, while deciduous shrubs are likely to increase due to the same perturbation (Chapin et al., 1995). The potential recovery of evergreen shrubs in our results is a novel finding, and
should be further examined in other long-term studies. Furthermore, we found no support for a deciduous shrub increase. Rather, deciduous shrubs cover decreased in response to both the nutrient and combined warming and nutrient addition treatments. This was caused by an initial short-term response (J¨agerbrand et al., 2009), since their relative share of the cover did not continue to decline after the five years. These results reinforce previous experimental findings that diversity of both types of shrubs are negatively affected by increasing nutrient availability (Press et al., 1998;Klanderud & Totland, 2005).
Cushion plants decreased in cover in response to nutrient and the combined warming and nutrient addition. Similarly, in high Arctic Svalbard, 5 years of nutrient addition caused significant decrease of Saxifraga oppositifolia (Robinson et al., 1998), while Silene
acaulis has been shown to respond in contrasting manner to short and medium term
nutrient addition (Alatalo & Little, 2014). If cushion plants begin to decrease in larger numbers in severe environments, this could potentially impact a wide array of species in ecosystems where they are found due to their importance as facilitator species (Cavieres & Arroyo, 2002;Molenda, Reid & Lortie, 2012).
Total species richness declined over the seven years of warming, while species richness, diversity, and evenness showed nonsignificant decreases in the combined nutrient and warming treatment. The largest decline in species diversity after seven years of perturbation was found in deciduous shrubs in response to nutrient addition and the combined warming and nutrient addition. In contrast grasses increased their species richness, almost tripling in response to the combined warming and nutrient addition, and sedges showed a nonsignificant trend of increasing species richness in response to the nutrient addition but decreasing in response to warming. A decrease in species richness due to simulated global change has also been reported in other studies. A 9-year study with experimental warming and nutrient addition in Alaskan tundra found that species richness declined by 30–50% due to losses primarily of rarer species, but this was mainly caused by loss of bryophytes, lichens and forbs (Chapin et al., 1995). In alpine Norway, four years of combined warming and nutrient addition caused a significant decline in total species richness, caused by a decline in bryophytes and lichens, while the same perturbation increased species richness of graminoids (Klanderud & Totland, 2005). In the same study species richness of forbs increased in response to nutrient addition. The contrasting results of species richness of forbs ranging from negative (Chapin et al., 1995), neutral (this study), to positive (Klanderud & Totland, 2005), suggest that the responses may be highly species-specific.
Community diversity has been shown to decrease in arctic and alpine meadows in response to nutrient addition (Theodose & Bowman, 1997;Wardle et al., 2013) and in particular in response to combined warming and fertilization (Press et al., 1998;Klanderud & Totland, 2005). Generally, this study supports the productivity–diversity relationship found across arctic habitats, with community diversity peaking in mid-productivity systems and crashing as nutrient availability increases further (Virtanen et al., 2013). This is likely due to the increasing competition in plant–plant interactions and the shifting dominance structure with grasses taking over the experimental plots and suggests that
global change in the arctic could entail not only redistribution of vegetation types, but also significant costs to biodiversity.
CONCLUSIONS
The different perturbations caused shifts in dominance hierarchies in the alpine meadow. Nutrient addition drove the community to become more dominated by grasses, sedges and forbs. Short-term responses were shown to be inconsistent in their ability to predict medium-term responses for sedges, shrubs, cushion plants and forbs. However, grasses showed consistent and very substantial response to nutrient addition over the whole period of seven years. The non-linear responses over time point out the importance of longer-term studies with repeated measurements to be able to better predict future changes. The non-linear responses also have important implications for improving modeling the future changes to global change. The different changes to warming and nutrient addition will likely have implications for trophic interactions, and may ultimately influence the access to and palatability of the forage for grazers. Depending on what anthropogenic change will be most pronounced in the future (increase in nutrient deposits, warming, or a combination of them both), different shifts in community dominance hierarchies may occur.
ACKNOWLEDGEMENTS
The authors thank the staff of Abisko Scientific Research for their help and hospitality, and Vivian and Bj¨orn Ald´en for assistance in the field. The authors thank Hannah Buckley and two anonymous reviewers for constructive comments that improved the manuscript.
ADDITIONAL INFORMATION AND DECLARATIONS
FundingThis study was financially supported by Oscar och LiIli Lamms Minne to JMA. The funder had no role in study design, data collection and analysis, decision to publish, or preparation of the manuscript.
Grant Disclosures
The following grant information was disclosed by the authors: Oscar och LiIli Lamms Minne.
Competing Interests
The authors declare that they have no competing interests. Annika K. J¨agerbrand is an employee of the VTI, Swedish National Road and Transport Research Institute.
Author Contributions
• Juha M. Alatalo conceived and designed the experiments, performed the experiments, wrote the paper, reviewed drafts of the paper.
• Chelsea J. Little analyzed the data, wrote the paper, prepared figures and/or tables, reviewed drafts of the paper.
• Annika K. J¨agerbrand performed the experiments, reviewed drafts of the paper. • Ulf Molau conceived and designed the experiments, performed the experiments,
reviewed drafts of the paper. Field Study Permissions
The following information was supplied relating to field study approvals (i.e., approving body and any reference numbers):
Our research did not require a permit. Supplemental Information
Supplemental information for this article can be found online athttp://dx.doi.org/ 10.7717/peerj.406.
REFERENCES
Aerts R. 1999. Interspecific competition in natural plant communities: mechanisms, trade-offs and plant–soil feedbacks. Journal of Experimental Botany 50:29–37DOI 10.1093/jxb/50.330.29. Alatalo JM. 1998.Climate change: impacts on structure and biodiversity of subarctic plant
communities. Sweden: G¨oteborg University.
Alatalo JM, Little CJ. 2014. Simulated global change: contrasting short and medium term growth and reproductive responses of a common alpine/Arctic cushion plant to experimental warming and nutrient enhancement. SpringerPlus 3:Article 157DOI 10.1186/2193-1801-3-157.
Arft AM, Walker MDM, Gurevitch J, Alatalo JM, Bret-Harte MS, Dale M, Diemer M, Gugerli F, Henry GHR, Jones MH, Hollister RD, J ´onsd ´ottir IS, Laine K, L´evesque E, Marion GM, Molau U, Mølgaard P, Nordenh¨all U, Raszhivin V, Robinson CH, Starr G, Stenstr¨om A, Stenstr¨om M, Totland Ø, Turner PL, Walker LJ, Webber PJ, Welker JM, Wookey PA. 1999. Responses of tundra plants to experimental warming: meta-analysis of the international tundra experiment. Ecological Monographs 69:491–511.
Bassin S, Volk M, Suter M, Buchmann N, Fuhrer J. 2007. Nitrogen deposition but not ozone affects productivity and community composition of subalpine grassland after 3 yr of treatment. The New Phytologist 175:523–534DOI 10.1111/j.1469-8137.2007.02140.x.
Bates D, Maechler M, Bolker B. 2012. lme4:linear mixed-effects models using S4 classes. R package version 0.999999-0. Available athttp://CRAN.R-project.org/package0lme4.
Bowman WD, Theodose TA, Schardt JC, Conant RT. 1993. Constraints of nutrient availability on primary production in two alpine tundra communities. Ecology 74:2085–2097
DOI 10.2307/1940854.
Callaghan TV, Jonasson S. 1995. Implications for changes in arctic plant biodiversity from environmental manipulation experiments. In: Chapin FSI, K¨orner C, eds. Arctic and alpine biodiversity: patterns, causes and ecosystem consequences. Berlin: Springer, 151–166.
Callaghan TV, Jonasson C, Thierfelder T, Yang Z, Heden˚as H, Johansson M, Molau U,
Van Bogaert R, Michelsen A, Olofsson J, Gwynn-Jones D, Bokhorst S, Phoenix G, Bjerke JW, Tømmervik H, Christensen TR, Hanna E, Koller EK, Sloan VL. 2013. Ecosystem change and stability over multiple decades in the Swedish subarctic: complex processes and multiple drivers. Philosophical Transactions of the Royal Society B: Biological Sciences 368:Article 20120488
Calvo L, Alonso I, Fern`andez A, De Luis E. 2005. Short-term study of effects of fertilisation and cutting treatments on the vegetation dynamics of mountain heathlands in Spain. Plant Ecology 179:181–191DOI 10.1007/s11258-004-7511-3.
Campioli M, Leblans N, Michelsen A. 2012. Twenty-two years of warming, fertilisation and shading of subarctic heath shrubs promote secondary growth and plasticity but not primary growth. PLoS ONE 7:e34842DOI 10.1371/journal.pone.0034842.
Capers RS, Stone AD. 2011. After 33 years, trees more frequent and shrubs more abundant in northeast US alpine community. Arctic, Antarctic, and Alpine Research 43:495–502
DOI 10.1657/1938-4246-43.4.495.
Cavieres L, Arroyo M. 2002. Nurse effect of Bolax gummifera cushion plants in the alpine vegetation of the Chilean Patagonian Andes. Journal of Vegetation Science 13:547–554. Chapin FI, Shaver G, Giblin A, Nadelhoffer K, Laundre J. 1995. Responses of arctic tundra to
experimental and observed changes in climate. Ecology 76:694–711DOI 10.2307/1939337. Day TA, Ruhland CT, Strauss SL, Park JH, Krieg ML, Krna MA, Bryant DM. 2009. Response of plants and the dominant microarthropod, Cryptopygus antarcticus, to warming and contrasting precipitation regimes in Antarctic tundra. Global Change Biology 15:1640–1651
DOI 10.1111/j.1365-2486.2009.01919.x.
Dormann C, Woodin S. 2002. Climate change in the Arctic? using plant functional types in a meta-analysis of field experiments. Functional Ecology 16:4–17
DOI 10.1046/j.0269-8463.2001.00596.x.
Elmendorf SC, Henry GHR, Hollister RD, Alatalo J, Bj¨ork RG, Bjorkman AD, Callaghan TV, Collier LS, Cooper EJ, Cornelissen JHC, Day TA, Fosaa AM, Gould WA, Gr´etarsd ´ottir J, Harte J, Hermanutz L, Hik DS, Hofgaard A, Jarrad F, J ´onsd ´ottir IS, Keuper F, Klanderud K, Klein JA, Koh S, Kudo G, Lang SI, Loewen V, May JL, Mercado J, Michelsen A, Molau U, Myers-Smith IH, Oberbauer SF, Pieper S, Post E, Rixen C, Robinson CH, Schmidt NM, Shaver GR, Stenstr¨om A, Tolvanen A, Totland O, Troxler T, Wahren C-H, Webber PJ, Welker JM, Wookey PA. 2012. Global assessment of experimental climate warming on tundra vegetation: heterogeneity over space and time. Ecology Letters 15:164–175
DOI 10.1111/j.1461-0248.2011.01716.x.
Foster BL, Gross KL. 1998. Species richness in a successional grassland: effects of nitrogen enrichment and plant litter. Ecology 79:2593–2602
DOI 10.1890/0012-9658(1998)079[2593:SRIASG]2.0.CO;2.
Graglia E, Jonasson S, Michelsen A, Schmidt IK, Havstroim M, Gustavsson L. 2001. Effects of environmental perturbations on abundance of subarctic plants after three, seven and ten years of treatments. Oikos 24:5–12.
Grime J. 1998. Benefits of plant diversity to ecosystems: immediate, filter and founder effects. Journal of Ecology 86:902–910DOI 10.1046/j.1365-2745.1998.00306.x.
Grimm NB, Chapin FS, Bierwagen B, Gonzalez P, Groffman PM, Luo Y, Melton F, Nadelhoffer K, Pairis A, Raymond PA, Schimel J, Williamson CE. 2013. The impacts of climate change on ecosystem structure and function. Frontiers in Ecology and the Environment 11:474–482DOI 10.1890/120282.
Henry GHR, Freedman B, Svoboda J. 1986. Effects of fertilization on three tundra plant communities of a polar desert oasis. Canadian Journal of Botany 64:2502–2507
Hollister RD, Webber PJ, Tweedie CE. 2005. The response of Alaskan arctic tundra to experimental warming: differences between short- and long-term responses. Global Change Biology 11:525–536DOI 10.1111/j.1365-2486.2005.00926.x.
Hothorn T, Bretz F, Westfall P. 2008. Simultaneous inference in general parametric models. Biometrical Journal 50:346–363DOI 10.1002/bimj.200810425.
IPCC. 2007. Parry ML, ed.Climate Change 2007: impacts, adaptation and vulnerability: contribution of Working Group II to the fourth assessment report of the Intergovernmental Panel on Climate Change, Vol. 4. Cambridge: Cambridge University Press.
J¨agerbrand AK, Alatalo JM, Chrimes D, Molau U. 2009. Plant community responses to 5 years of simulated climate change in meadow and heath ecosystems at a subarctic-alpine site. Oecologia 161:601–610DOI 10.1007/s00442-009-1392-z.
Jump AS, Pe˜nuelas J. 2005. Running to stand still: adaptation and the response of plants to rapid climate change. Ecology Letters 8:1010–1020DOI 10.1111/j.1461-0248.2005.00796.x.
Kaufman DS, Schneider DP, McKay NP, Ammann CM, Bradley RS, Briffa KR, Miller GH, Otto-Bliesner BL, Overpeck JT, Vinther BM. 2009. Recent warming reverses long-term arctic cooling. Science 325:1236–1239DOI 10.1126/science.1173983.
Klanderud K, Totland Ø. 2004. Habitat dependent nurse effects of the dwarf-shrub Dryas octopetala on alpine and arctic plant community structure. Euroscience 11:410–420. Klanderud K, Totland Ø. 2005. Simulated climate change altered dominance hierarchies and
diversity of an alpine biodiversity hotspot. Ecology 86:2047–2054DOI 10.1890/04-1563. Klein JA, Harte J, Zhao X-Q. 2004. Experimental warming causes large and rapid species
loss, dampened by simulated grazing, on the Tibetan Plateau. Ecology Letters 7:1170–1179
DOI 10.1111/j.1461-0248.2004.00677.x.
Marion G, Henry GHR, Freckrnan DW, Johnstone I, Jones G, Jones MH, Levesque E, Molau U, Molgaard P, Parsons AN, Svoboda J, Virgina RA. 1997. Open-top designs for manipulating field temperature in high-latitude ecosystems. Global Change Biology 3:20–32
DOI 10.1111/j.1365-2486.1997.gcb136.x.
May JL, Hollister RD. 2012. Validation of a simplified point frame method to detect change in tundra vegetation. Polar Biology 35:1815–1823DOI 10.1007/s00300-012-1224-1.
Mazerolle MJ. 2013.AICcmodavg: model selection and multimodel inference based on (Q)AIC(c), version 1.28. Available athttp://cran.r-project.org/package=AICcmodavg.
McManus KM, Morton DC, Masek JG, Wang D, Sexton JO, Nagol JR, Ropars P, Boudreau S. 2012. Satellite-based evidence for shrub and graminoid tundra expansion in northern Quebec from 1986 to 2010. Global Change Biology 18:2313–2323
DOI 10.1111/j.1365-2486.2012.02708.x.
Molau U. 1993. Relationships between flowering phenology and life history strategies in tundra plants. Arctic and Alpine Research 25:391–402DOI 10.2307/1551922.
Molau U, Alatalo JM. 1998. Responses of subarctic-alpine plant communities to simulated environmental change: biodiversity of bryophytes, lichens, and vascular plants. Ambio 27:322–329.
Molenda O, Reid AM, Lortie CJ. 2012. The alpine cushion plant Silene acaulis as foundation species: a bug’s-eye view to facilitation and microclimate. PLoS ONE 7:e37223
DOI 10.1371/journal.pone.0037223.
Morris W, Pfister C, Tuljapurkar S, Haridas CV, Boggs CL, Boyce MS, Bruna E, Church D, Coulson T, Doak D, Forsyth S, Gaillard J, Horwitz C, Kalisz S, Kendall B, Knight T, Lee C,
Menges ES. 2008. Longevity can buffer plant and animal populations against changing climatic variability. Ecology 89:19–25DOI 10.1890/07-0774.1.
Niu S, Wan S. 2008. Warming changes plant competitive hierarchy in a temperate steppe in northern China. Journal of Plant Ecology 1:103–110DOI 10.1093/jpe/rtn003.
Oksanen J, Blanchet FG, Kindt R, Legendre P, Minchin PR, O’Hara RB, Simpson GL,
Solymos P, Stevens MH, Wagner H. 2012.vegan: Community ecology package, version 2.0-5. Available athttp://cran.r-project.org/package=vegan.
Olsen SL, Klanderud K. 2014. Biotic interactions limit species richness in an alpine plant community, especially under experimental warming. Oikos 123:71–78
DOI 10.1111/j.1600-0706.2013.00336.x.
Olsen SL, Sandvik SM, Totland Ø. 2013. Influence of twoN-fixing legumes on plant community properties and soil nutrient levels in an alpine ecosystem. Arctic, Antarctic, and Alpine Research 45:363–371DOI 10.1657/1938-4246-45.3.363.
Onipchenko VG, Makarov MI, Akhmetzhanova AA, Soudzilovskaia NA, Aibazova FU, Elkanova MK, Stogova AV, Cornelissen JHC. 2012. Alpine plant functional group responses to fertiliser addition depend on abiotic regime and community composition. Plant and Soil 357:103–115DOI 10.1007/s11104-012-1146-2.
Pajunen AM, Oksanen J, Virtanen R. 2011. Impact of shrub canopies on understorey vegetation in western Eurasian tundra. Journal of Vegetation Science 22:837–846
DOI 10.1111/j.1654-1103.2011.01285.x.
Parmesan C. 2006. Ecological and evolutionary responses to recent climate change.Annual Review of Ecology, Evolution, and Systematics 37:637–669
DOI 10.1146/annurev.ecolsys.37.091305.110100.
Polunin N. 1951. The real arctic: suggestions for its delimitation, subdivision, and characterization. Journal of Ecology 39:308–315DOI 10.2307/2257914.
Press MC, Potter JA, Burke MJW, Callaghan TV, Lee JA. 1998. Responses of a subarctic dwarf shrub heath community to simulated environmental change. Journal of Ecology 86:315–327
DOI 10.1046/j.1365-2745.1998.00261.x.
R Core Team. 2013. R: A language and environment for statistical computing.
Robinson CH, Wookey PA, Lee JA, Callaghan TV, Press MC. 1998. Plant community responses to simulated environmental change at a high arctic polar semi-desert. Ecology 79(3):856–866
DOI 10.1890/0012-9658(1998)079[0856:PCRTSE]2.0.CO;2.
Roy J, Albert CH, Ibanez S, Saccone P, Zinger L, Choler P, Cl´ement J-C, Lavergne S,
Geremia RA. 2013. Microbes on the cliff: alpine cushion plants structure bacterial and fungal communities. Frontiers in Microbiology 4:Article 64.
Sala OE, Chapin F, Armesto J. 2000. Global biodiversity scenarios for the year 2100.Science 287:1770–1774DOI 10.1126/science.287.5459.1770.
Soudzilovskaia N, Onipchenko VG. 2005. Experimental investigation of fertilization and irrigation effects on an alpine heath, northwestern Caucasus, Russia. Arctic, Antarctic, and Alpine Research 37:602–610DOI 10.1657/1523-0430(2005)037[0602:EIOFAI]2.0.CO;2. Theodose T, Bowman W. 1997. Nutrient availability, plant abundance, and species diversity in
two alpine tundra communities. Ecology 78:1861–1872
DOI 10.1890/0012-9658(1997)078[1861:NAPAAS]2.0.CO;2.
Van Wijk MT, Clemmensen KE, Shaver GR, Williams M, Callaghan TV, Chapin FSI, Cornelissen JHC, Gough L, Hobbie SE, Jonasson S, Lee JA, Michelsen A, Press MC,
Richardson SJ, Rueth H. 2004. Long-term ecosystem level experiments at Toolik Lake, Alaska, and at Abisko, Northern Sweden: generalizations and differences in ecosystem and plant type responses to global change. Global Change Biology 31:105–123
DOI 10.1111/j.1365-2486.2003.00719.x.
Virtanen R, Grytnes J-A, Lenoir J, Luoto M, Oksanen J, Oksanen L, Svenning J-C. 2013. Productivity–diversity patterns in arctic tundra vegetation. Ecography 36:331–341
DOI 10.1111/j.1600-0587.2012.07903.x.
Walker MD. 1996. Community baseline measurements for ITEX studies. In: Molau U, Miolgaard P, eds. ITEX manual. 2nd edition. Copenhagen: Danish Polar Centre, 39–41.
Walker MD, Walker D, Theodose T, Webber PJ. 2001. The vegetation: hierarchical
species-environment relationships. In: Bowman W, Seastedt T, eds. Structure and function of an alpine ecosystem: Niwot Ridge, Colorado. Oxford: Oxford University Press, 99–127. Wardle DA, Gundale MJ, Jaderlund A, Nilsson M-C. 2013. Decoupled long-term effects of
nutrient enrichment on aboveground and belowground properties in subalpine tundra. Ecology 94:904–919DOI 10.1890/12-0948.1.