IN
DEGREE PROJECT MEDICAL ENGINEERING, SECOND CYCLE, 30 CREDITS
,
STOCKHOLM SWEDEN 2017
Molecular Dynamics Simulations
of Axonal Membrane in Traumatic
Brain Injury
ZOHREH ALAEI
KTH ROYAL INSTITUTE OF TECHNOLOGY SCHOOL OF TECHNOLOGY AND HEALTH
KTH ROY AL IN STITUTE OF TEC HNO LOGY I N F O R M A T I O N A N D C O M M U N I C A T I O N T E C H N O L O G Y
Molecular dynamics simulations of axonal membrane in
traumatic brain injury
Thesis for Master Degree
By
Zohreh Alaei
Principal Supervisor:
Assoc. Prof. Alessandra Villa
Karolinska Institutet
Department of Bioscience and Nutrition
Reviewer:
Prof. Svein Kleiven
Kungliga Tekniska Högskolan
School of Technology and Health
Any man who afflicts the human race with ideas must be prepared to see
them misunderstood.
Abstract
The following project presents in silico investigation of axonal damage in Diffuse Axonal Injury (DAI). When axons face a shear force, orientation of the lipids in the axonal membrane gets disrupted. Depending on the value of the force, a tensile strain causes the axons to get partially or fully deformed and in some cases a pore forms in the membrane. Using Molecular Dynamic (MD) simulation and a coarse grain model, a series of bilayers with various bilayer structure (single bilayer, parallel bilayer and cylindrical bilayer) and similar composition to biological axonal membrane were simulated. This was initially done to investigate the strain rate dependency of the bilayers, and their viscoelastic ability on returning to their original shape from their deformed forms. To achieve this, various deformation velocities were applied to the bilayers reaching 20% strain and relaxing the bilayer after. Additionally, the bilayers were deformed further until they reached a pore. It was found that the bilayers can almost recover from their deformed forms to their original length when they were deformed at 20% strain level. In conjunction, no correlation between the deformation velocity and lipid deformation was observed. Further, it was found that bilayers with different lipid percentage to axonal bilayer has different strain values for water penetration and for pore formation. The strain value for cylindrical bilayer was found very high compared to the strain values found in vitro. The strain for pore formation of parallel and single bilayer was found to be around 80% to 90% and for water penetration was found to be 70% for single bilayer and 50% for parallel bilayer. A slight difference in strain for pore formation between single and parallel bilayer was found which showed the bilayer structure can play a role in simulation results. The effect of the length in the simulations results was also observed where shorter bilayers showed lower strain for pore formation compared to longer bilayers.
Keywords
Traumatic brain injury, diffuse axonal injury, molecular simulation, axonal bilayer, strain, shear force, nano-scale deformation, lipid bilayer
Sammanfattning
De vanligaste orsakerna till Traumatiska hjärnskador är fallolyckor (TBI), följt av trafikolyckor och misshandel. Diffus axonal skada (DAI) är en form av traumatisk hjärnskada där axonerna skadas i mikroskopisk nivå. Flera in vitro och in vivo undersökningar har ägnats åt detta området för att förstå hur axonerna agerar mot en deformation. Molekylär Dynamisk (MD) simulering som en beräknings vektyg tillåter forskare att studera DAI i molekylär nivå. Det aktuella projektet simulerade tre olika strukturer av lipidbiskiktet för att undersöka hur axonerna svarar mot olika deformationshastigheter. Projektet också visade att det är möjligt för lipidbiskiktet att återhämta sig efter deformation.
Värdena som hittades för porbildning är i överens med in vitro resultatet och när det finns en 20% deformation, kan membranerna återhämta sig för att uppnå sin ursprungliga längd och form. Projektet konstaterades också att membranens sammansättning och deras längd kan ha en effekt på resultaten för porbildning och vattenpenetration
Nyckelord
Traumatisk hjärnskada, diffus axonskada, molekylär simulering, axonal
Acknowledgment
I would like to thank my supervisor Alessandra Villa, for her expertise, guidance, encouragement and advice she has provided throughout my time as her student.
I would like to express my deepest gratitude to my loving parents who poured their love and sacrificed their lives so I can one day reach my dreams and to my loving sister who was always my best friend.
I would like to extend my thanks to Svein Kleiven, Yossa Dwi Hartono, Chiara Giordano and Annaclaudia Montanino.
List of Figures and Tables
Figure 1. Bilayer structure. ... 4 Figure 2. Representative schematic of the deformation. ... 6 Figure 3. The single bilayer and the profile density. ... 7 Figure 4. The parallel bilayer and the profile density. ... 7 Figure 5. Deformed bilayer. ... 8 Figure 6. Density profile of POPE. ... 9 Figure 7. Density profile of CHOL. ... 9 Figure 8. Relaxation graph of parallel bilayer. ... 10 Figure 9. The profile density of POPE after relaxation. ... 11 Figure 10. The profile density of POPC after relaxation ... 12 Figure 11. The swellings in the cylindrical bilayer ... 13 Figure 12. Pore formation. ... 14 Figure 13. Pore formation in cylindrical bilayer ... 14 Table 1: Composition of axonal, plasma and simple bilayer ... 4 Table 2. Summary of deformation simulations. ... 6Table of Contents
1 Introduction ... 1
2 Material and methods ... 3
2.1 System setup ... 3
2.2 Deformation simulations ... 5
2.3 Analysis method ... 6
3 Results ... 8
3.1 Single and parallel bilayer deformation ... 8
3.2 Relaxation ... 10
3.3 Pore formation ... 13
3.3.1 Effect of length and structure ... 13
3.3.2 Effect of composition ... 15
4 Discussion and conclusions ... 16
5 Bibliography ... 18 Appendix A ... A1
1
1 Introduction
Traumatic brain injury (TBI) has a profound impact in the rate of mortality and disability in the world [1]. This type of injury is resulted from an application of a shear mechanical force to the head and causing different types of damages to the brain [2]. In vitro and in vivo researches (in cellular level and human testing) has increased knowledge on the process and different stages of the injuries arising from TBI [3]. Diffuse Axonal Injury (DAI) as a type of TBI covers the second largest percentages of head injuries [4] [5]. Under TBI, when the shear force applied to the brain passes a certain threshold, it causes axonal damages at microscopic level [6]. The mechanism of the injury is a rapid acceleration-deceleration of the head. It makes some parts of the brain to move at a slower rate compared to the other parts, causing a shear and tensile force within the brain [7] [3]. Consequently, a strain deformation is manifested among the axons and depending on the value of the shear force, the axons may get deformed. In many cases, one or several pores might be formed on the membrane of the axons. This leads to dysfunctionality of the axons and the normal function of the brain gets disrupted. To understand the response of the membranes to the mechanical stress in details, several studies have been dedicated to stretching the axons in
vitro. These studies investigate how durable the axons are towards
deformation and at what strain level it is possible for axons to recover from the stretch due to the application of the mechanical force. These studies have shown different values for strain leading the axons towards secondary and primary axotomy. The threshold for primary axotomy was known to be around 30% tensile strain [8] [9] [10]. However, in recent studies, Smith et al. has shown the tensile strain threshold for primary axotomy is over 65% [10] and according to Bain and Meaney, the functional impairment strain is between 9% to 47% [11].
The viscoelastic properties of the axons allow them to recover to their pre-stretch orientation and shape. Although there is a threshold for deformed axons allowing them to recover to their original shape. According to a study done by Bain and Meaney [11], the optimal strain threshold for axons to recover and reorient their shape to their original pre-stretched shape is 20%. Despite the in vitro and in vivo studies, there is an extensive interest to study axonal damage at microscopic level to shine a new light at this enigmatic field. Molecular Dynamics (MD) simulation as a computational tool along with coarse grain modelling allows scientists to simulate biological membranes at microscopic level in order of micro seconds. MD can help to examine the damages and rupture of the membranes due to external forces to investigate the process of TBI. Applying a deformation velocity to a phospholipid bilayer in direction parallel to the length of the bilayer will deform them, replicating the damage in DAI. The phospholipid bilayer will eventually form a pore for water molecules to escape inside of the bilayer. This can help us to understand at what strain level, primary axotomy is more likely to happen. In this project, it is also intended to evaluate 20% strain inspect on whether the axonal bilayer with similar lipid composition to biological axonal membrane can
2 return to their original shape. The composition effect of the bilayer and final size effect will be studies. The final size effect will be investigated by simulating a bilayer with shorter length to the original. To evaluate the composition effect, bilayers with composition of plasma bilayer and pure lipid bilayers will be simulated. Deformation will be applied to these bilayers to find the strain level of pore formation. Then they will be compared to axonal bilayers.
3
2 Material and methods
2.1 System setupAll MD simulations were performed using GROMACS version 4.5.5 [12] with standard Martini 2.0 force field [13]. Visual Molecular Dynamics (VMD) [14] was used to visualize all the simulated structures. Three different bilayer structures (single bilayer, parallel bilayer and cylindrical bilayer) were simulated to observe the response of the bilayers towards the deformations (See figure1). These structures are based on the biological structure of the axons. Single bilayer consists of an upper and lower leaflet of lipids surrounded by water and ions. Parallel bilayer consists of two single bilayers with water in between the bilayers, equivalent to a cut from upper and lower surface area of the axons. The third structure was simulated in a cylindrical shape to have a similar geometrical shape as axons.
For single bilayer, INSANE (INSert membrANE) [15], a python script was primarily used to setup the bilayers of various lipid compositions and the solvents. For the complex structures, parallel bilayer and cylindrical bilayer, the GROMACS tools were used to build the structures from the single bilayer. The systems were energy-minimized (steepest descent, 1000 steps) and simulated for 0.04 ns using a time step of 40 fs. Then the systems were equilibrated for 1 ns using a short time step of 20 fs at constant temperature and pressure using Berendsen thermostat and barostat. After equilibration, the production simulations were done for 100 ns using semi-isotropic pressure to maintain the system at 1 bar using Parrinello–Rahman barostat, a time constant of 12 ps, compressibility of 3×10%& bar-1 and temperature of
295K with V-scale temperature coupling.
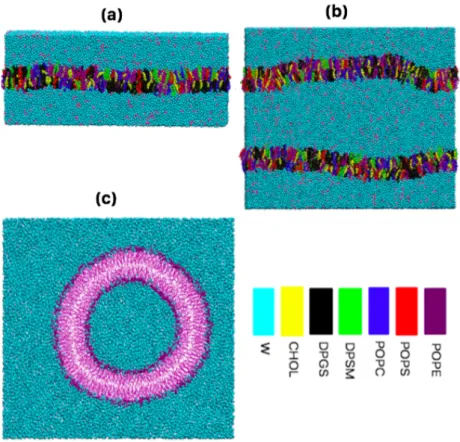
The lipid composition of the axonal bilayers was chosen similar to myelin sheath. The percentage of the lipids are cholesterol (CHOL:23%) phosphatidylethanolamine (POPE:16%), phosphatidylserine (POPS:10%), phosphatidylcholine (POPC:12%), sphingomyelin (DPSM:9%) and glycolipid (DPGS:29%) [16]. However, for cylindrical bilayer only POPE has been used to simplify the structure in able to build a cylindrical bilayer.
The number of lipids in single bilayer for POPE, POPS, POPC, DPSM, DPGS, and CHOL are 394, 243, 296, 222, 916 and 592 respectively. The number of water molecules are 60680 and ions 4146. In parallel bilayer the mount of lipids and water molecules are almost double the amount of single bilayer yielding 783, 487, 588, 444, 1420, 1484 lipids for POPE, POPS, POPC, DPSM, DPGS, and CHOL respectively. For cylindrical bilayer, the number of POPE used to build the cylindrical bilayer is 1824. The sizes of the boxes in X, Y and Z-directions for single bilayer are 44.66915nm, 13.4 nm and 17.1076 nm respectively and for the parallel bilayer are 44.66915, 13.4 34.51190 nm for X, Y and Z respectively. The average area per lipid for both single and parallel bilayer is 0.3909 nm2/lipid. The cylindrical bilayer has an average inner
diameter of 11.3 nm and an outer diameter of 20.2nm.
4
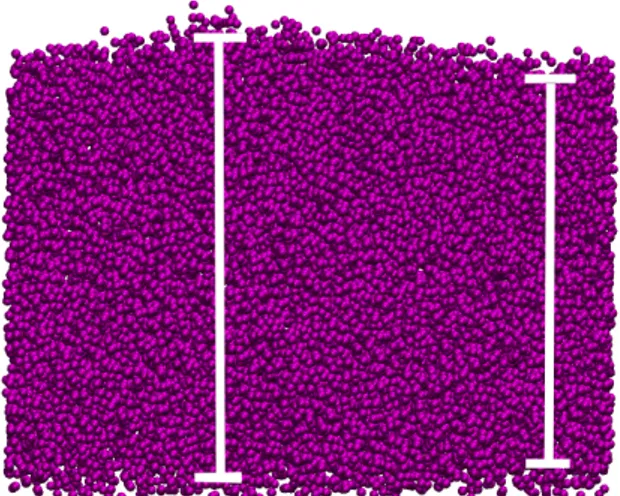
Figure 1. The pictures represent the 3 different bilayer structure is simulated (a) single bilayer. (b) parallel bilayer. (c) cylindrical bilayer (The single and parallel bilayers have lipid composition of axonal membrane and the cylindrical bilayer is pure phosphatidylethanolamine (POPE). The color code for lipids, cholesterol and water molecules.
Table 1: Composition of axonal, plasma and simple bilayer
Lipids % of total Lipid for AXONAL bilayer % of total Lipid for PLASMA bilayer % of total Lipid for SIMPLE bilayer Cholesterol (CHOL) 23 22 20 Phosphatidylethanolamine (POPE) 16 9 80 Phosphatidylserine (POPS) 10 5 - Phosphatidylcholine (POPC) 12 31 - Sphingomyelin (DPSM) 9 24 - Glycolipids (DPGS) 29 9 -
For a proper comparison and the validity of the values achieved from the various models of the axonal bilayers, several other single bilayers with different length and compositions were simulated. A plasma single bilayer
5 with similar length and simulation condition to axonal single bilayer were built. However, in the plasma bilayer, the percentage compositions of the lipids are 9%, 5%, 31%, 24%, 9% and 22% for POPE, POPS, POPC, DPSM, DPGS and CHOL, respectively. A single axonal bilayer with a shorter length in X-direction with the size of (13.4 14.59 18.45) nm was also built. Moreover, a simple bilayer containing only CHOL and POPE was simulated with similar length to original single bilayer. A pure phosphatidylcholine (DPPC) bilayer was simulated as well to compare the strain values achieved from cylindrical bilayer. This eliminates the effect of composition in pore formation.
All the additive simulations are simulated in similar barostatic and thermostatic simulation condition.
2.2 Deformation simulations
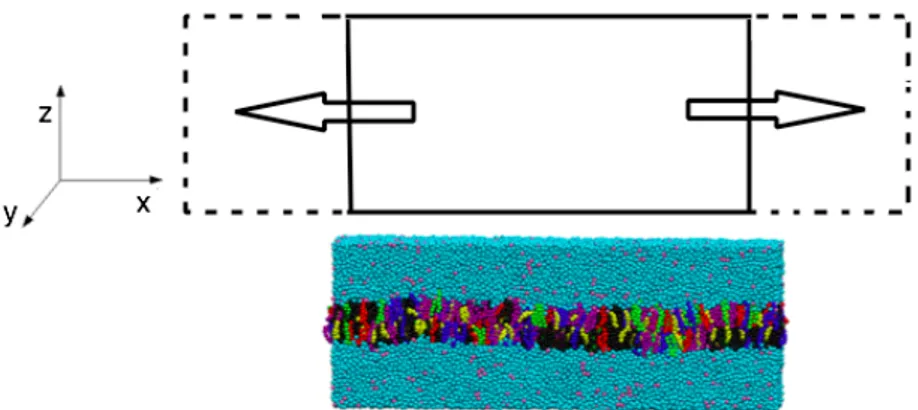
To investigate the strain threshold of the axonal bilayers and their response towards a stretch, different deformation velocities were applied to the bilayers in X-direction while the Y-direction was held constant. The lipids and the solvents (including ions) were allowed to move in response to the stretch of the box. Initially the 44 nm single and parallel bilayer and cylindrical bilayer were deformed for 20% of their original length in X-direction. The time of the deformations were chosen in accordance to the value of the deformation velocities so that at the end of the simulation a 20% (0.2) strain is achieved. The cylindrical bilayer however is deformed along Z-direction as the length of the axon is in Z-direction and X and Y-directions are coupled together as the surface area of the cylinder. Table 1 shows a summary of the deformation simulation parameters. After 20% strain, the 44-nm single and parallel bilayers and the cylindrical bilayer together with plasma, simple and pure bilayers were simulated until a pore was formed connecting the water molecules above the upper leaflet of the bilayer to the water molecules beneath the lower leaflet. The deformations were applied in similar barostatic and thermostatic condition. Figure 2 represents the schematic deformation on how the bilayers were deformed by application of the deformation velocity. Both single and parallel axonal bilayers deformed at a strain of 0.2, were relaxed. In the context of this project, relaxation is defined as removing the deformation velocities and simulating the bilayers in equilibrium condition which replicates the biological healing of the axon after the application of the traumatic force to the axons where axons have the freedom to go back to their original shape. The relaxation condition is similar for run production simulations.
6
Figure 2. representative schematic of the deformation performed single and parallel bilayer. the original structure is the solid rectangle which it will be stretched to the dashed lines.
Table 2. Summary of deformation simulations.
Case name Length of the box
(nm)
Deformation
velocity (m/s) Strain rate (s
-1) 𝐬𝐢𝐧𝐠𝐥𝐞 & 𝐩𝐚𝐫𝐚𝐥𝐥𝐞𝐥 44.7, 13.4 ,17.1 (34.5)* 0.0 5.6 ×10 5 𝐬𝐢𝐧𝐠𝐥𝐞 & 𝐩𝐚𝐫𝐚𝐥𝐥𝐞𝐥 44.7, 13.4 ,17.1 (34.5)* 0.05 1.12 ×10 7 𝐬𝐢𝐧𝐠𝐥𝐞 & 𝐩𝐚𝐫𝐚𝐥𝐥𝐞𝐥 44.7, 13.4 ,17.1 (34.5)* 0.3 6.71 ×10 7 𝐬𝐢𝐧𝐠𝐥𝐞 & 𝐩𝐚𝐫𝐚𝐥𝐥𝐞𝐥 44.7, 13.4 ,17.1 (34.5)* 1 2.24 ×10: 𝐬𝐢𝐧𝐠𝐥𝐞 & 𝐩𝐚𝐫𝐚𝐥𝐥𝐞𝐥 44.7, 13.4 ,17.1 (34.5)* 3 6.71 ×10: 𝐜𝐲𝐥𝐢𝐧𝐝𝐫𝐢𝐜𝐚𝐥 28.4, 28.4, 11.5 0.025 2.7 ×10⁷ 𝐜𝐲𝐥𝐢𝐧𝐝𝐫𝐢𝐜𝐚𝐥 28.4, 28.4, 11.5 0.05 4.34 ×10⁷ 𝐜𝐲𝐥𝐢𝐧𝐝𝐫𝐢𝐜𝐚𝐥 28.4, 28.4, 11.5 0.3 2.61 ×10: 𝐜𝐲𝐥𝐢𝐧𝐝𝐫𝐢𝐜𝐚𝐥 28.4, 28.4, 11.5 1 8.69 ×10: 𝐜𝐲𝐥𝐢𝐧𝐝𝐫𝐢𝐜𝐚𝐥 28.4, 28.4, 11.5 3 2.61 ×10@
*Parallel bilayer has different dimension in Z-direction equal to 34.5 but similar X and Y- dimension to single bilayer
2.3 Analysis method
To monitor the changes in axonal bilayers deformed for 20% of their original length, the profile densities of the lipids have been calculated before and after deformation to detect see the pattern of changes due to different deformation velocity. Calculating the water profile density can also show water penetration. Normally there is no water inside the bilayers so when the profile density is drawn along the Z-direction, the density graph drops to zero along that direction. However, in the presence of water molecules inside the bilayer, the
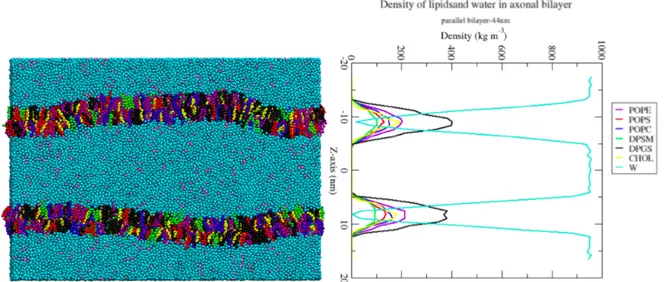
7 density along the Z-direction does not go to zero. This shows there are water molecules between the bilayer leaflets among hydrophobic tails of the lipids. To detect the pores, visual inspection (VMD) was used and from that the strain level for pore formation can be calculated. . The profile densities of all the lipids for single and parallel bilayer has been shown in figure 3 and figure 4. To also investigate on whether the bilayers can recover to their pre-stretch form after relaxation, the profile densities were calculated.
Figure 3. The single bilayer and the profile density of the lipids and the water in Z-direction. The water reaches zero because there are no water present inside the bilayer.
Figure 4. The single bilayer and the profile density of the lipids and the water in Z-direction. The water density increases since there is no lipid present in between the parallel bilayers.
8
3 Results
3.1 Single and parallel bilayer deformation
As mentioned, five different deformation velocities were applied to bilayers until they reached 20% strain. The deformation velocities stretched the bilayers parallel to the length of the axon (X-axis) while the direction stayed constant. However, the bilayer was reduced in the Z-direction to compensate the increase in length due to the stretch.
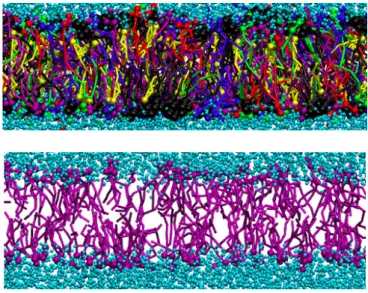
Figure 5 shows how the structure of the lipids in the bilayers gets disrupted due to application of deformation velocities. At 20% strain, no pore is present in the bilayers allowing any water molecule to penetrate inside the bilayer.
Figure 5. Top picture: the deformed bilayer at 20% strain with disrupted position of the lipids. Bottom picture: POPE (other lipids are hidden) at 20% strain which few gaps can be seen and the tails are no longer in in relaxed form.
From simulation results, it was seen that the bilayers in parallel bilayer do not act similarly when they are deformed. This also agrees with the results from relaxation of the bilayers. The single bilayer was stretched several times to investigate if there is a change in the profile density. However, the results showed that the single bilayer acts similar every time they are stretched with similar value of deformation velocity.
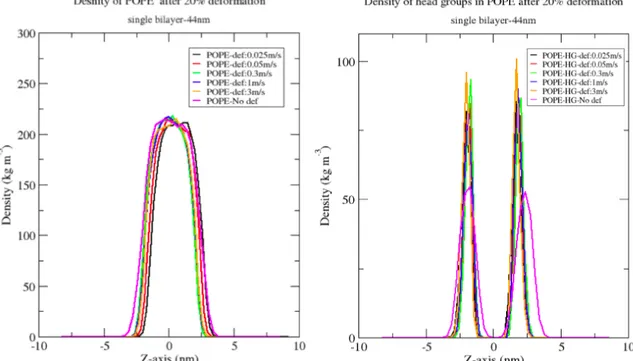
The simulations and the profile densities do not follow a particular trend to firmly adjudicate whether the slowest deformation velocity causes less damage to the bilayer than the fastest deformation velocity that we have applied the bilayers. The changes in the profile density of the lipids does not reveal too much information about changes in the position of the lipids, their interruption and their orientation after deformation. However, the changes in the profile densities are more visible when the density of the head groups of the lipids are drawn compare to the entire lipids profile density which only shows some slight changes. Figure 6 and figure 7 show the changes in density of the lipids at deformation velocities. The figures show the density profile of CHOL and POPE with their head groups after deformation. The entire lipid
9 density does not show much of a change at this level of deformation. Although the profile densities of the head groups display a better picture of how the heads of the lipids gets disoriented after deformation.
Figure 6. Density profile of POPE in single bilayer after application of various deformation velocities ( left) and the profiles density of the head groups in POPE after application of various deformation velocities in single bilayer (right).
Figure 7. Density profile of CHOL in single bilayer after application of various deformation velocities (left) and the profile density of DPGS (right) after application of various deformation velocities to the parallel bilayer.
10
3.2 Relaxation
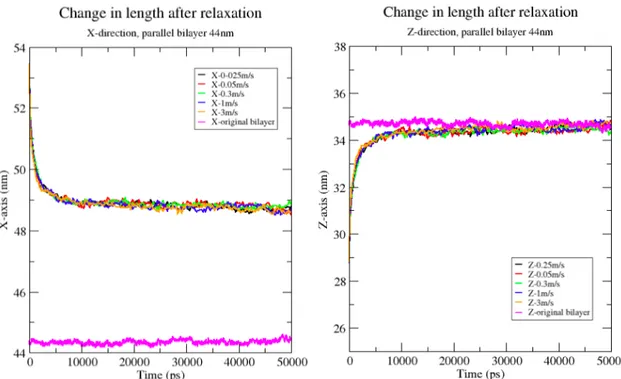
To test the viscoelastic ability of the axonal bilayers, the deformation velocity and was removed. This mimics the relaxation of the axons after the TBI. Right after simulating the bilayer under relaxation condition, the size of the single and parallel bilayers in X-direction were reduced exponentially to a stable length for both single and parallel bilayers (figure 8). The size of the box in Z-direction which was decreased during deformation process, increases in the same exponential speed reaching the original length. As the z-direction reaches the original length, the size of the box does not reach to the original length with almost 4 nm difference. However, the Y-direction which was held constant during the deformation, increases exponentially to compensate the change in the area of the bilayer. Hence, the area of the bilayer becomes similar to the original parallel and single bilayer. Using VMS, the graphs were exponentially fitted to calculate the relaxation time (decaying time constant). The decaying time constant in single bilayer is 1 ns in X-direction, 0.87 in Y-direction and for Z-Y-direction is 1.3 ns. In parallel bilayer decaying time constant is both X and Y-direction does not vary significantly.
No correlation between the deformation velocity that the bilayers were deformed and the relaxation time was found. All the bilayers follow the same path in relaxation. The following graph shows the relaxation length of the bilayer is X and Z-direction. Figure 8 represents the relaxation of the single axonal bilayer in X and Z-direction.
Figure 8. Relaxation graph of parallel bilayer in X and Z-direction after simulating the deformed bilayers in equilibrium condition.
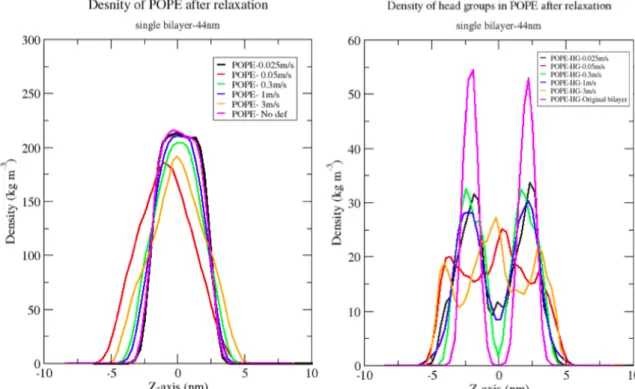
11 As the bilayers endeavour to gain their equilibrium, the lipids try to reassemble their structure to gain stability and equilibrium. The density profiles for all the relaxed density again does show a particular pattern to connect the slowest and fastest deformation velocities to the changes that is visible in the density of the lipids after relaxation. Looking closely to the density profile of the head groups of the lipids, they clearly show that the lipids cannot reposition the head groups and the tail similar to the original single and parallel bilayer. Figure 9 and 10 show that how the density of the lipids varies. However, in the single bilayer that previously was deformed with the slowest deformation velocity (o.025 m/s) shows more promising profile density. This is because the density profile is nearly similar to the original single bilayer. Although the profile density of the head groups show that heads of the lipids cannot get entirely positioned in their original pre-stretched position. This proves that although the size of the box recovers very fast, under this amount of time where the bilayer were relaxed, the lipids specially the head groups do not fully recover.
Figure 9. The profile density of POPE (left) shows that the bilayer deformed with the slowest deformation velocity, relaxes better to its original positions. The density profile of the head groups in POPE (right) shows that the head groups do not reposition themselves fully as the original bilayer.
12
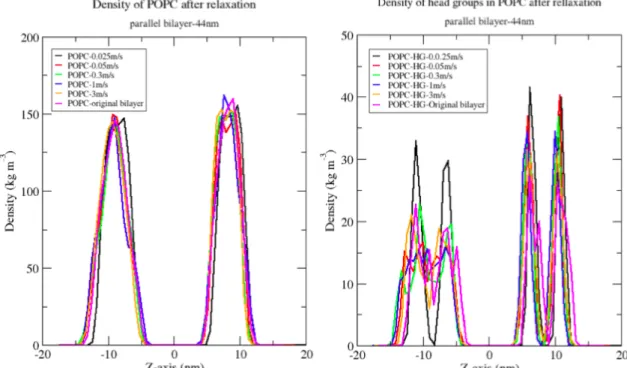
Figure 10. The profile density of POPC (left) shows that the bilayers do not act similarly. The relaxation of the head groups in parallel bilayer has been shown that when the bilayer is deformed and relaxed it can lose the natural oscillation of the bilayer and become straight.
For cylindrical bilayer the relaxation also acts similarly as single and parallel bilayer. The lengths of the axon in Z-direction does not recover entirely to the original length. The length of both X and Y-direction decreases to keep the volume of the box similar to the original structure. Although the inner and outer diameter of the bilayer changes which becomes smaller as well and some swellings can be seen on the surface of the bilayer (figure 11). The swellings seen on the surface can be explained by the in vitro study done Smith et. al. they explain that after axonal recover in their experiment some swellings was seen on the axons after stretching ans relaxing the axons. Also similar findings were found in brain-injured humans [10]. After relaxation, the inner diameter decreases by 3 nm and the outer diameter changes by 2 nm.
13
Figure 11. The swellings shown in the cylindrical bilayer. (the water is hidden for visualization purposes).
3.3 Pore formation
As it is interesting to see at what strain a pore forms in axonal bilayer, it is interesting to investigate the effect of length, composition and structure in pore formation to reach a better understanding when axons get damages during a diffuse brain injury. As previously explained the pore is defines when chains of water molecules pass through the bilayer.
3.3.1 Effect of length and structure
The results for 14-nm parallel and single axonal bilayer was compared to the original 44-nm single and parallel bilayer for pore formation. Interestingly there is a difference in strain value when a pore is formed. However, there is no correlation between the deformation velocity and the strain for pore formation. In 44-nm single and and parallel axonal bilayer, the strain for formation is between 0.9 to 1.05, whereas for the parallel bilayer is in the range of 0.8 to 0.89. The strain range for the 14-nm single axonal bilayer is between 1.05 to 1.07 and for parallel bilayer is between 0.95 to 1.02. The average difference between strain in 44-nm and 14-nm axonal single bilayer is 10% which clearly shows the length of the bilayer in simulations can play a role. The major difference in the length of the bilayer is seen in the penetration of the water. In 44nm single bilayer at strain 0.72 to 0.85 water molecule penetrates inside the bilayer without forming a pore. This is because the gaps between the lipids get large enough for some water molecule to pass through the bilayer when the strain is increased. However, this value for 14-nm single bilayer is the range of 0.37 to 0.7. The range of strain for penetration of water in 44-nm parallel bilayer is evidently different to single bilayer as well which is between 0.4 to 0.6.
Figure 12 shows a pore created due to high deformation which the water molecules have penetrated inside the bilayer.
14
Figure 12. Presence of a pore in 14-nm single axonal bilayer. The water
molecules are freely going through the bilayer. The head groups of the lipids are shown as well. In this picture only heads of the lipids are shown and the tails are hidden.
The strain for pore formation for the cylindrical bilayer is high compared to the other bilayer structures. The strain for pore formation is between 2.8 to 3 which is almost 3 times strain for 44 nm and 15 nm single axonal bilayer. As the cylindrical bilayer is pure POPE bilayer, the strain value was compared to the strain for the simple pure DPPC bilayer. The strain for pure DPPC bilayer is in range of 0.6 to 0.7 which is one fifth of the strain value of the cylindrical bilayer.
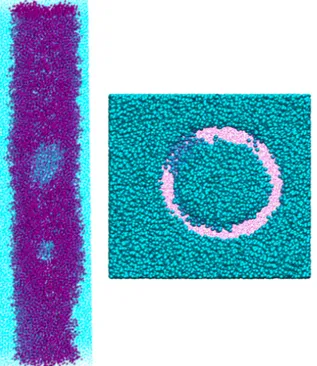
Figure 13. Side view and top view of Pore formation in cylindrical bilayer where pores large enough are created for water molecules to escape into the bilayer due to the deformation velocity. (Water in the side view picture is shown in dots and in the top view is shown in Van de Walls beads)
15 Interestingly when the cylindrical bilayer was relaxed after pore formation, the pores were not stable. This resulted the pores to be recovered and closed after relaxation. Although there was 78% change in the length of the bilayer in which, this agrees with the in vitro results . The in vitro results state that the axons can relax after deformation but the length of the bilayer do not recover [10] [11]. Relaxation after pore formation for single and parallel bilayer was not done. This can be conducted in future works.
3.3.2 Effect of composition
As previously mentioned single axonal bilayers have a strain in range of 0.9 to 1.05 for pore formation. Plasma bilayer with similar lipid types and different lipid percentages, showed different value in pore formation and water penetration. In pore formation the difference in the range is not huge. The difference is only 10% since the range of strain in plasma bilayer is between 0.84 to 0.9 yielding an average of 0.86 with no correlation to the deformation velocity. However, the strain for water permeability of the plasma bilayer is noticeably lower than axonal bilayer, ranging from 0.3 to 0.36. This results evidently shows that the composition of the bilayer can have effect in strain level for pore formation. Several studies, researching strain level for pore formation in axonal bilayers usually take one type of lipid and cholesterol. This composition effect shown, clearly states that there is some composition effect that changes the value of strain level for pore formation. However, more studies is required to investigate which type of lipid is most likely to change the values.
16
4 Discussion and conclusions
In this thesis, the response of the axonal bilayers toward deformation was investigated at microscopic level. The bilayers at 20% tensile strain showed no significant change which is in agreement with experimental data to Bain and Meany [11] stating that the optimal strain threshold where the nerve can balance its function is 20%. At this level of strain, there is no pore formation and neither any water penetration inside the leaflets of the bilayer. the deformed bilayers can quickly recover to their original shape under relaxation in order of few nanoseconds from dimensional aspect. The bilayers stayed intact forming no pore after the relaxation as well. Although the profile densities show some differences specially in the profile densities of the head groups. This can be related to the hypothesis stating that under mild TBI cases, the impairment of the axonal membrane can occur, leading to swelling and deformation of the axon [17] . Hence, the disruption of the head groups can be explained by this phenomenon.
The results achieved from the pore formation for single and parallel bilayers in some cases were repeated several times to make the results valid. From our simulation results between axonal, plasma and pure lipid and simple bilayer, , the effect of the lipid composition can be seen clearly as different strain level for pore formation was found. The plasma bilayer shows lower strain for water penetration and pore formation showing the lipid percentages of the lipid have a crucial role in the deformation of the membranes. Note that a few changes were done to make the simulation functional since the axonal bilayer consists of a very complex lipid types. For instance, glycolipids include a handful of various types of lipids, however because there were no particular Martini force field available to choose from, it was only limited to use DPGS which similar but at the same time different with glycolipids. As there is a high amount of DPGS (28%) in the axonal bilayer, this could have affected the results. Although comparing the strains with simple bilayer made of CHOL and POPE, it only deviated by 30% which this effect can be due to existence of other lipids such as sphingomyelin. These results although present that the axons can be very tensile toward deformation. According to Smith et al. no primary axotomy is seen from applied strains below 65% and there is no water permeation unless primary axotomy has occurred [10]. This value is in agreement with the results which no permeability damage under 65% strain for 44 nm axonal single and parallel bilayer was seen. The effect of the length was also demonstrated using the 44 nm and 15 nm single axonal bilayer. The pore formation for cylindrical bilayer although is very high, exceeding 250%. The inner diameter of the bilayer is one tenth of the diameter of the biological axons which in reality they are in range of 1-20 𝜇𝑚 [18]. This high value can be due to the length effect which was seen in the single axonal bilayer as well. The length of the cylindrical bilayer in Z-direction is only 11 nm which is very small in comparison to biological length of axons. The composition of the bilayer although does not play a role in such high strain value because cholesterol would have made the value even higher since cholesterol is known to make the bilayer even stiffened and resistant towards
17 stretch [19]. Another factor in the modelling the cylindrical bilayer is the presence of the water inside the axon. In biological axons there are microtubules inside of the axon with different physical properties to water. This can be a contributing factor to the results achieved in this project.
As no specific trend was found between deformation of the lipids and the deformation velocities, the lack of correlation might be due to high deformation velocities in comparison to the reality. The duration of traumatic force in TBI is 5 to 10 ms, making the deformation velocity very slow. For instance, the deformation velocity should be 1.8 ×10%7 m/s to deform the 44
nm bilayer to reach 20% strain where the slowest deformation velocity in this project was only 0.025 m/s. There might be a threshold in the deformation velocity which above that threshold the correlation no longer exists. The size and tensile deformation applied to the bilayers are a very simplified version. In TBI there are multitude of external force imposed on the axons [20]. The simulations were also done in coarse grain model which the degree of freedom for molecules are reduced. Therefore, the time achieved for deformations and relaxations are not a real time. Only a complex and complete model the skull and adequate environment can give fair and accurate results. However, such investigations can illustrate a rough informative assessment of axonal behavior.
In relaxation process, the results of the cylindrical bilayer are more solid. This is because of the geometrical shape of the bilayer which it is similar to axons The swellings seen on the surface are described by the in vitro researches which approves the results.
As the models in these thesis are very simple, no protein was implemented in the bilayers for simplicity of the models. This could have changed the values achieved through this project slightly different compared to in vitro values.
18
5 Bibliography
[1] D. J. Thurman, C. Alverson, D. Browne, K. A. Dunn, J. Guerrero, R. Johnson, V. Johnson, J. Langlois, D. Pilkey and J. E. Sniezek, "Traumatic Brain Injury in the United States," 1999.
[2] D. F. Meaney and H. Douglas, "Biomechanics of Concussion," Clin Sports
Medicine, vol. 30, no. 1, pp. 19-31, 2011.
[3] T. Andriessen, B. Jacobs and P. E. Vos, "Clinical characteristics and pathophysiological mechanisms of focal and diffuse traumatic brain injury," Cellular and Molecular Medicine, vol. 14, no. 10, pp. 2381-2392, 2010.
[4] T. Gennarelli , L. Thibault, J. Adams , D. Graham, C. Thompson and R. Marcincin , "Diffuse axonal injury and traumatic coma in the primate,"
Annals of Neurology, vol. 12, no. 6, pp. 564-574, 1982.
[5] T. A. Gennerelli, L. E. Thaibault and D. I. Graham, "Diffuse Axonal Injury: An Important Form of Traumatic Brain Damage," The
Neuroscientist , vol. 4, no. 3, pp. 203-215, 1998.
[6] D. F. Meaney, B. Morrison and C. Dale Bass, "The Mechanics of Traumatic Brain Injury: A Review of What We Know and What We Need to Know for Reducing Its Societal Burden," Journal of Biomechanical
Engineering, vol. 136, no. 2, pp. 0210081-14, 2014.
[7] T. A. Gennarelli, "Head injury in man and experimental animals: clinical aspects.," Acta Neurochirurgica Supplement , vol. 32, pp. 1-13, 1983. [8] J. A. B. GRAY and J. M. RITCHIE, "Effect of stretch on single myelinated
nerve fibers," Physiology, vol. 124, pp. 89-124, 1954.
[9] J. Galbraith , L. Thibault and D. Matteson , "Mechanical and elec- trical responses of the squid giant axon to simple elongation," Journal of
Biomechanical Engineering, vol. 115, no. 1, pp. 13-22, 1993.
[10] D. Smith, J. A. Wolf, T. A. Lusard, V. M.-Y. Lee and D. F. Meaney, "High Tolerance and Delayed Elastic Response of Cultured Axons to Dynamic Stretch Injury," Neuroscience, vol. 19, no. 11, p. 4263–4269, 1999.
[11] A. C. Bain and D. F. Meaney, "Tissue-Level threshold for axonal damage in an experimental model of central nervous systsme whicte matter injury," Journal of Biomechanical Engineering, vol. 122, pp. 615-619, 2000.
[12] "GROMACS," [Online]. Available: http://www.gromacs.org. [Accessed 16 May 2017].
[13] "Martini force field," [Online]. Available: http://cgmartini.nl/index.php. [Accessed 16 May 2017].
[14] W. Humphrey, A. Dalke and K. Schulten, 1996. [Online]. Available: http://www.ks.uiuc.edu/Research/vmd/. [Accessed 16 May 2015].
[15] T. A. Wassenaar, H. I. Ingólfsson, . R. A. Böckmann, . D. P. Tieleman and S. J. Marrink, "Computational Lipidomics with insane: A Versatile Tool for Generating Custom Membranes for Molecular Simulations," Journal
19
Chemical Theory and Computation, vol. 11, no. 5, p. pp 2144–2155, 2015.
[16] B. Alberts, A. Johnson, J. Lewis, M. Raff , K. Roberts and P. Walter, Molecular Biology of the Cell, 5th ed., Garland Science, 2008, pp. 620-626.
[17] C. Giordano and S. Kleiven, "Evaluation of axonal membrane as apredictor for mild traumatic nrain injuries using finite element modelling," Stapp Car Crash, vol. 58, pp. 29-61, 2014.
[18] D. Liewald, R. Miller, N. Logothetis, H. Wagner and A. Schüz , "Distribution of axon diameters in cortical white matter: an electron-microscopic study on three human brains and a macaque.," Biological
Cybernetics, vol. 108, no. 5, pp. 541-57, 2014.
[19] D. Needham and R. Nunn, "Elastic deformation and failure of lipid bilayer membranes containing cholesterol," Biophysical Journal, vol. 58, no. 4, pp. 907-1009, 1190.
[20] E. Su and M. Bell, "Diffuse Axonal Injury," in Translational Research in
Traumatic Brain Injury, Boca Raton, Florida, CRC Press, 2016.
[21] H. Ingoĺfsson, M. N. Melo, F. J. van Eerden, C. Arnarez, C. A. Lopez, T. A. Wassenaar, X. Periole, A. H. de Vries, D. P. Tieleman and S. J. Marrink, "Lipid Organization of the Plasma Membrane," Journal of American
A1
Appendix A
A1 Traumatic Brain Injury
Traumatic Brain Injury (TBI) is one of the major diseases across the globe. The number of patients suffering from this disease are increasing every year due to increasing number of violence and activities such as sports and motor vehicle crashes [1]. Consequently, these activities have made TBI as one of the first leading causes of death in the world [2]. TBI is caused by application of an external force to the brain and causing some dysfunctionality of the brain. The level of the dysfunctionality is dependent of the force and the place where the mechanical force is applied to the brain [3]. According to Center for Disease Control and Prevention (CDC), TBI is defined as “a disruption in the normal function of the brain that can be caused by a bump, blow, or jolt to the head, or penetrating head injury [4]”. According to statistics from 1991, around 1.5 million people suffered from TBI and were admitted to hospitals. Among them, 50000 of the patients died and 85000 of them suffered from long term disabilities [5]. With increasing number of TBI-related patients, a total of approximately 2.8 million TBI-related emergency department visits, hospitalizations, and deaths occurred in the United State in 2013. Approximately 282,000 TBI-related patients were hospitalized, and approximately 56,000 TBI-related patients died [1].
There are multiple criteria for classifying TBI, including classification by injury severity, mechanism, pathoanatomy, and pathophysiology [6]. To classify TBI using injury severity, Glasgow Coma Scale (CGS) is used. CGS is involved of summing the scores from three measurements including eye opening,best motor and verbal response [7]. According to this classification, Severe TBI is scored between 3 to 8, moderate between 9 and 12, and mild TBI (mTBI) is between 13 and 15 [8]. Pathoanatomic classification, classifies TBI as focal or diffuse injury [6]. Focal brain injury as it is name suggests, is a type of traumatic brain injury that is more focused in a particular part of the brain. This type of injury is macroscopically large enough to be identified by naked eye or with the help of MRI and CT [9]. Impacts in which focal TBI can have on the brain are contusions on the surface of the brain, hematoma, haemorrhage and edema [9] [10]. Diffuse brain injury on the other hand could go unnoticed. This type of TBI is more widespread and it is not visible to be noticed easily [9] since the damage is microstructural and medical imaging techniques have proven to be less sensitive to this type of damage if it is not accompanied by hammorhages [11].
A1.1 Diffuse Axonal Injury
Diffuse brain injury is sometimes referred to various names such as shearing injury, diffuse white matter shearing injury and inner cerebral trauma. Nowadays, it is more known as diffuse axonal injury (DAI). In DAI, the damages affect the functionality of the axons in white matter [10]. Initially DAI was only
A2
viewed as the main cause of diffuse brain injury but in other severe head injuries, axonal damages were also found. Hence, it resulted to define DAI into three different grades [9]. In class I DAI, there is a widespread axonal damage in the white matter. Class II DAI, includes abnormalities in the corpus callosum, sometimes followed by small haemorrhages. The class III DAI is the axonal abnormalities found in rostral brainstem following also with small haemorrhages which can be the severe form of DAI among the three classes [9]. From biomechanical point of view, DIA is the cause of the force applied to the head in shear form and the severity of the damage is dependent of magnitude of the force, duration, the direction of the force and the area in which the force is applied to the brain. According to different studies under DAI, the force causes axonal strain in four different stages. The stages in order are membrane injury, cytoskeletal damage, secondary axotomy and primary axotomy. According to a study done by Gennarelli [12], an axonal stretch between 15% to 20% of it is original rate will not cause tear of axon. However, its results some changes to the axon that some are reversible and some are irreversible. At the strain of 5%, a disruption of the action potential can be seen which disarrays the order of the ionic influx of the cell. The second stage of the axonal injury can be seen when the strain is between 5% to 10%. In this level, the osmatic mechanism of the cell is imbalanced and also some enlargements and swellings can be seen. The third stage, the secondary axotomy is identified as 15% to 20% strain which causes excessive accumulation of material for transport, change in cytoskeletal shape and extreme damage of the membrane [13]. A strain higher than 20% can lead to last stage of the DAI which is the primary axotomy. In this stage, the structure of the axon is completely disrupted and it leads to a total dysfunctionality of the axons where the damage is not reversible and in some cases, the axon gets torn. Another study carried out by Smith et tal. [14] examined the dynamic deformation of axons in vitro by applying dynamic uniaxial deformation on the axons to replicate the mechanical force experienced by axon during a traumatic brain injury. It was reported that the threshold leading towards primary axotomy can be found on stretch over 65%. However, strains over 77% also did not severely destroyed the axon. The axons stretched below the primary axotomy threshold were able to recover their shape after 45 minutes where the main range of relaxation time was under the first 10 minutes.
The recovery time for the axons to maintain their original shape still remains an enigma. However, few reasons have been suggested for this delay. Such reasons can be the active reformation of a molecular structure by creating new network connectivity and the viscous flow of molecules [15]. Tang-Schomer et al. [16] also confirm that dynamic stretch injury can lead to disassembly of microtubules (present in cytoskeleton, stage II) and consequently leading to axons degeneration.
A3
A1.2 Axonal membrane and Lipid bilayers
For a successful simulation with high accuracy to the real membrane and investigating the result of axonal deformation, it is crucial to primarily understand the composition of membranes. Axonal membranes as bio-membranes are only a few nano-meters thickness as compared to the lateral size of a typical cell which is in order of microns. Membranes do not only build up the structure of the membrane but their role is also to hold all the cellular material inside the cell and they regulate the flow of materials and signals into and out of the cell [17]. They are also essential when it comes to energy source for cell functioning [18]. Despite the differences in the various types of biological membranes such as plasma membrane, myelin sheath, and axonal membrane, they have a general structure composed of a thin film made of different lipids and membrane proteins which are held together mostly by noncovalent interaction [19]. Lipid molecules constitutes approximately 50% of the mass of most animal cell membranes where the rest of the membrane is consistent of the proteins and cholesterol [19].The most abundant lipids in membranes are phospholipids. These have a polar head group and two hydrophobic hydrocarbon tail. The main phospholipid in most animal cells are phosphoglycerides which have a 3-carbon glycerol backbone (choline, phosphate and glycerol) [19]. The other lipid groups are sphingolipids, glycolipids and sterols. In phospholipids, the phosphate groups can be esterified to the hydroxyl groups of bases such as choline, serine, ethanolamine or inositol, leading to phosphatidylcho- line (PC), phosphatidylethanolamine (PE), phosphatidylserine (PS), phosphatidylg- lycerol (PG) and phosphatidylinositol (PI), respectively [20]. The following picture shows the structure of a lipid.
Figure A1: An sketch of phosphoglyceride lipid. Choline, shosphate and glycerols are head of the lipid that are hydrophilic attached a long fatty chain (tail)
A4
making them very hydrophobic.
The nature and shape of phospholipids is in a way that they can form a bilayer in aqueous environment [19]. The hydrophilic heads of the lipids, head outward facing the water where the hydrophobic tails face inward shielded from the water. Figure A2 shows how lipids are arranged side by side as a bilayer.
Figure A2: lipids are structured in the way the hydrophilic headsa re facing toward the water where the tails on inside the leaflet with no contact to water. The figure on the right is the molecular simulation of a lipid bilayer presenting how water molecules surround the head s of the lipids. The heads are shown in red, green and purple and the tails is shown in silver.
Cholesterols (CHOL) are another important part of the bilayers. Certain functions on the cell such as permeability, fluidity, and also the bending rigidity of membranes are dependent of the cholesterols [20]. As lipids contain hydrophobic and hydrophilic parts, cholesterols on the other side are only hydrophobic molecules which causes them to be formed more likely as a droplet in the bilayer. Also pure phospholipids are in disordered phase at physiological temperature and cholesterol can solve such problem in this context [18]. Membranes with depleted amount of cholesterol are more likely to lose their structur and become highly permeable [20]. Membranes in different parts of body have different composition of lipids. The following table shows the different percentages of lipids in various types of membranes. For example, myelin sheath is more saturated with CHOL in comparison to plasma membrane in liver cells.
A5
Table A1: percentage of total lipids in several types of membranes [19].
As it can be seen from the table, the percentage of cholesterol is high in both myelin and plasma membrane. So far there has not been any source stating the accurate percentage of CHOL and lipids in axonal membrane. As this project focuses on axons and the deformation of membranes, the axonal membrane will be considered made out of the same percentage of the lipids and CHOL in myelin sheath.
Most of the studies done to evaluate the effect of strain and mechanical loading in Molecular Dynamic (MD) simulation have only focused on using one type of lipids mostly phosphatidylcholine (specifically DPPC) and CHOL. However, this can affect the results of the simulation since the simulated bilayer is not similar to the biological bilayer. Therefore, it must be intended to use similar percentages of lipids for an accurate result. There are however studies conducted to evaluate how different lipid compositions can affect the deformation of the membrane and rupturing strength. A study done by Shigematsu et al. [21] has been conducted to evaluate the mechanical effect of stretching in bilayers using DPPC and CHOL on how a pore can be formed by unsteady stretching and quasistatic stretching. According to this study the thickness of the bilayers stretched at different speeds decreases regardless of the value of the speeds. When the bilayers exceed a certain value, a pore is formed which causes the water molecules to penetrate into the bilayer. This penetration of the water in reality is the secondary axotomy of the membrane (axon) which causes the total dysfunctionality of the axon. According to this study the critical areal strain ε" which the structure of bilayer made of DPPC and cholesterol can be changed to start forming a pore is between 1.2 and 1.4. The areal strain is defined as ε = $%
$%&
'
− 1 where l+ and l+, are length of the bilayer and the average value of l+ during the later 50ns of the equilibrium simulation, respectively. In another bilayer only consistent of the DPPC lipid, the critical areal strain was found to be between 0.6 and 0.8. This study clearly shows how bilayers containing CHOL are considerably endurable to strain in comparison to the membranes only containing one type of lipid. As the composition of the bilayer and the effect of strain has been studied extensively, another important factor to focus on, is the study of mechanical loading applied to the bilayer. The previous study by Shigematsu was done by applying a deformation velocity at different rates to see the effect of stretch. A study done
A6
by Xie et al. [22] using only DPPC and water molecules in MD simulation, investigated the membranes resistance and their behaviour to lateral tension and compression by applying a pressure of 1 bar, -50 bar , -100 bar and -200 bar laterally to the membrane at different loading rates. According to this study DPPC bilayers facing low pressure loads are more resistant toward the deformation in comparison to high pressure load which confirms the theory that at low mechanical force, membranes are resistant to damage and deformation. Another result achieved from this study is that the bilayers are less deformed when the pressure loading is applied at different rates of time interval rather than applying an instantaneous pressure load. This is because when the pressure load is applied gradually, the membrane has the time to face the pressure loading in order to arrange the lipids and prevent them to generate a pore in the bilayer.
A1.3 Bilayer configuration
The structure of the axon is another factor that can be considered into account for molecular simulation. As axons are shaped like long cylindrical tubes, they can exhibit a different deformation compared to a single bilayer that is only one layer with a brick shape. In the studies mentioned above [21] [22] and other studies, the bilayer are simulated only as a single bilayer. This is because there are limitations when it comes to molecular simulation for creating different bilayer structure. In MD, simulation bilayers can easily be formed in a brick form of a bilayer or as a parallel bilayer. The following figures shows the configuration of single and parallel bilayer that can be built using MD with different lipid composition. The single bilayer only mimics a small cut from the surface of the axon whereas the parallel bilayer tries to presents the upper and the lower surface area of the axon. However, it is desirable to simulate the bilayer as cylindrical bilayer mimic the exact shape of the axons
figure A3: single (top) and parallel (below) bilayers are built using MD simulation covered with water and ion molecules. The parallel bilayer is intended for the shape of the axon
A7
There are recently some studies done on making a curvature in bilayers using N-BAR and F-BAR proteins. The F-BAR and N-BAR domains try to bind and curve the membrane via scaffolding. In this method, BAR domain bends the membranes by attracting the lipid head groups that are negatively charged to their tails [23]. However, this process can be time consuming. For example, in this specific work, to build the curvature, the bilayer has been simulated under a time of 350𝜇𝑠. To simulate such complex structure under this amount of time it can take several months to simulate the bilayer and also the current project is simplified membrane model in which no protein has been used in the bilayer.
figure A4: The F-bar proteins is places on top of the bilayer to create a bent bilayer. In higher scale of longer and wider bilayer with numerous F-BAR proteins the curvature can be achieved [23]. (Ó2013 Yu, Schulten)
The axonal strain in diffuse traumatic brain injury has also been studied extensively using finite element modelling. A study done by Giordano and Kleiven [24], strain in the white matter, brainstem, midbrain, corpus callosum, and thalamus has been analysed. In this work, these areas are chosen because they are getting affected in most of the traumatic brain injuries which are based on the MRI images of different studies. As this study focuses more on the areas of the brain and finding how axonal strain in each area is probable, it does not focus specifically on the modelling the axon itself. However, the study has found that the axonal strain threshold is 0.07 and 0.15 for the corpus callosum and brainstem respectively.
A2 Molecular Simulation
Since 19th century, mathematical modellings have given us an advantage to study targets in more controlled ways. This provides conclusive ways of testing and also an opportunity for obtaining measureable entities [25]. Computer simulations, as one of the major tools in mathematical models can be used to investigate molecular structure of biological membrane. This will help us understand how the structure of membranes get affected when a mechanical
A8
load is applied to them and how the membrane strive to reorients their lipids to recover their original shape after removal of the traumatic force.
Molecular simulation offers a way to simulate biological membrane to mimic the behaviour of molecules and molecular system. Since our aim is to investigate the structural changes of the axonal membrane after dynamic stretch injury in molecular level, it is rational to simulate the membrane using molecular simulation. Molecular simulation can be performed from stochastic and deterministic approaches. The stochastic approach called Monte Carlo (MC) simulation and the deterministic approach is called Molecular Dynamic (MD) simulation.
A2.1 Monte Carlo Simulation
MC simulation is based on exploring the energy surface by randomly probing the geometry of the molecular system (or, in a statistical mechanic’s language, its configuration space). It is essentially composed of generating random changes to the position of the species in the system together with their orientation and conformation and calculating the energy of the new configuration. MC uses a special defined criterion to decide on accepting or not accepting each new configuration. MC simulation is more useful for achieving the structural information of the system [26].
A2.2 Molecular Dynamic Simulation
MD simulation proposes computation of dynamic motion and thermodynamic properties for molecular systems. As it was mentioned before, MD is a deterministic method which means the state of the system can be predicted at any future time from the current state that the system is [26]. MD uses the second Newton law to create a configuration by specifying the position and velocity of the particles in a system.
F3 = m3565:78(:)6 (1)
Where r3 t = x3 t , y3 t , z3 t is the position vector and F3 is the forces acting upon the N particles over the system. In general, by using the Newton law of motion, (a) the force acting on the particles and the neighboring particles can be found, then (b) the velocity of the particles are calculated and (c) the new position of the particles are calculated as the system evolves. As the system simulates further, the three steps are repeated until the desired simulation time is reached. However, because of the complexity of the potential energy that depends on 3N coordinates of all the atoms in the system, equations of motion cannot be solved analytically.
There are several methods for solving them numerically, such as Verlet’s algorithm and leap-frog’s algorithm. The leap-frog algorithm is achieved from Verlet’s alogorithm.
A9
2.3 Integrating methods in MD simulation
New conformations and dynamic properties of the system, new positions of the particles, velocities and acceleration are approximated as Taylor series.
In the Verlet’s algorithm each particles position at the next time step, t+dt, is calculated by position and acceleration at time t and the position from time t-dt [26].
r t + δt = r t + δtv t +E'δt'a(t) (2)
r t − δt = r t − δtv t +E'δt'a(t) (3)
which gives us:
r t + δt = 2r t − r t − δt + δt'a(t) (4)
The function r t + δt obtained by this method gives almost all dynamic information of the system. However, the velocity is not a part of the equation 9 which can be found by dividing the difference in positions at times t + δt and t − δt by 2δt:
v t = r t + δt − r t − δt /2δt (5)
Verlet’s algorithm is modest and straightforward in calculating acceleration and position. However, there are several drawbacks. One of the drawbacks is in calculation of the new position r t + δt , a small value δt'a(t) is added to the
rest of the equation that has a larger value. This can cause a precision problem. Another disadvantage is the lack of explicit relationship in the algorithm to find the velocity. In order to find it first position has of the particle has to found and calculated and them velocity can be computed.
Another algorithm is Leap-Frog, obtained from Verlet’s algorithm. In the leap-frog’s method the position, r, at time t + δt is calculated based on the velocity at the time t +E
'δt which depends in its turn on velocity at time t − E
'δt [26].
Velocities in this simulation are updated by a half step.
r t + δt = r t + δtv t +E'δt (6) v t +E
'δt = v t − E
'δt + δta t (7)
In this method first the velocities are calculated and then the positions are achieved by using the value of the velocities. The following figure shows a simple map of how velocity and position are calculated according to the time step.
A10
Figure A5: A simple sketch of leap frog method on how the position and the velocity are unsynchronized.
One of the advantages of leap-frog method is having explicit relation for both velocity and position. However, a disadvantage to this method is that velocity and positions cannot be found in a same time step or in other words, they are not synchronized. This leads to inability for calculating kinetic energy at the same time when as the positions are defend [26].
A2.4 Force fields
Another criterion to run a successful molecular simulation is the force field. Force field is a mathematical expression used to illustrate the energy of the system, dependent of the coordinates of each particle. Force fields usually consist of four terms. They contain interaction of bonded and non-bonded parts of the system, deviation and angles, and how the energy changes as the bonds are rotated (torsion) [26].
U r = k3 2 OPQ5R (l3− l3,,)'+ k3 2 SQT$UR (θ3− θ3,,)' + VQ 2 OPQ5R (1 + cos nω − γ ) + (4ε σE' r3`E' − σa r3`a + q3q` 4πε,r3` d `eE d 3eE )
In this relationship q3 and q` are partial charges of distance r3`. k3 is force constant and θ3,, and l3,, are equilibrium values. In the dihedral (torsion) term,
VQ, n and γ are the amplitude periodicity and phase angle respectively. ε is the well depth in potential energy and a measure of how strongly the two particles attract each other. σ gives a measurement of how close two nonbonding particles can get and is thus referred to as the van der Waals radius and r is the distance of separation between both particles.
A11
A2.5 Coarse grain model
Modelling the structure of membranes can be done in different microscopic levels. One of the unresolved issues in computational science and modelling is the time scaling. Therefore, there are sometimes unnecessary to establish a system with all the microscopic interactions and the existing bonda. Simulating the system in this situation is very time consuming for reaching the desired time scale. To overcome such problem Coarse Grained (CG) model have been introduced. Coarse graining can limit the size of the system and simulation time by certain methods. Coarse graining creates super-atoms in which small groups of atoms are treated as single particles [27]. To do so the number of interaction among the atoms are reduced by decreasing the number of degrees of freedom. The outcome is a larger time scales, cheaper potential and a smoother energy landscape. The following figure shows how the coarse graining model in done.
Figure A6: Coarse grain model of phosphatidylserine. The figure has shown how atoms and molecules are placed in a bead and are represented in less detailed form.
A2.6 Martini Coarse Gained Force Field
Martini force field is one of the well-known force fields in MD simulation for simulating bilayers at coarse grained model. This force field uses a four-to-one mapping in which four heavy atoms plus the associated hydrogens are represented in one bead and ions are represented by a single CG bead [28]. In this force field there are four types of interaction sites: polar (P), non-polar (N), apolar (C), and charged (Q). Non bonded interactions are represented using Lennard-Jones (LJ) potential. The strength of the interaction is dependent of the well-depth in LJ potential and it is ranging from ε3` = 5.6 kJmolhE to ε
3` =