The
effects
of
endocrine
disruptor
cocktails
on
bleak
(Alburnus
alburnus)
behavior,
growth,
and
morphology
Joaquín
Alcalde
Rueda
Degree project inbiology, Master ofscience (2years), 2014 Examensarbete ibiologi 30 hp tillmasterexamen, 2014 Biology Education Centre
TABLE OF CONTENTS
1. Summary... 2
2. Background... 2
2.1 On endocrine disrupting chemicals ... 2
2.2 The complexity of the study of the effects of EDCs ... 3
2.2.1 On the non-linear action of endocrine disruptors. Effects at low doses. ... 3
2.2.2 Endocrine disruptors cocktails... 3
2.3 Bisphenol A ... 4
2.3.1 Characteristics and applications ... 4
2.3.2 Sources of BPA to environment ... 5
2.3.3 Concentrations of BPA in aquatic system ... 5
2.3.4 A short review of the biological effects of BPA in aquatic organisms ... 5
2.4 Ethinylestradiol... 7
2.4.1 Characteristics and applications ... 7
2.4.2 Releases of EE2 to environment... 8
2.4.3 EE2 occurrence in aquatic systems ... 8
2.4.4 A short review of the effects of EE2 in aquatic organisms ... 8
2.5 Ecological relevance of the relations between behavior, morphology, and growth9 3 Aim of this project... 9
4 Material and methods ... 10
4.1 Fish collection and pretreatment... 10
4.2 Preparation and addition of chemicals... 11
4.3 Growth ... 11
4.3.1 Weight and length... 11
4.3.2 Gut length, gonad characteristics ... 11
4.4 Behavior ... 11 4.5 Morphometrics ... 12 4.6 Statistical Analyses... 13 5 Results ... 14 5.1 Fish Growth ... 14 5.1.1 Fish Weight ... 14 5.1.2 Total Length ... 16 5.1.3 Intestine length ... 16
5.1.4 Gonadosomatic index (GSI) ... 17
5.2 Behavior ... 18 5.2.1 Locomotor activity ... 18 5.2.2 Sociability... 19 5.2.3 Reaction to predators ... 20 5.3 Morphometry ... 21 6 Discussion... 22 6.1 Growth ... 22
6.1.1 EDCs effect on final weight. ... 22
6.1.2 Diet treatment effects on final weight. ... 22
6.1.3 Intestine length, GSI, Intersex proportion. ... 23
6.2 Behavior ... 23
6.3 Morphometry ... 24
7 Conclusions ... 24
8 Acknowledgements ... 25
1.
Summary
The presence of endocrine disrupting chemicals in the aquatic system is a problem of growing concern. However, several factors complicate the study of their effects in the aquatic organisms, e.g. their non-monotonic dose-response curves, their different effects at low concentrations, and their mixture effects. I performed an experiment to study the effects of a mixture of xenoestrogens containing bisphenol A and ethinylestradiol on bleak (Alburnus alburnus) growth, morphology and non-reproductive behavior. The interactive effects of the chemical treatments with different diets was analyzed. As a result, I detected an inhibitory effect of ethinylestradiol on fish growth, an increased shoaling cohesiveness and changes in morhpology. In addition a slight interactive-additive effect of chemical and food stressors was found. The combination of these effects on ecologically important traits, as a result of the presence of a pollutant in water at environmentally relevant concentrations, could have serious consequences in
ecosystem structure and function. Here, I discuss the ecological consequences that this effects could have. However, I could not find any effect of the endocrine disrupting chemicals mixture that could not be explained by the presence of the ethinylestradiol alone. Furthermore, I highlight the importance of the confounding factors when carrying out behavioral studies with this fish species.
2.
Background
2.1 On endocrine disrupting chemicals
An endocrine disrupting chemical (EDC) can be defined as “an exogenous substance that causes adverse health effects in an intact organism, or its progeny, secondary to changes in endocrine function” (European workshop on the impact of endocrine disrupters on human health and wildlife, European Comission, 1996). To be classified as an endocrine disruptor, an EDC should meet the following criteria (Tyler et al., 1998):
a) Be present in the environment at high concentrations b) Be persistent and bioaccumulative
c) Be continuously released into environment.
There are compounds of both anthropogenic and natural origin that have similar properties as endogenous hormones, therefore being able to interact with endogenous receptors (Hallgren 2014). EDCs can be classified following their relation with the receptor as androgenics, anti-androgenics, estrogenics and anti-estrogenics. Anti-androgenics and anti-estrogenics would block the natural androgen or estrogen receptor and therefore the triggering of a response, while androgenic or estrogenic would bind to a receptor and mimic the endogenous hormone and initiating or stimulating a response (Sumpter 2005). Furthermore, other paths of endocrine disruption exist, such as interfering in the synthesis of the endogenous hormones (Hallgren 2014).
2.2 The complexity of the study of the effects of EDCs
2.2.1 On the non-linear action of endocrine disruptors. Effects at low doses.
The study of EDCs is specially complicated in toxicology studies, because they can have effects at low doses that cannot be predicted by effects at high doses (Vandenberg
et al., 2012), challenging the “the dose makes the poison” dogma. Two important
concepts have been lately discussed in the toxicology field related to EDCs, a) low dose effects, and b) non-monotonicity. Low dose effects refer to the effects “observed below those used for traditional toxicology studies conducted for risk assessment purposes” by the US National Toxicology Program (2001). Non-monotonic is a term applied to the dose-effect response curves where relationship is not linear and the sign of the slope changes within the studied range of responses (Vandenberg et al., 2012). Traditional toxicological models have been assuming a dose-response relationship, and therefore might be underestimating the low-dose risk (Calabrese et al., 2003). Even more recent studies, like Caldwell et al. (2012) continue to ignore these concepts, despite that there is increasing evidence that low doses of hormones or EDCs such as BPA can trigger responses that are not stimulated at higher doses (Vom Saal and Hughes 2005). As a conclusion, for EDCs risk assessment purposes, extrapolation from data on effects at high doses that assume a linear response, should not be used (Vom Saal and Hughes 2005).
In addition to these difficulties to assess the effect of ECDs at low doses, Vom Saal and Hughes (2005) highlighted an additional source of confusion for regulatory agencies: the biased outcome of the research in low-dose studies (in rats) due to the source of funding. 90% of the 116 reviewed studies with governmental funding showed harmful effects of BPA at low doses, compared to the 0% of the ones financed by chemical corporations.
2.2.2 Endocrine disruptors cocktails
In nature, chemical pollutants are not found as single agents but as mixtures or
“cocktails” (Beyer et al., 2014, Silva et al., 2002). Even when these individual chemical are at concentrations under the non-observable effect concentration, exposure to their mixture can have toxic effects on organisms (Kortenkamp et al., 2008, Silva et al., 2002). As toxicity assessment is usually performed considering the effects of individual chemicals, environmental effects of cocktail toxicity are being underestimated (Beyer et
al., 2014).
Given the difficulties of testing all the possible combinations of chemicals to assess the mixture effects, some theoretical models are being developed to achieve this goal. Here it is important to define the term mode of action, the series of processes by which the interaction of a chemical contaminant with a target site takes to changes in the organisms that result in sublethal or lethal effects (USEPA, 2000). It is important to differentiate chemicals with the same mode of action. For mixtures with chemicals showing similar modes of action, we can apply the concept of dose addition, meaning that cocktail effects can be expected even when individual chemicals are under non-effect concentrations, because they contribute in an additive way as if they were
dilutions of each other (Kortenkamp et al., 2008). This diverges from the result obtained with chemicals with different modes of action, where instead of a concentration addition
an independent action is assumed. Both dose addition and independent action concepts have been used with a fair accuracy for predicting mixture effects, based on the
knowledge of individual effects (Kortenkamp et al., 2008). In endocrine disrupting chemicals mixtures, experiments up till now show a good approximation of their
toxicity by using an additive model (Figure 1) (Brian et al., 2005, Silva et al., 2002), but more information is desired to confirm the applicability of the theoretical models.
Figure 1. Example of mixture effects on vitellogenin induction at low-effect concentrations of five estrogenic chemicals: EE2 0.12 ng/l, 17β-estradiol (E2) 5ng/l, nonylphenol (NP) 1.4 µg, octylphenol (OP) 9 µg/l, and BPA 30 µg/l. Mixture concentration was 40.4 µg/l. From Brian (2005). Reproduced with permission of the publisher.
2.3 Bisphenol A
2.3.1 Characteristics and applications
Bisphenol A (BPA) is the common name for 2,2-(4,4-dihydroxydiphenyl) propane, an organic compound composed of two phenol rings connected by a methyl bridge, and with two methyl groups bound to the methyl bridge (Kang et al., 2007) (Figure 2). It is a synthetic product resulting from the condensation of 2 moles of phenol with one mole of acetone (Staples 1998). Most of the BPA manufactured is used in the production of polycarbonate plastics and epoxy resins (Staples 1998), and final applications include consumer and industrial products such as coatings for food packaging and beverage cans, plastic bottles, medical devices, safety equipment, parts of electronic circuits, paints, flame retardants, adhesives, and coating of thermal papers. Global production exceeds 3.5 million tons per year (Vandenberg 2010).
2.3.2 Sources of BPA to environment
Release of BPA to environment can occur during its production, processing, transport, or after consumption (Flint 2012). Despite a short half-life, reported to be between 2.5 and 4 days (Staples et al., 2009), BPA is highly widespread in the environment due to a continuous release (Oehlmann 2009). Particularly, it enters the aquatic systems mostly from point discharges like water treatment plants and landfill leachates (Kang et al., 2007, Oehlmann 2009). But it can also be detected in indoor and outdoor air samples as well as in dust (Vandenberg 2007). Furthermore, BPA can react with chlorine
producing chlorinated derivatives of BPA, and even though its production seems to be limited by the low amount of free chlorine in water, chlorinated derivatives of BPA seem to have a more potent estrogenic activity (ability to activate estrogen receptors compared to estrogen) and lower degradability than BPA (Kang et al., 2007). Due to low hydrophobicity of BPA (Heinonen et al., 2002), a low bioaccumulation capacity is expected (Flint 2012).
2.3.3 Concentrations of BPA in aquatic system
Klecka et al., (2009) extensively reviewed the concentrations of BPA in surface fresh waters of North America and Europe reported in 89 studies between 1997 and 2007 (Figure 3). Median concentrations reported were 0.081 µg/l in North America and 0.01
µg/l in Europe, citing maximum values of 12 µg/l and 43 µg/l in North America and Europe respectively. However, higher values had been reported by Fukazawa et al. (2002) who detect a BPA maximum concentration of 370 µg/l in a paper-industry effluent in Japan.
Figure 3. Concentrations of BPA (µg/l) in surface fresh water in North America (A) and Europe (B). From Klecka et al. (2009). Reproduced with permission of the publisher.
2.3.4 A short review of the biological effects of BPA in aquatic organisms
Bisphenol A has been considered a weak xenoestrogen (Witorsch 2002), defined as man-made estrogenic chemicals (Rajapakse 2002), as the binding affinity of BPA to the estradiol receptor is lower than estradiol´s (Lutz 1999). Blair (2000) quantifies this binding affinity being 0.008% of that of estradiol.
Despite this relatively low activity, existing literature describes numerous effects of BPA on organisms. For example, acute toxicity is found in the high µg/l range for the crustacean Daphnia magna (Chen 2002), with median lethal concentration (LC50) values ranging from even 240 µg/l in 24h (Park and Choi 2007) to 12800 µg/l (Chen 2002). LC50 is the concentration of a substance at which half of the individuals of a population die, and it is used as a general indicator of the substance´s acute toxicity. Note that 240 µg/l is remarkably close to environmentally relevant concentrations (see previous section). Again in D. magna, chronic effects occur at slightly lower
concentrations than for acute toxicity (Oehlmann 2009). Brennan (2006) detected inhibition of reproduction and development at 1000 µg/l. BPA inhibits development, growth and egg production at 100 µg/l in the marine copepod Acartia tonsa (Andersen 2001), while 0.08 µg/l were enough to inhibit larval development in the widespread midge Chironomus riparius. BPA can even affect developing eggs when breeding female C. riparius are exposed Oehlmann (2009). In the same species, adults emergence was delayed at 78 ng/l BPA and higher (Watts 2001).
In fish, in vitro studies have shown the ability of BPA to act as a xenoestrogen, by binding and activating the estrogen receptor (Harris 1997). In vivo studies show the feminizing effects of BPA, as well as the increase in synthesis of vitellogenin (Vtg) and zona radiata proteins (Zrp), in different fish species: carp (Cyprinus carpio), at 100 µg/l (Mandich et al., 2007); fathead minnow (Pimephales promelas), at 160 µg/l (Brian et
al., 2005); cod (Gadus morhua), at 50 µg/l (Sohoni et al., 2001); medaka (Oryzias latipes), at 1000 µg/l (Larsen et al., 2006); rainbow trout (Oncorhynchus mykiss), at 500
µg/l (Ishibashi et al., 2005). Vtg and Zrp are respectively an egg-yolk and an eggshell protein synthetized in female teleost fish liver in response to estrogenic signals.They are commonly used as biomarkers of exposure of fish to xenoestrogens (Brian 2005). Note however the high concentrations used compared to the environmental values (see above). Other effects of BPA on fish have been detected at environmentally relevant concentrations (Oehlmann 2009). For example, the plasmatic estrogen/androgen ratio is altered at concentrations between 1- 56 µg/l in carp and juvenile turbot (Scophthalmus
maximus), due to depressed levels of androgens as testosterone and 11-ketotestosterone
(Labadie and Budzinski 2006, Mandich 2007). The consequences of these alterations could be reflected in the following hormone-regulated processes:
masculinization/feminization of individuals, growth, skeleton development, neural development, or cell cycle (Oehlmann 2009). In addition, other effects have been detected on fish reproductive system, including alterations in gonadal structure from 1
µg/l BPA (Mandich 2007), reduced sperm quality, and retarded or inhibited ovulation in brown trout (Salmo trutta) between 1.75 and 5 µg/l (Lahnsteiner et al., 2005).
Importantly for my study, inhibition of somatic growth has been detected after exposure of fathead minnow from concentrations of 640 µg BPA/l (Sohoni et al., 2001).
Alterations in behavior have not been as extensively studied as development processes. Wang et al. (2013) show that exposure to 228-3000 µg BPA/l caused a decrease in swimming speed, as well as axial muscle damage in larvae of zebra fish (Danio rerio). In addition, it has been found that exposure to 1280 µg BPA/l induced changes in the expression of secondary sexual characteristics as well as in mate choice in two closely related fish from the genus Cyprinella (Ward et al., 2012).
At the genetic level, Bolognesi (2006) found damage of DNA related to exposition at 50
µg/l BPA. Various studies have focused on BPA induction of changes in gene expression in fish. These show the inductive effect that this chemical has on the
expression of genes related to oestrogen signaling, for instance the oestrogen receptor alpha in Kryptolebias marmoratus (Lee 2006), and medaka (Hayashi 2007). In addition to induce the expression of some of the same genes that natural oestrogen do, BPA was shown to induce the expression of some other different genes in carp (Moens 2006). However, these alterations on gene expression are detected at very high BPA
concentrations.
BPA does not act exclusively via estrogen signaling pathways, but also through other neuro-hormonal systems (Oehlmann 2009), and together negatively affect biological processes such as fish reproduction, growth and behavior.
2.4 Ethinylestradiol
2.4.1 Characteristics and applications
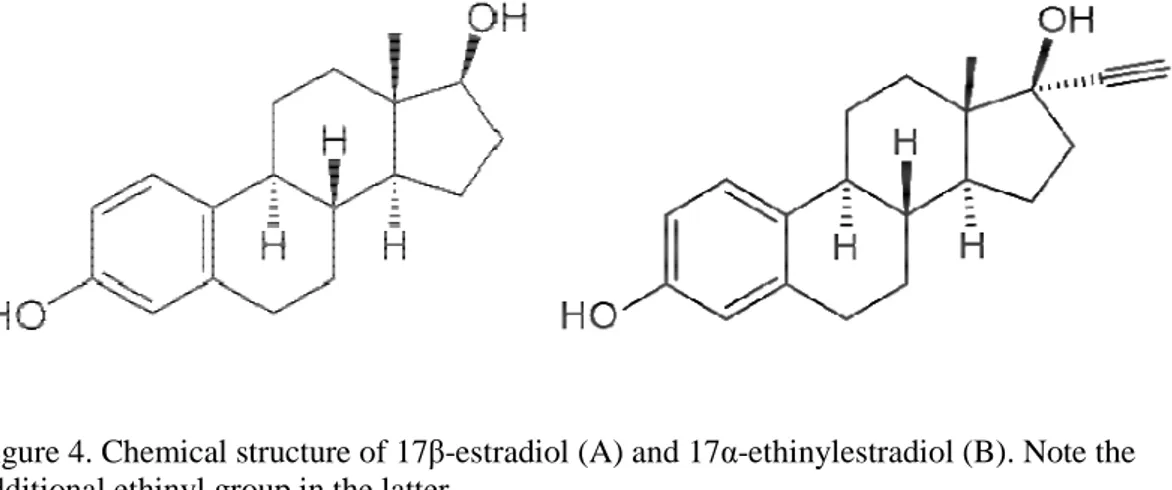
Ethinylestradiol (EE2, or 17α-ethinylestradiol) is a synthetic estrogen derived from the natural hormone 17β-estradiol (E2), used mainly in birth control pills (Tyler et al., 1998). It contains an additional ethinyl group at C-17 compared to E2 (Figure 4). This additional group provides the EE2 molecule a higher resistance to biodegradation than E2 (Clouzot 2008). Knowing the physico-chemical properties of EE2 can be useful to predict its behavior in nature (Clouzot 2008). It is an organic compound, with an octanol-water partition coefficient of 4.15 (Lai 2002) that indicates liposolubility. Together with a factor of bioaccumulation higher than the other estrogens, this indicates that bioaccumulation is likely to occur. However, this value is still orders of magnitude lower than for other endocrine disruptors like diclorodiphenyltrichloroethane (DDT) (Lai 2002). It is relevant to remark here that lipophilic xenobiotics (logKow>3) are likely to enter fish circulatory system via the gills (Kreke and Dietrich 2008). EE2 is included in a watch list of substances to be monitored by all European Union member states, with the possibility of being included in the future in the priority substances list (European Parliament, 2013).
Figure 4. Chemical structure of 17β-estradiol (A) and 17α-ethinylestradiol (B). Note the additional ethinyl group in the latter.
2.4.2 Releases of EE2 to environment
Although EE2 is deactivated before excretion from the human body, it can be detected in its biologically active form in effluents from waste water treatment plants (WWTPs). It has been suggested that Escherichia coli present in the waste waters would
metabolize the inactive towards the active form (Johnson and Williams 2008). Therefore, human excretion represents the main pathway for EE2 to enter the aquatic environment (Hanna et al., 2009)
2.4.3 EE2 occurrence in aquatic systems
Some studies have detected EE2 in water not directly downstream WWTPs, like the reported values of 4 ng EE2/l in German rivers (Strumpf et al., 1996), or the 3 and 15 ng/l detected in reservoirs and rivers from England, respectively (Aherne et al., 1989). In addition EE2 has been detected in Canada, Brazil, China, and Japan freshwaters (Zha
et al., 2008).
Other studies have used a modelling approach to estimate surface water concentrations. In a study funded by pharmaceutical companies, Hanna et al. (2009) analyzed the occurrence of EE2 in surface waters in Europe and the United States. They take into account parameters as the amount of EE2 consumed, which percentage of it is excreted by the body and thus is likely to arrive to WWTPs, per capita water use and sewage flows, and removal efficiency of WWTPs. Once they estimate these concentrations, they compared its values with published data, measured by analytical methods, from samples taken downstream of WWTPs. By using the models, they concluded a maximum full word (STP) effluent concentration of 13 ng EE2/l in Europe and 0.4 ng EE2/l in the US. This differs from the measured water concentrations, which actually range from nondetected to 273 ng/l. The 90th percentile of measured concentration is 1.7 ng EE2/l, but still 1.5% of the analyzed concentrations exceed the maximum predicted of 13 ng/l.
2.4.4 A short review of the effects of EE2 in aquatic organisms
The effects of EE2 in aquatic organisms have not been studied in detail. I will present some relevant examples, focusing on the low concentration range effects on fish. Numerous studies have shown the effect of EE2 as vitellogenin-inductor in males of different fish species, such as rainbow trout (Schultz et al., 2001), fathead minnow (Lange et al., 2001), zebrafish (Andersen et al., 2003), and medaka (Chikae et al., 2004).
Rainbow trout exposed to 2 ng EE2/l during 3 weeks showed inhibition of testicular growth, slower spermatogenesis, and 106 higher vitellogenin concentrations (Jobling et
al., 1996). Similarly, a 2 weeks exposure of juvenile rainbow trout to an EE2-dominated
mixture of oestrogens downstream a STP resulted in a sharp increase in vitellogenin concentration (Larsson et al., 1999). In a larger, multigeneration experiment, Zha et al. (2008) assessed the effects of EE2 in Chinese rare minnow (Gobiocypris rarus). They found a total inhibition of reproduction of F1 (no males developed to maturity; no females produced fertile eggs) at the lowest concentration tested (0.2 ng/l). In addition, at 16 ng EE2/l, 30-days old larvae showed morphological deformations, increased swimming failure, increased mortality and inhibited body growth. 120 days after hatching they showed lower gonadosomatic index (GSI), hepatosomatic and renal
somatic indices, which are the organ mass in relation to the body mass. Particullarly, GSI is commonly used as an indicator of sexual maturity. By contrast, with lower EE2 concentrations (0.2 and 1 ng/l) they showed an increased GSI. In addition, they found higher plasma vitellogenin in males; higher plasma vitellogenin in females; kidney and liver histological anomalies; male-feminization; and dose-dependent female ratio. Kidd et al. (2007) found that EE2 could cause the collapse of a fathead minnow population in a Canadian experimental lake in which they added EE2 up to a
concentration of 6 ng EE2/l. Fish from the treatment lake showed higher levels of liver vitellogenin mRNA, as well as a different seasonal pattern for vitellogenin mRNA expression compared to fish from reference lakes. Males from the experimental lake had delayed spermatogenesis, gonad malformations, lower GSI values, and increased male intersexes. As a result of the lack of recruitment, the fish population collapsed after the second season of EE2 additions.
Finally, little is known about effects of EE2 on non-reproductive behavior on fish. However there is some evidence of an increase in shoaling behavior measured as time before leaving the shoal, in adult zebrafish exposed to EE2 (Reyhanian et al., 2012).
2.5 Ecological relevance of the relations between behavior, morphology,
and growth
Individual variation in behavior can have consequences at different levels of ecological organization (Owens 2006). At the individual level it can be linked with diet, habitat use, growth, survival rate, ontogenetic niche shifts and reproductive success. At the population and community levels it can affect social structure, group feeding rate, population dynamics and species interactions (Mittelbach et al., 2014). For example it has been shown how activity rate and boldness are related to fish growth (Mittelbach et
al., 2014). Behavioral traits have been linked to morphological traits, as morphological
differences correlate with different foraging behavior (i.e. search behavior, prey choice, among others) and habitat choice (Webb, 1984; Ehlinger and Wilson, 1988; Hjelm et
al., 2000; Robinson et al., 2000; Svanbäck and Eklöv 2004). A specific organism
morphology would provide the best match in a trade-off gradient (Robinson 1996). Therefore altering this characteristic in an individual, without a change in the environmental conditions, would involve a decrease in fitness, which could have ecological consequences.
3 Aim of this project
Given the importance, but little knowledge, of the effects that mixtures of EDCs can have on aquatic organisms, I considered that further research about this issue was neccesary. As this lack of information is especially dramatic at low concentrations of pollutants, a study on the environmental effects of EDCs should consider the low range of concentrations. Additionally, despite extensive work on ECDs, few studies have focused on the effects of these on non-reproductive behavior (but see Reyhanian et al., 2011, Hallgren 2014), which, as stated before, can have ecological consequences at different organization levels. My aim was to perform an experiment to test the effects of EDCs mixtures, at environmentally relevant (low) concentrations, on non-reproductive behavior, exploring its relations with morphology and growth, in a fish species
occurring naturally in Sweden. Therefore, I tested the effects of BPA and EE2 in bleak (Alburnus alburnus).
4 Material and methods
4.1 Fish collection and pretreatment
140 bleak (Alburnus alburnus) were caught by means of a cast net on 4 and 5 February 2014 in Biotest basin, Forsmark, Sweden, 72 km northeast of Uppsala. Bleak were transported in styrofoam boxes in 5ºC water. Once at Uppsala University, fish were separated into three 300l black tanks, filled with tap water at 5ºC. The temperature was then allowed to gradually increase overnight to room temperature (15ºC). Fish were treated with baktopur (nifurpirinol, Sera GmbH, Heisenberg, Germany) during 3 days. During this acclimatization period they were fed once a day with staple diet (Sera GmbH, Heisenberg, Germany) and chironomids (Ruto BV, Zevenhuizen, Holland). After 1 week of acclimatization, on Friday 14th February, 120 fish were moved to the experimental aquariums (70x30x40 cm) with water at room temperature (15ºC). The remaining 20 fish were kept in 3 100 l-tanks as spare fish. Every aquarium was divided into two experimental units separated by a plexiglass pierced plate, which allows water circulation but acts as a barrier to fish. 6 fish were put in each aquarium (3 fish per experimental unit). Light environment was adjusted to 12h of light and 12h of darkness, with progressive light increasing and decreasing to mimic natural conditions. Water in the tanks was kept circulating with a filter pump, and 50% of the water was renewed once a week with tap water.
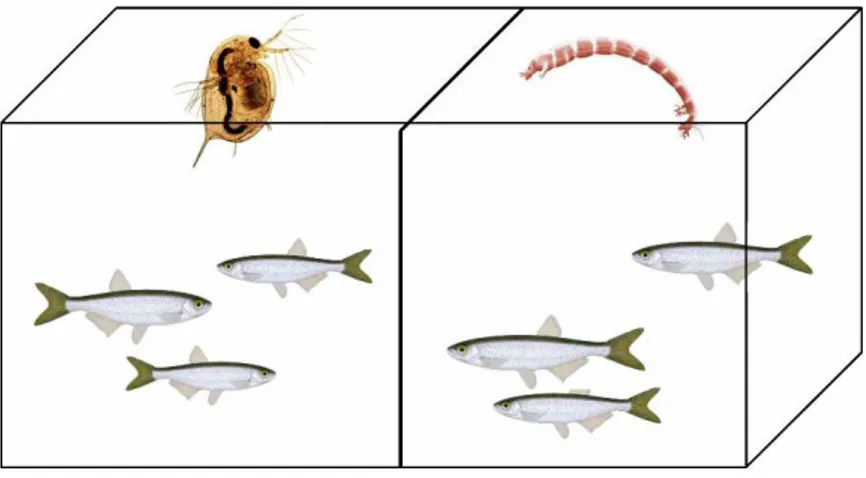
Four different EDCs treatments were randomly assigned to the aquariums: control, BPA, BPA+EE2, and EE2. In addition, fish were fed with either frozen chironomids or frozen Daphnia pulex (Imazo AB, Vara, Sweden), where one side of the aquarium were fed chironomids and the other Daphnia (Figure 5). The fish were fed a quantity of food equivalent to 10% of initial body weight per day, once a day, as had been previously used with similar fish species in this research group. This created a design with 4 different EDCs treatments, crossed with 2 diet treatments that were replicated 5 times.
The experiment lasted 7 weeks, during which growth, behavior and morphology was studied. At the end of the experimental time, fish were euthanized with an overdose of MS222 in buckets with aged water from aquaria. Fish were then subjected to dissection.
4.2 Preparation and addition of chemicals
Solutions of EE2 (>98%) and BPA (>99%) (Sigma-Aldrich, Steinheim, Germany) were prepared with acetone following Zha (2008) but with different final concentrations, to reach a final concentration in the aquaria water of 10 µg BPA/l or 10 ng EE2/l. Solution for combined treatment contained 10 µg BPA/l and 10 ng EE2/l. These concentrations were chosen as they were environmentally relevant values but still allowing to handle the small quantities of reactive with the available means. Solution for the control treatment consisted on acetone 50%. Solutions were added every week to keep the desired concentration of EDC in the water, calculating the required volume of chemicals to add from half-life data at this water temperature (Staples et al., 1998).
4.3 Growth
4.3.1 Weight and length
A combined weight of the three fish assigned to each experimental unit was measured with a lab scale (Ohaus Navigator, Ohaus Corporation, NJ, USA) before the
experiment. There were no significant differences in initial weight of the bleak assigned to receive the different treatments. By contrast, individual weights and length measures were not taken to avoid excessive handling of the fish, following advice about the sensitivity of this species. The combined weights of each experimental unit as well as individual weights and lengths (total length) were taken at the end.
4.3.2 Gut length, gonad characteristics
The intestine (gut) was dissected out from the buccal cavity and the gut length was measured with a ruler. Gonads were weighed and sex determined from them. Presence of testicles with oocytes was quantified and fish with this condition qualified as intersex fish. From this data a proportion of intersex fish for each treatment was calculated. GSI for each sex was calculated from gonads weight and total weight of each individual fish, applying:
GSI = [gonad weight / total tissue weight] x 100
4.4 Behavior
For measuring behavioral traits, I recorded videos before the start of the experiment, after 3 weeks, and just before its termination (7 weeks). The video recordings (180 seconds) were conducted 2 h after the fish were fed, with a videocamera (SONY HDR-cx52ove, Sony Corporation, Tokyo, Japan). In the video, the front side of each
experimental unit was divided with a 5cm-side grid as a coordinate system, allowing to determine the position of each individual in the 2-D space at each moment, as well as the distance to each one of the other fish, and the distance to the separation plate, at each moment. By tracking the position of each bleak every 5s, it was possible to calculate the distance a fish swam in one minute (locomotor activity), as well as the
(sociality) (Figure 6). This last measure is intended to be an approximation of the tendency to be close to the shoal at the other side of the plate.
Figure 6. Diagram of experimental unit with grid for recording behavior parameters
In addition, at the end of the experiment fish were assayed for their reaction to predator chemical cues, indicated by the same parameters as for the behavioral tests indicated above: locomotor activity, distance to neighbors and distance to separation wall. For this purpose, every tank was video recorded for 180 seconds after adding 2 l of water taken from a 100 l aquarium where a predator (pike, Esox lucius) had been kept for 6 months.
4.5 Morphometrics
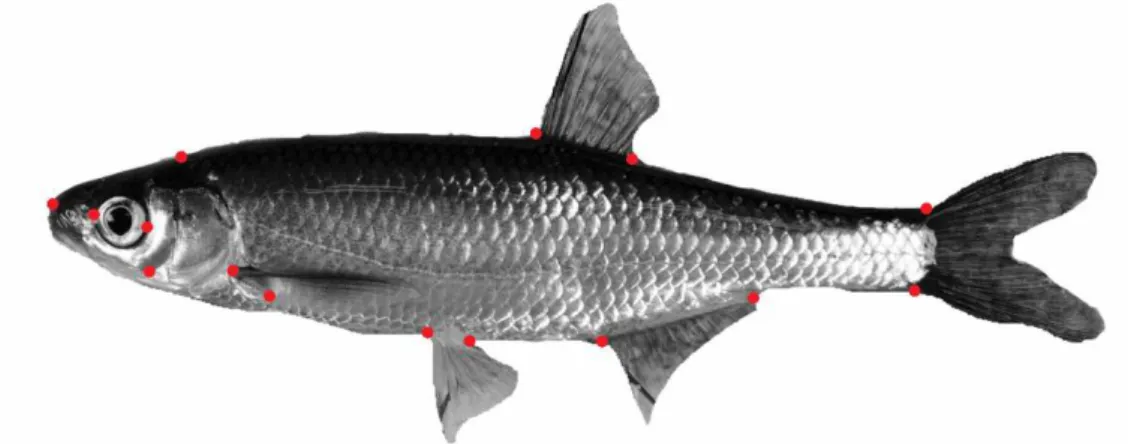
Morphometry was analysed with landmark-based geometric morphometrics. At the end of the experiment, a photograph of the left side of every fish was taken using a Nikon D300s camera (Nikon, Tokyo, Japan). The pictures were used to digitalize 15
landmarks on each individual fish with tpsDig2. The relative positions of the landmarks were analyzed with tpsRelw (Rohlf 2013) (Figure 7). This program analyses shape changes by comparing each fish individual landmark coordinates with the coordinates of the landmarks of the other individuals. Then it gives scores of relative warps among individuals, which describe deformations that are spatially graded and those that are restricted to an area of the geometry (Zelditch et al., 2004). TPSRelw corrects the differences in landmarks due to body size (Bartels et al., 2012).
4.6 Statistical Analyses
Statistical analyses and graph productions were performed with R (R Core Team, 2012). For weight change analysis, pseudoreplication was taken into account by taking the average values from each experimental unit, i.e., each three fish, as well as the fact of the repetition of measures of the same individuals along the time. A linear mixed effects model was run. Post-hoc analysis was performed with Tukey´s test.
To test the effects of treatments on total length, intestine length, GSI, sex-ratio and proportion of intersex individuals, several analyses of variance (ANOVA) were run taking into account pseudoreplication in the experimental units. A linear regression was done between the intestine length and fish length, and the residuals were compared between treatments with an ANOVA.
Behavior data was statistically analyzed by an ANOVA to test for significant effects of the factors treatment groups, diet groups and time. Behavior data was log-transformed to meet the assumption of normality. The position of the tank in the lab was taken into consideration for possible effects on fish activity, as some of them were closer than others to the area were experimenters were working. This was accounted by adding the factor zone describing the tank´s position within the room (Figure 8).
Figure 8. Schema of the aquaria room including zones of potential disturbances to the fish. Potential disturbances were expected to be higher in the areas closer to the entrance to the room.
For morphometric analysis, a Kruskal Wallis test was carried out to compare the difference in relative warps among EDCs and diet treatments, followed by a Kruskal-Wallis multiple comparison test as post-hoc when significant differences were found. The data was analyzed considering treatment as a four level factor (Control, BPA, BPA+EE2, EE2), and the diet as a two level factor (Daphnia, Chironomids). Treatment, diet, and time were considered fixed factors and tank number as random factor. This design allows to detect synergistic or antagonistic effects of the mixed treatment, compared to the single chemical ones. If none of these effects were detected analyses were repeated considering two factors (BPA, EE2) of two levels describing the presence or absence of BPA and EE2, in order to enhance the statistical power.
5 Results
5.1 Fish Growth
5.1.1 Fish Weight
Initial weight was not significantly different between treatments, nor between diets. (Table 1; p-value ≥ 0.0561).
Table 1. Weight of bleak from different treatments before the experiment. Mean values ±
standard deviations (SD) are shown.
Treatment Mean initial weight (g) SD
Control 21.75 4.54
BPA 24.14 4.17
BPA+EE2 18.98 5.03
EE2 19.94 3.19
The weight within groups decreased significantly with time (p-value=0.014, F=6.694) (Figure 9), and there were significant differences of this change of weight between treatments (p-value=0.008, F=4.633). The post hoc test revealed BPA treatment fish to have a higher final weight than mixture treatment fish (p-value=0.023), and EE2 treatment fish (p-value=0.022). However, no significant difference in final weight was found between control and any of the other treatments when considering the repetition of measurements. There was an interaction of treatment with diet (marginally
significant, p-value=0.060, F=2.737), (Figure 10) and Daphnia-fed fish had a lower weight than chironomids-fed fish (p-value=0.047) (Figure 11).
M e a n w e ig h t (g )
Figure 9. Mean weight of bleak (g) for each EDCs treatment, before applying treatment and at the end of the growth experiment.
A B M e a n w e ig h t (g ) M e a n w e ig h t (g )
Figure 10. Mean weight of bleak (g) for each EDCs treatment, before applying ECDs treatment and at the end of the experiment, for chironomid diet (A) or daphnia diet (B).
M e a n w e ig h t (g )
Figure 11. Mean weight (g) of fish for each diet treatment, before and after the growth experiment.
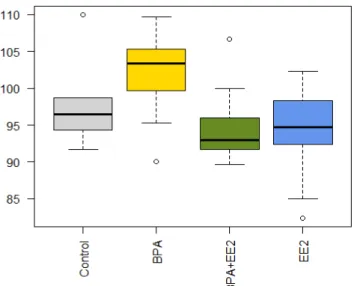
When considering treatments as presence or absence of both BPA and EE2, results showed that final weight was significantly lower in fish whose treatment contained EE2 (p<0.005, F=18.193; Figure 12).
M e a n w e ig h t (g )
Figure 12. Mean final weight (g) grouping the treatments by presence or absence of EE2.
5.1.2 Total Length
There was a significant effect of treatment on total length (p-value=0.01), where length was higher for BPA than for mixture (p-value=0.03) and EE2 (p-value=0.01) treatments (Figure 13). No effects of diet or tank position variables were detected. Analyzing data as presence/absence of BPA and EE2 revealed significantly lower final length in fish with EE2 treatments (p-value=0.009, F=7.809).
M e a n t o ta l le n g th (m m )
Figure 13. Mean total length (mm) at the end of the growth experiment, in relation to the EDCs treatment received.
5.1.3 Intestine length
Intestine length was significantly higher for fish under BPA treatment than control (p-value=0.024) and EE2 (p-value=0.008) treatments. This is also supported if data is analyzed as presence/absence of BPA and (p-value=0.006, F=8.663) (Figure 14).
M e a n i n te s ti n e le n g th (m m )
Figure 14. Mean gut length (mm) at the end of the growing experiment, separated by ECDs treatment.
The correlation between fish length and intestine length showed an adjusted R-squared value of 0.33 (p-value<0.005) (Figure 15). However the residuals of the regression for each treatment did not differ significantly (p-value=0.398)
Total length (mm) In te s ti n e le n g th (m m )
Figure 15. Correlation between intestine length and total length (mm), by ECDs treatment. (R2=0.33, p<0.005)
5.1.4 Gonadosomatic index (GSI)
GSI was not different between treatments (Figure 16; p-value ≥0.303), neither for males or females. However, if analyzing data as presence/absence of BPA/EE2 apositive effect of BPA on GSI value was detected (p-value=0.046; figure 17).
M e a n G S I
Figure 16. Mean Gonadosomatic index by ECDs treatment.
M e a n G S I
Figure 17. Mean GSI in presence or absence of BPA in the ECDs treatment.
Proportion of intersex individuals and sex ratio
Significant differences of the proportion of intersex individuals were not found among treatments (p-value≥ 0.654). Sex ratio was not found to differ significantly between treatments (p-value≥ 0.156). Male proportion: Control: 0.83±0.17; BPA 0.73±0.26; BPA+EE2 0.77±0.25; EE2 0.67±0.27, mean ± SD)
5.2 Behavior
5.2.1 Locomotor activity
Before applying treatments, there were significant differences in the locomotor activity of the fish influenced by the tank corridor (p-value=0.008, F=5.794) (Figure 18) However, no differences among treatments were detected (p-value=0.06, F=2.875). In the middle of the experiment, again there were differences in basal activity depending on the tank corridor (p-value=0.026, F=4.199). At the end of the experiment, no
significant differences were found in basal activity (p-value≥0.537, F=5.473). When compared two by two the locomotor activity at the three different times, no significant differences were found. In addition, when tank position effects were excluded from the model, significant differences related to time were detected (p-value=0.037), showing a decrease in activity with time (Figure 19).
A c ti v it y (c m /m in )
Figure 18. Locomotor activity depending on the position of the tank in the lab
A c ti v it y (c m /m in )
Figure 19. Locomotor activity of the fish along the experiment time.
5.2.2 Sociability
Before applying treatments, fish maintained a different distance among conspecifics in the same experimental unit, influenced by zone (p-value=0.035, Figure 20), but not among treatments (p-value=0.133, F=2.037), nor diet (p-value=0.364, F=0.851). In addition, they maintained significantly different distances to the separating wall also related to tank corridor (p-value<0.005, F=13.246)
Figure 20. Distance between fish (cm) depending on the position of the tank in the different zones of the laboratory, before applying ECDs treatments. Lower values of “Position of tank” indicate higher proximity to the entrance of the room.
At the end of the experiments, significant differences related to tank corridor
(p-value<0.005, F=12.112) and zones (p-value=0.049, F=3.386) were detected which were not related to treatment or diet (p-value≥0.133, F=2.037). They also maintained
significantly different distances to the separating wall (p-value=0.003) associated with factor zone. However, no significant change in the parameters associated to fish sociality was detected along the time.
If comparing treatments by absence/presence of BPA and EE2, the effects of the position of the tank were also detected in the different behavior parameters. But, in addition, it was possible to detect a lower social distance kept between the fish whose treatment included EE2 (p-value=0.04) as well (Figure 21).
Figure 21. Distance kept between fish in treatments of presence or absence of EE2.
5.2.3 Reaction to predators
There were significant differences in fish activity when exposed to predator cues, although related to tank position parameters. However, fish fed with Daphnia diet
(Figure 22) show a higher activity compared to those fed with chironomids (p-value=0.047, F=4.400)
Figure 22. Fish locomotor activity (log-transformed data)when exposed to a predator chemical signal, separated by diet treatment.
5.3 Morphometry
Two components of the relative warp showed significant differences among treatments. Fish body form under EE2 and mixture treatments were different from body form from BPA and control treatments (p-value<0.05) (Figure 23). The deformation plots show that the main trends in morphological variation are related to body depth and snout direction. None of the treatments showed an effect on any of the rest of relative warp components. In addition, no significant difference of the relative warp components between diets was detected.
Figure 23. Ordination plot showing position of bleak scattered along the two relative warps that showed a significant difference among treatments. The deformation grids show main trends of morphological variability by each relative warp. Deformations were exaggerated 5x.
-0.003 -0.002 -0.001 0 0.001 0.002 0.003 -0.004 -0.003 -0.002 -0.001 0 0.001 0.002 0.003 0.004 Control BPA BPA+EE2 EE2 Relative warp 2 Relative warp 1
6 Discussion
6.1 Growth
The first surprising result is the decrease in weight for all treatments. The amount of food provided for both diets was according to similar previous experiments in this lab, but carried out with other species (Perca fluviatilis). Multiple reasons may explain this result. Having observed that the experimental fish actually ate when the food was given, it seems evident that the amount provided was not enough for the fish requirements. It is possible that bleak and perch differ in metabolic rate or activity level at the aquaria conditions, e.g. temperature.
6.1.1 EDCs effect on final weight.
The more pronounced decrease in weight in EE2 treated-fish is in agreement with Hallgren (2014), who found that exposure of roach (Rutilus rutilus) to a concentration of 28 ng EE2/l caused a decrease in fish biomass. Differently to Hallgren´s results, I did find a difference in total length when there is presence of EE2. Hallgren (2014) detected a decreased foraging efficiency in roach after exposure to EE2, which may explain the reduced weight. Another plausible explanation is via the effects of sex steroids on growth hormone synthesis, which are still controversially debated even within species (Bernier et al., 2009). However, EE2 at low concentrations interferes with the growth hormone in developing bony fish (Shved et al., 2008), a mechanism that may contribute to the results I obtained. In a mesocosmos experiment, Hallgren (2014) showed how a decrease in fish biomass treatment was related to an increase in zooplankton biomass. The results I obtained would rule out the possibility of this decrease in fish biomass as a consequence of the alteration in the zooplankton community, but would support that EE2 effects on fish would have instead top-down consequences in the aquatic systems, altering the structure of the community. Although these effects were weak in Hallgren´s (2014) experiments, a longer exposure may alter community structure more deeply. I could not find an inhibitory effect of BPA on somatic growth, despite the results found previously at higher concentrations (Kwak 2001, Sohoni 2001). This may indicate that BPA by itself does not have a detectable effect on somatic growth at this low
concentration, even in combinations with other estrogenic EDCs.
6.1.2 Diet treatment effects on final weight.
According to the information provided by the suppliers and in agreement with De la Noüe and Choubert (1985), Daphnia and chironomids have a different nutritional value, where chironomids are richer in fat and proteins per gram. This seems to be the reason to find a diet effect on fish weight. It is also interesting to highlight the significant interaction affects of diet and treatment on weight, being the fish with chironomids diet and control treatment the only group gaining weight. It seems that the combination of a poorer diet with the chemical stressors would enhance the inhibitory effects of EDCs on fish growth. In other words, the EDCs effects are more visible in fish in diet stress. It has been previously shown that when organisms are pushed to the limits of their physiological tolerance range, they become more sensitive to the action of chemical stressors (Hooper et al., 2013). More specifically, Hooper et al. (2013) highlight the sensitiveness of the vertebrate endocrine system to environmental factors such as food
availability. As a conclusion, the food shortage treatment that the experimental fish went through, contributes to support the idea of interaction between chemical and non-chemical stressors to diminish fish performance. In a context of global change,
organisms will have to deal with a variety of stressors, including changes in the food web (Beyer et al., 2014). The increased sensitiveness to EDCs in presence of other stressors should be taken into account in the attempts to predict its effects on aquatic organisms and systems.
6.1.3 Intestine length, GSI, Intersex proportion.
The longer intestine length for BPA treated fish than for EE2 treated fish can be simply attributed to its correlation with fish length, as EE2-treated fish are shorter.
Intersex is the presence of male and female gonadal tissue, at the same time, in an individual of a fixed-sex species (Tylor et al., 2008). Although it has been considered as an indicator of exposure to EDCs (Tylor et al., 2008, Bizarro et al., 2014), the fact is that in several studies it has also been detected at reference sites (Bahamonde et al., 2013). As a result, a normal base-level of intersex should be distinguished from endocrine disruptor – induced intersex. Literature does not describe the intersex status of the bleak, therefore with the results described here this species can be grouped along with the fish that show natural intersex.
6.2 Behavior
In general, we can detect that at any time during the experiment, bleak locomotor activity and sociability were strongly influenced by the position of the tank in the lab, being the fish closer from the entrance of the lab more active, which indicates that experimenter presence would be acting as an important stressor. This highlights the importance of minimizing this effects in future behavioral studies, or, if not possible, at least do not neglect them in the analysis of data.
Bleak with EE2 in their treatment tended to be closer to each other after three weeks of treatment. Few studies have previously focused on effects of EE2 on non-reproductive behavior. It has been shown before that EE2 induced anxiogenic behavior in guppies, indicated by dwelling and freezing behavior when exposed to novel environments (Hallgren et al., 2011). Furthermore, an increase in shoaling behavior measured as time before leaving shoal has also been reported before, with adult zebrafish exposed to EE2 (Reyhanian et al., 2012), although Hallgren et al., (2011) failed to detect this effect. The present study supports the results obtained from model organisms, detecting an increase in the cohesiveness of the shoal that indicates anxiety, in a non-model fish species as is the bleak.
The changes in non-reproductive behavior induced by EE2 described here, can have ecological consequences. Shoaling is a trade-off between the anti predator benefits that the group confers and the foraging competition (Pitcher 1996, Hoare et al., 2000). Cohesiveness tends to increase with the presence of a predator as a way of decreasing predator risk, and tends to decrease when there is a need of reducing the foraging competition (Morgan 2006). An increase in cohesiveness in the absence of a predator would be maladaptative behavior, as it would raise the costs of foraging competition without providing additional protection against predation.
Predator avoidance
Although ECDs treatment did not have an effect in the reaction of bleak to predator chemical cues, so had the diet. The fact is that fish fed with Daphnia, which has been previously discussed as a poorer diet, showed a higher level of activity. Huckstorf et al., (2009) showed how starving conditions altered anti-predator behavior of roach (Rutilus
rutilus), and Morgan (2006) detected effects of hunger in shoaling cohesiveness in
bluntnose meanows (Pimephales notatus). Here, I did not find differences in shoaling characteristics but in locomotor activity, confirming the predictions made by Sih (1992) that more hungry individuals take more risks of being predated, in order to gain access to food.
6.3 Morphometry
Morphology within a fish species can vary when adapting to a heterogeneous
environment, as an expression of phenotypic plasticity (Peres-Neto and Magnan 2004, Olsson and Eklöv 2005). A specific morphology would provide the best match in a trade-off gradient (Robinson 1996). Therefore altering this characteristic in an
individual, without a change in the environmental conditions, would involve a decrease in fitness. This study supports the idea that EDCs can cause a shift in bleaks
morphology, tending the ones exposed to EE2 to have deeper body and upper bent snout. Differences in this aspects of fish body shape have been related to differences in maneuverability, attacking speed, search behavior, prey choice, and in consequence affecting foraging efficiency (Webb, 1984; Hjelm et al., 2000, Svanbäck and Eklöv 2004). Therefore we can expect a decreasing general fitness derived from this changes in morphology, effects that may be transmitted across scales and cause alterations in the community structure.
7 Conclusions
I could not find any cocktail effects of the mixture of BPA and EE2 at environmentally relevant concentrations. Instead, the changes detected were attributable to EE2 alone. However, I found that an inhibitory effect of EE2 in bleak growth possibly due to a decrease in foraging efficiency, which could have top-down effects in the aquatic system as for example in primary production via release of foraging pressure on zooplankton. I could also find that food shortage acts as a stressor that makes bleak more sensitive to endocrine disrupting chemicals effects on fish growth. This should be considered in a context of global change were other stressors are increasingly present. EE2 seemed to cause a level of anxiety reflected in a more packed shoal, which can be considered a maladaptive behavior that can have ecological costs. If these combined effects are strong enough, a general decrease in population fitness could be expected. Furthermore, although not directly related to EDCs, I could detect effects of food shortage on bleak locomotor activity when a predator chemical cue is present. In
addition, this study describes a background level of intersex condition in bleak, which to the best of my knowledge was not studied before. I would like to highlight the
importance of a methodological procedure that controls confounding variables when performing behavioral experiments in fish.
8 Acknowledgements
First at all I would like to thank my supervisor Richard Svanbäck for his support during the whole project. Also to all those who helped me in the field or in the lab, in the office or in the pub, with their knowledge or with their encouragement: Johanna Bergman, Konrad Karlsson, Yinghua Zha, Maria Marklund, Merce Berga, Núria Catalán, Celia Ruiz. Of course to the opponents Kristin Scharnweber and William Jones, who greatly contributed to improve this report. Thanks!!!
Finally, to my parents and nucleares for their relentless support.
9 References
Aherne GW, and Briggs RJ. 1989. The relevance of the presence of certain synthetic steroids in
the aquatic environment, Journal of Pharmacy and Pharmacology, 41, 735–736
Andersen HR, Wollenberger L, Halling-Sorensen, B, and Kusk K. O. 2001. Development of copepod nauplii to copepodites: a parameter for chronic toxicity including endocrine disruption.
Environmental Toxicology and Chemistry 20, 2821–2829
Andersen L, Holbech H, Gessbo Å, Norrgren L, and Petersen G. 2003. Effects of exposure to 17α-ethinylestradiol during early development on sexual differentiation and induction of vitellogenin in zebrafish (Danio rerio). Comparative Biochemistry and Physiology C: Toxicology & Pharmacology 134, 365–374
Bahamonde PA, Munkittrick KR, and Martyniuk CJ. 2013. Intersex in teleost fish: Are we
distinguishing endocrine disruption from natural phenomena? General and Comparative
Endocrinology 192, 25–35
Bartels P, Hirsch PE, Svanbäck R, and Eklöv P (2012) Water transparency drives intra-population divergence in Eurasian perch (Perca fluviatilis). PLoS ONE 7(8): e43641. doi:10.1371/journal.pone.0043641
Beyer J, Petersen K, Song Y, Ruus A, Grung M, Bakke T, and Tollefsen, KE. 2014. Environmental risk assessment of combined effects in aquatic ecotoxicology: A discussion paper. Marine Environmental Research 96, 81-91
Bizarro C, Rosc O, Vallejo A, Prieto A, Etxebarria N, Cajaraville MP, and Ortiz-Zarragoitia M. 2014. Intersex condition and molecular markers of endocrine disruption in relation with burdens of emerging pollutants in thicklip grey mullets (Chelon labrosus) from Basque estuaries (South-East Bay of Biscay). Marine Environmental Research 96,19-28
Blair R. M, Fang H., Branham WS, Hass B.S, Dial S L, Moland C L, Tong W, Shi L, Perkins R, and Sheehan DM. 2000. The estrogen receptor relative binding affinities of 188 natural and xenochemicals: Structural diversity of ligands. Toxicological Sciences 54, 138–153
Bolognesi C, Perrone E, Roggieri P, Pampanin D. M. and Sciutto A. 2006. Assessment of micronuclei induction in peripheral erythrocytes of fish exposed to xenobiotics under controlled conditions. Aquatic Toxicology 78, 93–98
Brennan SJ, Brougham CA, Roche JJ, and Fogarty AM. 2006. Multi-generational effects of four selected environmental oestrogens on Daphnia magna. Chemosphere 64, 49–55
Brian JV. 2005 Accurate prediction of the response of freshwater fish to a mixture of estrogenic chemicals. Environmetnal Health Perspectives 113, 721–728
Calabrese EJ and Baldwin LA. 2003. Toxicology rethinks its central belief. Nature 421, 691-692
Caldwell DJ, Mastrocco F, Anderson PD, Länge PR, Sumpter JP. 2012. Predicted-no-effect concentrations for the steroid estrogens estrone, 17b-estradiol, estriol, and 17a-ethinylestradiol. Environmental Toxicology and Chemistry, 31, 6,1396–1406
Chen MY, Ike M. and Fujita M. 2002. Acute toxicity, mutagenicity, and estrogenicity of bisphenol A and other bisphenols. Environmental Toxicology, 17, 80–86
Chikae M, Ikeda R, Hasan Q, Morita Y, and Tamiya E. 2004. Effects of tamoxifen, 17α-ethynylestradiol, flutamide, and methyltestosterone on plasma vitellogenin levels of male and
female Japanese medaka (Oryzias latipes). Environmental Toxicology and Pharmacology,
17, 29–33
Clouzot L, Marrot B, Doumenq P, Rochea N. 17a-Ethinylestradiol: an endocrine disrupter of great concern. Analytical methods and removal processes applied to water purification. A review. Environmental Progress 27, 3. DOI 10.1002/ep
De la Noue, J, and Choubert G. 1985. Apparent digestibility of invertebrate biomasses by rainbow trout. Aquaculture, 50, 103-112
European Parliament. 2013. Legislative resolution of 2 July 2013 on the proposal for a directive of the European Parliament and of the Council amending Directives 2000/60/EC and
2008/105/EC as regards priority substances in the field of water policy (COM(2011)0876 – C7-0026/2012 – 2011/0429(COD))
European Commission. 1996. European workshop on the impact of endocrine disrupters on human health and wildlife. Report of proceedings from a workshop held in Weybridge, UK, 2–4 December 1996. Report reference, EUR 17549, European Commission, DGXII, Brussels, Belgium
Flint S, Markle T, Thompson S, and Wallace E. 2012. Bisphenol A exposure, effects, and policy: A wildlife perspective. Journal of Environmental Management, 104, 19-34
Fukazawa H, Watanabe M, Shiraishi F, Shiraishi H, Shiozawa B, Matsushita H, and Terao Y. 2002. Formation of chlorinated derivatives of Bisphenol A in waste paper recycling plants and their estrogenic activities. Journal of Health Science 48(3) 242–249
Hallgren S,Volkova K, Reyhanian N, Olsén KH, Porsch H, and Hällström. 2011. Anxiogenic behaviour induced by 17a-ethynylestradiol in male guppies (Poecilia reticulata) Fish Physiol ogy and Biochemistry 37:911–918
Hallgren P, Nicolle A, Hansson LA, Brönmark C, Nikoleris L, Hyder M, and Persson A. 2014. Synthetic estrogen directly affects fish biomass and may indirectly disrupt aquatic food webs. Environmental Toxicology and Chemistry, 33: 930–936
Hannah R, D’aco VJ, Anderson P, Buzby ME, Caldwell DJ, Cunningham VL, Ericson JF, Johnson C, Parke NJ, Samuelian JH, Sumpter JP. 2009. Exposure assessment of
17a-ethinylestradiol in surface waters of the United States and Europe. Environmental Toxicology and Chemistry, 28, 12 2725–2732
Harris CA, Henttu P, Parker MG, and Sumpter JP. 1997. The estrogenic activity of phthalate esters in vitro. Environmental Health Perspectives, 105, 802–811
Hayashi H, Nishimoto A, Oshima N, and Iwamuro S. 2007. Expression of the estrogen receptor alpha gene in the anal fin of Japanese medaka, Oryzias latipes, by environmental concentrations of bisphenol A. Journal of Toxicological Sciences, 32, 91–96
Heinonen J, Honkanen J, Kukkonen VK, Holopainen IJ. 2002. Bisphenol A accumulation in the freshwater clam Pisidium amnicum at low temperatures. Archives of Environmental
Contamination and Toxicology, 43, 50-55
Hjelm J, Persson L, Christensen B. 2000. Growth, morphological variation and ontogenetic niche shifts in perch (Perca fluviatilis) in relation to resource availability. Oecologia 122:190– 199
Hoare DJ, Krause J, Peuhkuri N, and Godin JJ. 2000. Body size and shoaling in fish. Journal of Fish Biology 57, 1351–1366
Hooper MJ, Ankley GT, Cristol DA, Maryoung LA, Noyes PD and Pinkerton KE. 2013. Interactions between chemical and climate stressors: a role for mechanistic toxicology in assessing climate change risks. Environmental Toxicology and Chemistry, 32 (1), 32–48 Hultman M.T, Song Y, Rosseland B. O, Tollefsen K E. 2012. Effects of ethynylestradiol (EE2) on gene and protein expression in in vitro and in vivo exposed rainbow trout (Oncorhynchus
mykiss). 1st European Conference on the Replacement, Reduction and Refinement of Animal
Experiments in Ecotoxicology, June 2009, EAWAG, Dübendorf, Switzerland.
Ishibashi H, Watanabe N, Matsumura N, Hirano M, Nagao Y, Shiratsuchi H, Kohra S, Yoshihara S. and Arizono K. 2005. Toxicity to early life stages and an estrogeniceffect of a bisphenol A metabolite, 4-methyl-2,4-bis(4-hydroxyphenyl)pent-1-ene on the medaka (Oryziaslatipes). Life Sciences, 77, 2643–2655
Jobling S, Sheahan D, Osborne JA, Matthiessen P, and Sumpter JP. 1996. Inhibition of testicular growth in rainbow trout (Oncorhynchus mykiss) exposed to estrogenic alkylphenolic chemicals. Environmental Toxicology and Chemistry, 15(2), 194–202
Johnson AC, and Williams EL. 2004. A model to estimate influent and effluent concentrations of estradiol, estrone, and ethinylestradiol at sewage treatment works. Environmental Science and Technology, 38, 3649–3658
Kang J, Aasi D, Katayama Y. 2007. Bisphenol a in the aquatic environment and its endocrine-disruptive effects on aquatic organisms. Critical Reviews in Toxicology, 37:607–625
Kidd KA, Blanchfield PJ, Mills KH, Palace VP, Evans RE, Lazorchak JM, and Flick R. 2007. Collapse of a fish population after exposure to a synthetic estrogen. PNAS, 104 (21), 8897– 8901
Klecka G, Staples CA, Clark K, Van der Hoeven N, Thomas D, and Hentges N. 2009. Exposure analysis of bisphenol A in surface water systems in North America and Europe. Environmental Science and Technogly, 2009. 43, 6145–6150
Kortenkamp A, Backhaus T, and Faust M. 2007. State of the art report on mixture toxicity. Final Report. Executive Summary. 22 December 2009. Study Contract Number
Kreke N, and Deitrich DR. 2008. Physiological endpoints for potential SSRI interactions in fish. Critical Reviews in Toxicology, 37, 215–247
Kwak H, Bae M, Lee M, Lee YS, Lee B.J, Kang K, Chae CH, Hung HJ, Shin JS, Kim JH, Mar W, Sheen, YY, Cho MH. 2001. Effects of nonylphenol, bisphenol a, and their mixture on the viviparous swordtail fish (Xiphophorus helleri). Environmental Toxicology and Chemistry, 20 (4), 787–795
Labadie P, and Budzinski H. 2006. Alteration of steroid hormone balance in juvenile turbot (Psetta maxima) exposed to nonylphenol, bisphenol A, tetrabromodiphenyl ether
47, diallylphthalate, oil, and oil spiked with alkylphenols. Archives of Environmental
Contamination and Toxicology, 50, 552–561
Larsson DGJ, Adolfsson-Erici M, Parkkonen J, Pettersson M, Berg AH, Olsson PE, Förlin L. 1999. Ethinylestradiol: an undesired fish contraceptive? Aquatic Toxicology 45, 91–97
Lahnsteiner F, Berger B, Kletzl M, and Weismann T. 2005. Effect of bisphenol A on maturation and quality of semen and eggs in the brown trout, Salmo trutta f. fario. Aquatic Toxicology. 75, 213–224. (doi:10.1016/j.aquatox.2005.08.004)
Lai KM, Scrimshaw MD, and Lester JN. 2002. The effects of natural and synthetic steroid estrogens in relation to their environmental occurrence. Critical Reviews in Toxicology, 32(2):113–132
Lai K. M, Scrimshaw MD, and Lester JN 2002. Prediction of the bioaccumulation factors and body burden of natural and synthetic estrogens in aquatic organisms in the river systems. The Science of the Total Environment, 289, 159-168
Lange R, Hutchinson TH, Croudace CP, Siegmund F, Schweinfurth H, Hampe P, Panter GH, Sumpter JP. 2001. Effects of the synthetic estrogen 17a-ethinylestradiol on the life-cycle of the fathead minnow (Pimephales promelas). Environmetnal Toxicolgy and Chemistry, 20, 1216– 1227
Larsen BK, Bjornstad A, Sundt RC, Taban IC, Pampanin DM, and Andersen OK. 2006. Comparison of protein expression in plasma from nonylphenol and bisphenol A-exposed Atlantic cod (Gadus morhua) and turbot (Scophthalmus maximus) by use of SELDI-TOF. Aquatic Toxicology, 78, 25–33.
Lee YM, Seo JS, Kim IC, Yoon YD, and Lee JS. 2006. Endocrine disrupting chemicals (bisphenol A, 4-nonylphenol, 4-tert-octylphenol) modulate expression of two distinct
cytochrome P450 aromatase genes differently in gender types of the hermaphroditic fish Rivulus
marmoratus. Biochemical and Biophysical Research Communications, 345, 894–903. Lindholst C, Pedersen SN, and Bjerregaard P. 2001. Uptake, metabolism and excretion of bisphenol A in the rainbow trout (Oncorhynchus mykiss). Aquatic Toxicology, 55, 75–84 Lutz I, Kloas W. 1999. Amphibians as a model to study endocrine disruptors: I. Environmental pollution and estrogen receptor binding. Science of the Total Environment, 12;225(1-2):49-57 Mandich A, Bottero S, Benfenati E, Cevasco A, Erratico C, Maggioni S, Massari A, Pedemonte F, and Vigano L. 2007. In vivo exposure of carp to graded concentrations of bisphenol A. Genenral and Comparative Endocrinology, 153, 15–24
Mariager L. 2001 Effects of environmental endocrine disrupters on a freshwater and a marine crustacean. Master thesis, Aarhus University Dept. Zool., Institute of Biological Sciences, Aarhus, Denmark
Mittelbach G.G, Ballew G.N. and Kjelvik M.J. 2014. Fish behavioral types and their ecological consequences. Canadian Journal of Fisheries and Aquatic Sciences, 71: 927–944
Moens L.N, Van derVen K, Van Remortel P, Del-Favero J. and De Coen W. M. 2006. Expression profiling of endocrine-disrupting compounds using a customized Cyprinus carpio cDNA microarray. Toxicological Sciences, 93, 298–310
Morgan M. J. 1988. The effect of hunger, shoal size and the presence of a predator on shoal cohesiveness in bluntnose minnows, Pimephales notatus Rafinesque. Journal of Fish Biology, 32:963–971
Oehlmann J, Schulte-Oehlmann U, Kloas W, Jagnytsch O, Lutz I, Kresten O, Wollenberger L, Santos EM, Paul GC, Van Look, KJW, and Tyler C. 2009. A critical analysis of the biological impacts of plasticizers on wildlife. Philosophical Transactions of the Royal Society B, 364, 2047–2062
Olsson J, and Eklöv P. 2005. Habitat structure, feeding mode and morphological reversibility: factors influencing phenotypic plasticity in perch. Evolutionary Ecology Research 7:1109–1123 Park SY, and Choi J. 2007. Cytotoxicity, genotoxicity and ecotoxicity assay using human cell and environmental species for the screening of the risk from pollutant exposure. Environment International, 33, 817–822. (doi:10.1016/j.envint.2007.03.014)
Owens, Ian P.F. 2006. Where is behavioural ecology going? Trends in Ecology and Evolution 21(7), 356-361
Peres-Neto PR, and Magnan P. 2004. The influence of swimming demand on phenotypic plasticity and morphological integration: a comparison of two polymorphic charr species. Oecologia, 140, 36–45
Pitcher T.J, 1986. Functions of shoaling behaviour in Teleosts. The Behaviour of Teleost Fishes, 294-337 Springer-Verlag US 978-1-4684-8263-8
Quevedo M, Svanväck R, and Eklov P. 2009. Intrapopulation niche partitioning in a generalist predator limits food web connectivity. Ecology, 90(8) 2263–2274
R Development Core Team. 2012. R: A language and environment for statistical computing. R Foundation for Statistical Computing, Vienna, Austria (version 2.15.2)
Rajapakse N, Silva E, and Kortenkamp A. 2002. Combining xenoestrogens at levels below individual no-observed-effect concentrations dramatically enhances steroid hormone action. Environmental Health Perspectives 110, 9
Reyhanian N, Volkovaa K, Hallgren S, Bollnera T, Olsson P, Olsén H, Porsch I, and Hällström A. 2011. 17a-Ethinyl estradiol affects anxiety and shoaling behavior in adult male zebra fish (Danio rerio). Aquatic Toxicology 105, 41– 48
Robinson BW, and Wilson DS. 1994. Character release and displacement in fishes: a neglected literature. The American Naturalist. 144(4): 596-627
Rohlf, F J. 2013. tpsRelw, relative warps analysis, version 1.53. Department of Ecology and Evolution, State University of New York at Stony Brook, New York, USA
Schultz IR, Orner G, Merdink JL, and Skillman A. 2001. Dose–response relationships and pharmacokinetics of vitellogenin in rainbow trout after intravascular administration of 17 alpha-ethynylestradiol. Aquatoic Toxicology. 51, 305–318
Shved N, Berishvili G, Baroiller JF, Segner H, and Reinecke M. 2008. Environmentally relevant concentrations of 17a-ethinylestradiol (ee2) interfere with the growth hormone (gh)/insulin-like growt factor (igf)-i system in developing bony fish. Toxicological Sciences 106(1), 93–102 Sih A. 1992. Prey uncertainty and the balancing of antipredator and feeding needs. American Naturalist 139:1052–1069.
Silva E, Rajapakse N, and Kortenkamp A. 2002. Something from “nothing” - eight weak estrogenic chemicals combined at concentrations below NOECS produce significant mixture effects. Environmental Science and Technology, 36, 1751-1756
Sohoni P. 2001. Reproductive effects of long-term exposure to bisphenol A in the fathead minnow (Pimephales promelas). Environmental Science and Technology, 35, 2917–2925 Staples CA, Dom PB, Klecka GM, O’Blook S, and Harris L. 1998. A review of the
environmental fate, effects, and exposures of bisphenol A. Chemosphere, 36, 10, 2149-2173 Svanbäck R, and Eklöv P. 2004. Morphology in perch affects habitat specific feeding efficiency. Functional Ecology. 18: 503- 510
Tyler CR, Jobling S, and Sumpter JP. 1998. Endocrine disruption in wildlife: A critical review of the evidence, Critical Reviews in Toxicology, 28, 319–361
Tyler CR, and Jobling S. 2008. Roach, sex, and gender-bending chemicals: the feminization of wild fish in english rivers. BioScience 58, 11
USEPA, 2000. Supplementary Guidance for Conducting Health Risk Assessment of Chemical Mixtures. US Environmental Protection Agency, Washington DC, p. 209
Vandenberg LN, Chahoud I, Heindel JJ, Padmanabhan V, Paumgartten FJR, and Schoenfelder G. 2010. Urinary, circulating, and tissue biomonitoring studies indicate widespread exposure to bisphenol a. Environmental Health Perspectives 118, 8
Vandenberg LN, Colborn T, Hayes TB, Heindel JJ, Jacobs DR, Lee DH, Shioda T, Soto AM, vom Saal FS, Welshons WV, Zoeller T, and Myers JP. 2012. Hormones and
endocrine-disrupting chemicals: low-dose effects and nonmonotonic dose responses. Endocrine Reviews, 33(3):378–455
Vom Saal FS. and Hughes C. 2005. Extensive new literature concerning low-dose effects of bisphenol a shows the need for a new risk assessment. Environmental Health Perspectives 113, 8
Wang X, Dong Q, Chen Y, Jiang H, Xiao Q, Wang Y, Li W, Bai C, Huang C, Yang D. 2013. Bisphenol A affects axonal growth, musculature and motor behavior in developing zebrafish. Aquatic Toxicology, 142-143:104-13
Ward JL, and Blum MJ. 2012. Exposure to an environmental estrogen breaks down sexual isolation between native and invasive species. Evolutionary Applications 901–912