MASTER THESIS WITHIN: Economics NUMBER OF CREDITS: 30
PROGRAMME OF STUDY: Economics, Trade and Policy AUTHOR: Tshegofatso Mokgethi
TUTOR: Scott Hacker (Professor) Mark Bagley (PhD Candidate) JÖNKÖPING: May 2016
Effects of WTO Membership on
Developing Members’ Trade: A Case for
South Africa
i
Table of Contents
1. Introduction ...1
2. Review of Literature ...3
2.1. Why do nations trade? ... 3
2.2. The WTO as a trade regulating international institution ... 3
2.3. Theories of International Institutions ... 4
2.4. Effects of WTO membership on International Trade ... 5
2.5. Effects of the WTO on developing members’ Trade ... 8
2.6. The case for South Africa ... 9
2.6.1. The South African Economy ... 9
2.6.2. South Africa’s Trade Regime ... 10
3. Methodology ...13
3.1. Model Specification ...13
3.2. A priori Expectation and Justification ...14
3.3. Data Sources ...15
3.4. Model Estimation ...15
4. Results and Discussion ...16
4.1. Pooled OLS regression results ...16
4.2. Residual Diagnostics ...18 4.2.1. Heteroscedasticity ...18 4.2.2. Normality ...18 4.3. Multicollinearity Test ...20 5. Conclusion ...22 References ...23
ii
Figures
Figure 1: South Africa’s Average Real GDP Growth, 1962-2014 (at constant 2010 prices) ... 9 Figure 2: Value of South Africa’s Foreign Trade for the period 1992-2014 (in thousand USD) ... 10Tables
Table 1: Trade agreements between South Africa and the rest of the world ... 11 Table 2: Gravity model estimations using OLS ... 16 Table 3: Model estimates after removing outliers ... 19 Table 4: Collinearity among independent variables (Variance Inflation Factor, VIF) ... 21Appendix
Appendix 1: Descriptive Statistics ... 26 Appendix 2: Correlation Matrices ... 27 Appendix 3: White’s Heteroscedasticity Test ... 28 Appendix 4: Normality Test ... 29iii
Acknowledgements
I would like to express my sincere gratitude to my thesis supervisors, Professor Scott Hacker and Mark Bagley for being a source of guidance, wisdom and constructive criticism throughout the development of this thesis. You were always ready to listen, offer constructive feedback as well as provide relevant reading materials whenever needed. My learning experience has been greatly enriched as a result, and for that I say, “May you be abundantly blessed”.
With a grateful heart, I would also like to acknowledge the Swedish Institute (Si) for their financial support. It is through the Si Study Scholarships that I was able to pursue my graduate studies in Jönköping University, Sweden.
I would also like to thank my family, especially my parents for encouraging me to reach for the stars, my sister Lebo for always being there to listen and encourage me and most importantly, my beloved husband Zibanani for his unwavering love and support. “Whatever could I do without you tjipanda moyo tjangu”. A special thank you to my baby girls, Amutjilani, Chedza and Chazha for being my source of inspiration.
Finally I would like to thank my friends, Angelica and Anton Larsson for always keeping me in their prayers, and to the MSc Economics, Trade and Policy 2016 clas, I say thank you for your very insightful comments and advice. Saher ‘Bubba’ Malik, I am truly grateful to have met you. You and I did not only become best friends, but we became sisters. Thank you very much for your support.
iv
Abstract
Empirical literature assessing the effects of the WTO on its membership found no notable effect on the trade patterns of developing members in comparison to those of developed countries. This has been attributed to the high levels of protectionism by developing countries. However, the conclusion of the Uruguay round of negotiations culminated in a regime change with respect to the obligation requirements of developing countries. The current paper therefore brings to light the prospects availed by membership in the WTO for the South African economy against the backdrop of the Uruguay Round liberalization reforms. The cross-section gravity equation is employed to analyse South Africa’s bilateral export data ranging from 1992 to 2009. The paper finds no significant trade promoting in the period before 1995 and evidence of the trade promoting effect of the WTO on South Africa’s level of exports in the period after 1995, a finding which is consistent with the reciprocity principle of the theory of the GATT.
1
1. Introduction
Does the GATT/WTO have any trade promoting effects on its developing country membership? The GATT/WTO has recently been put under scrutiny in academia for its trade promoting effects or lack thereof on its membership. Taking into consideration how much the volume of world merchandise trade has increased since the end of World War II, how much the membership of the organization has grown since its inception in 1947, and the associated trade policy changes that countries in the process of acceding into the WTO are obliged to make, which are at times not necessarily in the applicant countries’ best interest, one would be inclined to answer the question of whether the WTO has any trade promoting effects on its membership with an unequivocal yes.
However, a paper entitled, “Do we really know that the WTO increases trade” by Andrew Rose (2004b) casts doubt on the effectiveness of the beau ideal of international institutions. The paper found no empirical evidence that the WTO has played any role in encouraging trade as members of the WTO has no significantly different trade patterns than non-members. What is striking about this piece of work is that the standard gravity model, a widely accepted econometric technique for international trade analysis was utilised to carry out an analysis of trade data for one hundred and seventy eight countries spanning a period of a little over fifty years. In addition a series of sensitivity analyses was carried on the work (Rose, 2004b). Rose’s article triggered an avalanche of empirical work, trying to prove or to disprove his claim. The empirical works yielded diverse results depending on the methodologies used, but most seemed to unanimously conclude that developing WTO members have experienced almost no trade promoting effects from membership in the WTO.
The result of no effect has been attributed to the ‘Special and Differential (S&D) Treatment’ provision of the GATT which allowed developing countries to negotiate favourable trade concessions without reciprocating the preferences granted to them by other members, hence developing WTO members undertook little to know liberalization obligations. This result is consistent with the theory of the GATT/WTO which predicts that reciprocity helps in achieving efficient and mutually beneficial trade policy outcomes, while non-reciprocity introduces uncertainty and leads to less than optimal outcomes (Bagwell and Staiger, 1999).
The Uruguay round of negotiations, which concluded in 1994, however, called for more trade liberalization commitments from developing countries. According to Subramanian and Wei
2
(2007), developing countries’ bound tariffs increased by fifty percentage points, while actual tariff reductions were smaller at twenty eight percent. Efforts to quantify the impacts of these liberalization reforms on developing countries’ trade are few and have yielded little to no results (Subramanian and Wei, 2007; Eicher and Henn, 2011). Subramanian and Wei (2007) ascribe the findings to the extended periods between ratification and implementation of agreements, granted to developing countries, stating that developing countries may be given up to 15 years to phase in their liberalization commitments.
In line with the assertions above, the current paper brings to light the prospects if any, availed by membership in the WTO for the South African economy against the backdrop of the Uruguay Round liberalization reforms. The paper also quantifies the impact of regional trade agreements on South Africa’s level of exports. South Africa offers an interesting case to analyse because it is one of the developing WTO members that committed to implementing trade liberalization reforms and it is one of the best performing economies in Africa. The cross-section gravity equation is employed to analyse bilateral trade data between South Africa and one hundred and fifty six of its trading partners ranging from 1992 to 2009, to provide answers to the following questions : (i) Does the WTO have any trade promoting effects on South Africa’s exports? (ii) What are the effects of preferential trade agreements on South Africa’s trade?
This paper has implications on developing countries’ trade policies since most developing countries are still reliant on the primary sector as their principal source of government revenues. There is therefore an urgent need for these countries to diversify their economies away from the primary sector. In addition, for most developing economies, youth unemployment and income inequalities are a major challenge. According to the Bagwell and Staiger (1999) economic theory of the GATT and the Ossa (2011) new trade theory of GATT/WTO negotiations, governments could make use of import tariffs to maximise national income as well as to maximise domestic welfare by attracting a large share of manufacturing firms. The paper sheds light on the prospects availed by WTO membership, and the associated trade policy reforms.
The rest of this paper is organized as follows; Section 2 provides a survey of literature on the theories underlying international trade and international institutions and the impact of WTO membership and participation in trade agreements on the level of trade, Section 3 outlines the methodologies and data employed to undertake the study, Section 4 discusses the findings of the study while Section 5 presents the concluding remarks of this study.
3
2. Review of Literature
2.1. Why do nations trade?
Literature on the liberalisation of trade is vast and the central conclusion has been that free trade is the best policy for most countries most of the time (Milner, 1999). The most fundamental argument for trade is that through trade, a country can get access to goods that cannot be produced locally or that can be produced locally but the cost of production is higher in comparison to that of the trading partner. The first classical economist to propose theoretical reasoning for trade was Adam Smith (1776) in his publication “An enquiry into the Nature and
Causes of the Wealth of Nations”. Smith (1776) suggested that nations would both gain if they
practised free trade and each nation specialised in the production of goods which they had absolute advantage1. David Ricardo (1817) later documented the theory of comparative advantage in his publication “On the Principles of Political Economy and Taxation”. The theory of comparative advantage postulates that nations gain from trade when they specialise in the production of goods for which they produce at a lower relative opportunity cost even if one party has absolute advantage in both goods. MacDougall (1951, 1952), (Stern 1962) and Balassa (1963) conducted the first empirical tests of comparative advantage and found that a positive relationship exists between per capita output and exports. A further development in trade theory came in the form of the Hecksher-Ohlin theory which posits that nations gain from trade if they specialise in the production of a good whose factor of production it is relatively more endowed. Even further developments in international trade theory have since taken place to explain patterns of trade that could otherwise not be explained by traditional theories. The new trade theories recognised that countries producing similar goods were also engaged in trade with one another and focused on the role of monopolistic competition, increasing returns to scale and network externalities to explain intra-industry trade between countries with similar factor endowments (Krugman, 1979).
2.2. The WTO as a trade regulating international institution
Until the twentieth century, trade had been conducted without any rules or international institutions governing trade. (Winham, 1998). The General Agreement on Tariffs and Trade
1 Absolute advantage is described as the ability to produce a greater quantity of a product or good than a
4
(GATT) came into being in 1947 to provide trade rules and structure for international trade. The GATT/WTO has often been cited as epitomizing a successful international institution (Goldstein, Rivers and Tomz, 2007b). The organisation’s membership has grown from twenty three founding members and currently stands at one hundred and sixty three formal members and twenty two observer governments, which are required to start the accession process within five years off becoming observers. According to the WTO, both world trade and Gross Domestic Product (GDP) declined in the 1920s and eventually bottomed out in 1932. After World War II, (almost the same time that the GATT came into being) world trade and GDP grew exponentially but with trade outpacing GDP growth. Many scholars tend to associate these trends with the WTO and praise the organisation for transforming world trade2.
2.3. Theories of International Institutions
The case for international institutions has theoretical backing in the work of neoliberal international relations theorist Robert Keohane who argues that international institutions foster cooperation among parties that have complementary interests by providing a basis upon which parties engage in negotiations and agree on mutual adjustment of behaviour without fear or uncertainty (Keohane, 1984; Herbert, 1996). According to Keohane, 1984 international regimes can increase the likelihood of cooperation by monitoring and providing information about the behaviour of others, lowering transaction costs and imposing sanctions for non-compliance. Bagwell and Staiger (1999) also developed a theoretical framework that interprets and explains how the basic principles underlying the GATT, reciprocity and non-discrimination, can be used by governments when implementing trade agreements to maximize national income. The economic theory of the GATT proposes that the GATT principles of reciprocity and non-discrimination ensure efficient and mutually advantageous trade agreements as they allow for the negotiation of optimal tariffs and guard against uncertainty arising from future prohibitive, unilateral increases in tariffs (Bagwell and Staiger, 1999).
Ossa (2011) builds onto the economic theory of the GATT by interpreting the GATT principles of reciprocity and non-discrimination as assisting governments to internalize production relocation externalities. The model proposes that governments could make use of import tariffs
5
to attract a larger share manufacturing firms which also translates to increased job opportunities domestically (Ossa, 2011). In contrast to the Bagwell and Staiger (1999) theory which assumes that governments maximize national income, the Ossa (2011) new trade theory of GATT negotiations assumes that governments maximize domestic welfare. The model predicts moderate welfare losses from moving to the non-cooperative tariff levels and moderate gains from GATT/WTO negotiations (Ossa, 2011).
Tomz et.al, (2007b) considered empirical proof of the importance of international institutions, with particular focus on the WTO, in ensuring continued cooperation among countries. According to Tomz et.al, 2007b, the WTO attenuates the prisoners’ dilemma that arises as a result of each country setting up its own terms of trade, and abolishing and reinstating protectionist measures anytime the countries so wish. Tomz et.al (2007b) concluded that international institutions are efficient in stimulating cooperation among countries that are interested in working together, adding that the WTO substantially influenced trade among its members. The authors however found evidence that suggests that trade agreements complement rather than undermine each other. The current paper however, will not delve into whether or not trade agreements complement each other.
2.4. Effects of WTO membership on International Trade
Even though theoretical work that explains the emergence and effects of international institutions had been put forth, efforts to quantify whether these institutions were performing according to theory were few until the work of Andrew Rose on the effect of the WTO membership on trade whose findings deemed the existence of the WTO as inconsequential. Rose found that WTO members did not have a more liberal trade policy compared to non-WTO members that the WTO had no impact on trade and that membership in the WTO increased the stability and predictability of members’ trade flows (Rose, 2004a; Rose, 2004b; Rose 2005). Of the three contributions, the one that sparked debate and triggered a barrage of responses in academia was Rose (2004b) in which Rose concluded that there is no empirical evidence that the WTO had played a significant role in encouraging trade. Rose describes his findings as going against conventional wisdom and being an interesting mystery.
Some of the succeeding work focused on redefining the institutional reach of the WTO (Tomz
6
(Subramanian and Wei, 2007; Eicher and Henn, 2011; Chang and Lee, 2011). Some work has focused on assessing the effect of WTO membership on the extensive and intensive margins of trade (Felbermayr and Kohler, 2006; Felbermayr and Kohler, 2010; Bista, 2015; Liu, 2009) and others focused on the type of accession3 (Allee and Scalera, 2012). Empirical analyses on the effects of WTO membership on trade have yielded diverse results, with some finding little to no effect and some finding positive effects.
Tomz et.al, (2007a) claimed to have found the solution to Rose’s interesting mystery. According to Tomz et.al, (2007a), Rose underestimated the institutional reach of the WTO by categorising a large proportion of countries to which the agreement affected as non-participants. Tomz et.al, (2007a) documented that in addition to formal members, colonies and overseas territories, defacto members4 and provisional members5 were subject to the obligations and also received full benefits of the GATT/WTO. Having put the institutional reach of the GATT/WTO in perspective, Tomz et.al, (2007a) applied the same econometric technique on the same data used by Rose and found that the GATT/WTO significantly increased trade for both formal member and non-formal member participants. In addition, the finding holds for all rounds of negotiations prior to the Uruguay round, for both developed and developing countries (Tomz et.al, 2007a). Rose (2007) dismisses the Tomz et.al (2007a) argument about the institutional reach of the GATT/WTO as unconvincing, citing that the argument rests upon the informal participation of developing countries which in fact liberalise their trade policies as they were exempted from doing so under the principle of special and differential treatment. Rose (2007) questioned how the GATT/WTO could have profound effect on developing countries’ trade and lesser effect on developed countries and how formal membership could have less trade related effects in comparison to non-formal membership. Rose (2007) however acknowledged that most colonies although not formal members had rights and obligations of the GATT/WTO and therefore should be coded as proposed by Tomz et.al (2007a).
Subramanian and Wei (2007) also attempted to solve the mystery surrounding the apparent ineffectiveness of the WTO in promoting world trade. Subramanian and Wei (2007) took into 3 Allee and Scalera (2012) hypothesised that more rigorous the process of negotiation and liberalisation commitments made by WTO membership applicants, the more the benefits realised. 4 Defacto members are countries that had just gained independence and were still in the process of assessing whether they wanted to continue being WTO members or to opt out. In the period of assessment, trade relations were still governed by the WTO 5 Provisional members are countries whose trade relations were governed by the WTO pending the conclusion of negotiations and accession into the WTO
7
account three main asymmetries; between developed and developing countries, between developing countries that joined the WTO before and those that joined after the Uruguay round, and between sectors that the WTO had been effective in abolishing trade barriers for and sectors where it was less effective-the agricultural and the textiles industry. After refining the gravity equation to account for the asymmetries, Subramanian and Wei (2007) concluded that the WTO had increased developed countries’ imports substantially but not so much for developing countries’ imports. In addition they found that WTO membership increased imports for developing countries that joined after the Uruguay round while for those that joined before, there was little effect. Moreover, the authors concluded that WTO membership had no impact on trade for high protection sectors. Kim (2010) reiterated that by excluding sectors that the WTO had little success in liberalising, the agricultural, textile and the oil sector, the trade promoting effects of WTO membership is evident.
Allee and Scalera (2012) found that the WTO had substantial trade promoting effects for members that went through a rigorous accession process and had made more liberalisation commitments than those who joined automatically and made few commitments to liberalise. Gowa and Kim (2005) and Gowa (2010) provided empirical evidence on the impact of WTO membership on trade against the backdrop of the market-failure theory6 and the security externalities argument7. Using the gravity model, Gowa and Kim (2005) and Gowa (2010) find that WTO membership increased trade for its largest industrial country members and that developing WTO member countries experienced increased trade where the developing country was a political-military ally of a developed WTO member, findings which are consistent with the market failure theory and the security externality argument.
Rose (2005b) compared the effects of WTO membership on trade to the effects of other institutions interested in increasing trade, the International Monetary Fund (IMF) and the Organisation for Economic Cooperation and Development (OECD). Employing the widely used gravity equation, the empirical analysis finds a strong positive relationship between OECD
6 Market-failure theory predicts that increases in trade will be skewed towards the largest member states of an institution and that smaller states will experience increases in trade if their relative factor endowments are similar to those of the largest members of the institution (Gowa, 2010). 7 The security-externality argument implies that joint membership in an alliance offers stronger incentives for countries to trade freely with each other than in comparison to neutrals or adversaries (Gowa, 2010).
8
membership and trade with a weaker positive relationship for WTO membership and especially weaker for the IMF.
Eicher and Henn (2011) also investigated the effect of WTO membership on bilateral trade flows controlling for the effects of individual preferential trade agreements (PTA) and unobserved heterogeneity and multilateral resistance in order to pick up differences in trade costs. The analysis found that WTO membership influences trade prior to the formation of a PTA and fosters regional trade integration among proximate developing country members at the expense of more distant trade.
2.5. Effects of the WTO on developing members’ Trade
Literature assessing the effects of the WTO on its membership finds no notable changes in trade patterns of developing countries in comparison to developed countries’ trade patterns. This has been attributed to the high levels of protectionism through tariff and non-tariff barriers by developing countries under the WTO provision of special and differential treatment (Subramanian and Wei, 2007; Rose, 2004, Rose 2007; Eicher & Henn, 2011). The S&D provision in addition allowed for non-reciprocal granting of trade concessions to developing countries by developed countries.
However, the conclusion of the Uruguay round of negotiations culminated in a regime change with respect to the obligation requirements of developing countries. According to Subramanian and Wei (2007), developing countries’ bound tariffs increased by fifty percentage points, while actual tariff reductions were smaller at twenty eight percent. Moreover, Subramanian and Wei (2007) add that developing countries are often granted extended periods between ratification and implementation of agreements, stating that developing countries may be given up to 15 years to phase in their liberalization commitments. This may also explain why past efforts to assess the trade promoting impact of the WTO on developing countries’ trade yielded no results.
Empirical studies focusing on those developing economies that joined the WTO after 1995, Jordan and Vietnam, found significantly positive effects of membership in the WTO on these countries’ foreign trade (Bussea and Groning, 2011; Cuong et al, 2015).
9
2.6. The case for South Africa
South Africa is one of developing WTO membership that took concerted efforts to integrate into the world economy by lowering both tariff and non-tariff trade barriers. Among other liberalization commitments, South Africa increased the percentage of bound tariffs lines from 18% to 98%, and substantially reduced tariff rates (Edwards, 2005).
2.6.1. The South African Economy
The South African economy is the second largest economy in Africa. In the decade preceding independence in 1994, South Africa experienced a period of declining economic growth (Faulkner and Loewald, 2008). The dismal performance of the country’s economy was as a result of inter alia, trade and financial sanctions imposed in opposition to the apartheid regime and declining investment. (Smit and du Plessis, 2006; Faulkner and Loewald, 2008). The transition into a democracy of the Republic of South Africa in 1994 marked an end to the isolation of the economy. The economy realised positive growth rates again as a result of foreign trade, trade liberalisation strategies as well as policy measures aimed at addressing the skewed distribution of wealth, income and opportunity in the South African economy (McCarthy, 2005). As observed in figure 1, South Africa’s average real GDP growth rate steadily declined from 1960 to 1979. The GDP growth rate for the years 1995-1999 was 2.58 percent which represents a substantial improvement on the 0.19 percent average growth rate for the period 1990-1994.
Figure 1: South Africa’s Average Real GDP Growth, 1962-2014 (at constant 2010 prices) Source: Author’s construct, using data obtained from World Bank’s WDI database 0.00 1.00 2.00 3.00 4.00 5.00 6.00 7.00
10
2.6.2. South Africa’s Trade Regime
South Africa has been a member of the WTO since January 1995 and a member of the GATT since June 1948 (WTO website). Prior to 1980, South Africa’s trade and industry policy was primarily aimed at promoting industrialisation through import substitution (Edwards, 2005). Edwards, 2006 adds that by the end of the GATT Uruguay round, South Africa had substantially reduced the level of protection, binding 98% of its tariff lines, reducing tariff rates and phasing out export subsidies among other reforms. Figure 2 shows the value of South Africa’s merchandise trade for the period 1992 to 2004. It can be noted that after 2002, South Africa experienced a period of high growth in the value of merchandise trade, which plunged in 2009 in the wake of the global economic and financial crisis and picked up again in 2010. The leap in the growth of merchandise trade may be attributed to the anticipated signing of the Trade, Development and Cooperation Agreement (TDCA) between South Africa and the EU countries, which came into effect in January 20048. The top 5 destinations for South African exports as at February 2016 are Germany (8.2%), United States (8.0%), China (7.4%), Botswana (5.3%) and Japan (4.9%) (South African Revenue Service, SARS Website).
Figure 2: Value of South Africa’s Foreign Trade for the period 1992-2014 (in thousand USD) Source: Author’s Construct using data from the OECD STAN Bilateral Trade Database 8 This is as per the anticipatory trade promoting effects of trade agreements rationale. Magee (2008) finds anticipatory trade effects of trade agreements of about 25%, 4 years prior to the entry into force of the agreement. 0 20000000 40000000 60000000 80000000 100000000 120000000 1992 1993 1994 1995 1996 1997 1998 1999 2000 2001 2002 2003 2004 2005 2006 2007 2008 2009 2010 2011 2012 2013 2014 EXPORTS IMPORTS
11
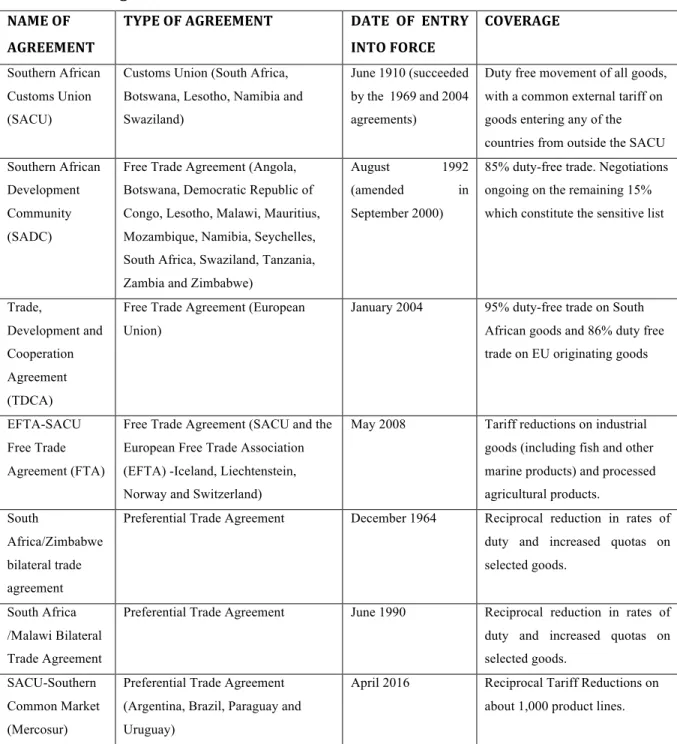
In addition to being a WTO member, South Africa is a contracting party to a number of bilateral and regional trade agreements. The agreements have been summarised in table 1.
Table 1: Trade agreements between South Africa and the rest of the world
NAME OF AGREEMENT
TYPE OF AGREEMENT DATE OF ENTRY
INTO FORCE
COVERAGE
Southern African Customs Union (SACU)
Customs Union (South Africa, Botswana, Lesotho, Namibia and Swaziland)
June 1910 (succeeded by the 1969 and 2004 agreements)
Duty free movement of all goods, with a common external tariff on goods entering any of the countries from outside the SACU Southern African
Development Community (SADC)
Free Trade Agreement (Angola, Botswana, Democratic Republic of Congo, Lesotho, Malawi, Mauritius, Mozambique, Namibia, Seychelles, South Africa, Swaziland, Tanzania, Zambia and Zimbabwe)
August 1992 (amended in September 2000)
85% duty-free trade. Negotiations ongoing on the remaining 15% which constitute the sensitive list
Trade,
Development and Cooperation Agreement (TDCA)
Free Trade Agreement (European Union)
January 2004 95% duty-free trade on South African goods and 86% duty free trade on EU originating goods
EFTA-SACU Free Trade Agreement (FTA)
Free Trade Agreement (SACU and the European Free Trade Association (EFTA) -Iceland, Liechtenstein, Norway and Switzerland)
May 2008 Tariff reductions on industrial goods (including fish and other marine products) and processed agricultural products.
South
Africa/Zimbabwe bilateral trade agreement
Preferential Trade Agreement December 1964 Reciprocal reduction in rates of duty and increased quotas on selected goods.
South Africa /Malawi Bilateral Trade Agreement
Preferential Trade Agreement June 1990 Reciprocal reduction in rates of duty and increased quotas on selected goods.
SACU-Southern Common Market (Mercosur)
Preferential Trade Agreement (Argentina, Brazil, Paraguay and Uruguay)
April 2016 Reciprocal Tariff Reductions on about 1,000 product lines.
Source: Department of Trade and Industry, South Africa, Ministerio de Relaciones Exteriores, Uruguay
Owing to the paucity of literature assessing the impact of the WTO on its developing membership, the current paper brings to light the prospects availed by membership in the WTO for the South African economy against the backdrop of the Uruguay Round liberalization reforms. The paper intends to provide answers to the following questions: (i) Does the WTO have any trade promoting effects on South Africa’s export level? (ii) What are the effects of
12
preferential trade agreements on South Africa’s trade? The paper hypothesizes that in line with the reciprocity and non-discrimination principles of the theory of the GATT, South Africa’s foreign trade will expand in the period post 1995, in comparison to the period preceding 1995. As already mentioned above, the conclusion of the Uruguay round of negotiations culminated in a regime change with respect to the obligation requirements of developing countries including South Africa. Subramanian and Wei (2007) suggested that developing countries are often granted extended periods between ratification and implementation of agreements, stating that developing countries may be given up to 15 years to phase in their liberalization commitments. This may also explain why past efforts to assess the trade promoting impact of the WTO on developing countries’ trade yielded no results.
This paper’s contribution to existing literature is twofold; (1) The paper focuses on a specific country, South Africa, which joined the WTO by default as a colony, undertaking no reciprocal trade liberalisation until 1995; (2) The paper utilises data that covers some years before, and 15 years after the conclusion of the Uruguay round to allow for the implementation of the liberalisation obligations.
13
3. Methodology
3.1. Model Specification
This section outlines the methodology employed in carrying out this empirical study. The gravity model is utilised to examine the effects of the WTO on South Africa’s level of exports. The gravity model is a widely used tool in the analysis of bilateral trade because of its proven ability to explain a large fraction of variations in the volume of trade (Subramanian and Wei, 2007). The basic model posits that trade between countries is directly related to the sizes of trading partners’ economies (often measured by the Gross Domestic Product (GDP), GDP per capita, Gross National Product (GNP) or GNP per capita) and inversely related to the distance between the country pairs. The model is often stated in its log-linearized form as;
𝑙𝑛𝐵𝑇%& = 𝛽)+ 𝛽+ln 𝑌%+ 𝛽/ln 𝑌&+ 𝛽0𝑙𝑛𝐷%& + 𝜀%& (1)
where BTij is the volume of bilateral trade between reporting country i and trading partner j, Yi,
and Yj are the GDPs of country i and j respectively, while Dij measures the distance between the
capital cities of the two countries. Β0 is the constant while
ε
ij is a zero mean, constant varianceand normally distributed random error term. For the purpose of this study, the cross section gravity equation is employed and is augmented to take into account other factors that affect the level of trade between countries such as geographical, economic and cultural proximity. Thus, the model includes the GDP per capita of the trading partner, which is indicative of the income/purchasing power of the importing country, includes dummies for countries that share a border and/ or have a common language with South Africa and dummies to capture the effects of preferential trade agreements and membership in the WTO. The model is therefore stated as follows;
𝑙𝑛𝐸𝑥𝑝(78)& = 𝛽) + 𝛽+𝑙𝑛𝐷(78)&+ 𝛽/𝑙𝑛 𝑌& + 𝛽0𝑙𝑛 𝑌 𝑃
& + 𝛾+𝐿𝑎𝑛𝑔(78)&+ 𝛾/𝐵𝑜𝑟(78)&+ 𝛾0𝐴𝐹𝑇𝐴 + 𝛾D𝐸𝑈𝐹𝑇𝐴 + 𝛾F𝑊𝑇𝑂&+ 𝜀(78)&
(2) where:
ü ln ExpSAj denotes the value of exports from South Africa to country j.
ü ln Yj is the log of GDP of country j,
14
ü ln (Y/P)j is the log of the GDP per capita of country j
ü Lang is a binary dummy variable which is unity if country j and South Africa have a common language and zero otherwise,
ü Bor is a binary variable that is unity if South Africa and country j share a border, and zero otherwise,
ü AFTA is a binary variable that is unity if country j is an African country that has a preferential trade agreement with South Africa (SACU + SADC + Malawi + Zimbabwe), and zero otherwise,
ü EUFTA is a binary variable that is unity if country j is a European country that has a preferential trade agreement with South Africa (TDCA + EFTA), and zero otherwise, ü WTO is a binary variable that is unity if country j is a member of the WTO and zero
otherwise.
ü
ε
SAj is a normally distributed random error term that has a zero mean and a constantvariance.
3.2. A priori Expectation and Justification
In line with the predictions of the gravity model, the signs of variable coefficients are expected to be as follows; (1) 𝛽+ (Distance coefficient) is expected to be negative because the model predicts that countries trade less the further away they are from each other. Distance is understood to be a reflection of transport and time related costs, (2) GDP and GDP per capita variables serve as an indication of the importing country j’s level of income and hence an indication of the importing country’s capacity to demand and absorb imports from its trading partners including South Africa. Therefore, 𝛽/ (GDP coefficient) and 𝛽0(GDP per capita coefficient) are expected to be positive because the higher the GDP and per capita GDP of a country, the bigger its ability to demand imports from its trading partners and consequently the higher the volume of trade. Bergstrand (1989) also derived the gravity equation at the industry level that predicts that the exports of a good depend upon income and per capita income; (4) 𝛾+ and 𝛾/ are expected to have a positive relationship with the level of bilateral exports since sharing a border and language implies reduced costs and easier market access (Bergstrand, 1989; Micco
15
the cost of trade between signatories of a trade agreement (regional or multilateral). The bigger the trade concession granted (low tariff or high quotas) the bigger the expected volume of trade.
3.3. Data Sources
This section briefly describes the data used in carrying out this empirical analysis. South Africa’s bilateral exports data to one hundred and fifty six countries, for the years ranging 1992 to 2009, was sourced from the International Monetary Fund’s Direction of Trade Statistics database, and the OECD STAN Bilateral Trade in Goods by Industry and End-use database. This study utilises the free-on-board value of bilateral exports measured in US dollars. GDP and GDP per capita data was sourced from World Development Indicators database of the World Bank while data on bilateral distances and common languages was sourced from Centre d'Etudes Prospectives et d'Information Internationales (CEPII) distance and geography database. The CEPII database reports the official languages for each country as well as the local languages spoken by at least 20% of the population. In the case of South Africa, the common language shared with her trading partners was found to be the English language. The CEPII database reports bilateral distance as the distance between the largest cities of those two countries. The common border dummy variable was compiled from the Central Intelligence Agency (CIA) World Factbook. Information on WTO members was sourced from the WTO website.
3.4. Model Estimation
The analysis of the effects of WTO membership on South Africa bilateral export is done by comparing the results of 4 cross section gravity equations for the years ranging 1992 to 2009. The 4 cross sections are made up of the average values for the years 1992-1994, 1995-1999, 2000-2004 and 2005-2009. The GDP, per capita GDP and export values for a single cross section are an average of 5 year values except the 1992-1995 cross section which comprises of 3 years. Using averages helps to smoothen out short run fluctuations. At the beginning of the observation period (1992), 43 countries out of the 153 countries trading with South Africa were not members of the WTO, and end of the observation period (2009), only 18 out of the 153 were non-WTO members. Descriptive statistics and the correlation matrices for the variables can be found in
16
Appendix 1 and 2 respectively. The equations are estimated using Ordinary Least Squares (OLS).
4. Results and Discussion
4.1. Pooled OLS regression results
This section presents the results of the cross section gravity model for the periods 1992-1994, 1995-1999, 2000-2004 and 2005-2009. The pooled OLS regression results have been summarized in table 2. Table 2: Gravity model estimation using OLS Explanatory Variables 1992-1994 1995-1999 2000-2004 2005-2009 Constant 13.98119*** (4.039863) 15.76435*** (3.000698) 20.07824*** (2.831614) 17.27163*** (2.841395) Ln_DistanceSAj -2.894808*** (0.508244) -2.639339*** (0.342802) -3.172824*** (0.324087) -2.885710*** (0.358715) Ln_GDPj 0.987173*** (0.096902) 0.944622*** (0.069996) 0.956269*** (0.067081) 1.003371*** (0.079033) Ln_PerCapitaj 0.436682*** (0.139288) 0.124827 (0.097823) 0.153465* (0.084860) 0.063351 (0.094479) Language 0.725404** (0.324504) 1.106277*** (0.236750) 1.153525*** (0.190017) 1.109270*** (0.211079) Border -0.155182 (0.469536) -0.074795 (0.303431) -0.620876 (0.409772) -0.093167 (0.499567) AFTA 2.143375*** (0.522343) 1.473771*** (0.401401) 0.696138** (0.318070) 0.705084 (0.438176) EUFTA - - -0.259844 (0.295854) -0.006709 (0.299729) WTO 1.088267** (0.490924) 0.719538* (0.367799) 0.793729** (0.378676) 0.690368** (0.344013) R-Squared Number of Obs 0.7346 135 0.7623 147 0.7957 148 0.7639 149
Notes: *, **,*** indicate the level of significance at 10%, 5% and 1% respectively. The robust standard errors are in parentheses
From the findings, it can be noted that most of the variable coefficient have the signs that have been predicted by theoretical literature except for the border and EUFTA. The level of South
17
African exports is found to increase with the GDP and per capita GDP of its trading partner and diminish with distance. A 1 percent point increase in GDP is found to have approximately 0.98 to 1 percent increase in the level of exports throughout the period under observation while a 1 percent increase in distance reduces the volumes exported by approximately 2.6 to 3.17 percent
ceteris paribus. The per capita GDP variable is positive and significant at 1% level during
1992-1994 and significant at 10% in 2000-2004 while in the other periods, the variable is insignificant. The instability of the variable in determining South Africa’s exports may be an indication that exports depend more on the trading partner’s overall economic size rather than its income level. The border coefficients are statistically insignificant throughout the period under examination with mixed signs, suggesting that geographical proximity may not be important in explaining the variations in the exports of South Africa to its partners. This is an unexpected results as literature hypothesizes that contiguous geographical proximity, which can be taken to imply reduced transaction costs, should have a positive effect on the volumes traded. It is however not surprising for this study because only 6 countries out of the 153 trading partners share a border with South Africa, which may be too small to show the border effect. The EUFTA also yielded an insignificant result with mixed signs suggesting that signing a preferential trade agreement with the European Union did not have a significant trade creating effect. This finding is also contrary to the expected results since a trade agreement between partners is expected to increase volumes trade. In addition, the EU is one of South Africa’s biggest export destinations especially Germany and the UK. On the other hand, the EU also comprises of a diverse group of countries which South Africa may not trade much with, leading to the insignificant result. Moreover, some of the effect may be absorbed by the GDP per capita variable. The coefficient of the Africa Free Trade Agreements (AFTA) is positive and significant at 5% but the magnitude of the coefficients show a decline from 2.143375 in the 1992-1994 period to 1.473771 in the 1995-1999 sub-period. This may be an indication that South Africa may be exporting more to other parts of the world than to other African countries over time. The common language variable produced a positive and significant result at 1% level of significance, indicating that having a common language is important for the level of exports of South Africa. Having a common language with South Africa increases the volumes exported by approximately 0.7 percent in 1992-1994, 1.1% in 1995-1999, 1.5% in 2000-2004 and 1.1% in 2004-2009, ceteris paribus. The value of the R-squared shows an improvement from the sub-period 1992-1994 to 2004-2009.
The WTO coefficient is positive and significant at all levels, in all the periods. Being a WTO member increases the level of exports between South Africa and the export destination by
18
approximately 1.08% in the period prior to 1995, while in the period post 1995, the magnitude of the increase ranges from 0.69% to 0.79%, ceteris paribus. The results indicate that South Africa’s membership in the WTO has a positive effect on the volume of exports between South Africa and her trading partners. However, we cannot conclude that the coefficient in the period prior to 1995 is statistically significant from that of the period post.
4.2. Residual Diagnostics
The precision of OLS regression estimates relies on the crucial assumption that the error terms are independently distributed (that is their covariance is equal to zero), normally distributed, and that the variance of the error terms is constant (Homoscedastic). However, the above mentioned conditions do not always prevail in economic data. This section thus outlines the tests conducted on the data to check for violations of these conditions and remedies of the problems detected.
4.2.1. Heteroscedasticity
The presence of heteroscedasticity in the error terms of a correctly specified linear model results in consistent parameter estimates but the t-values of the estimated coefficients cannot be trusted as they may lead to improper inferences in statistical hypothesis testing (White, 1980). The presence of heteroscedasticity was tested using White’s test and the null hypothesis of homoscedasticity was rejected for all 4 cross sections hence the problem of heteroscedasticity should be taken into account. Heteroscedasticity robust standard errors were used to correct this problem and the OLS estimates have been summarised in table 2. The results of the White’s test can be found in appendix 3. No notable difference in the signs and the magnitude of the variable coefficients exists after taking into account the heteroscedasticity problem.
4.2.2. Normality
Non-normality of the error terms leads to least square estimates that cannot be trusted and wrong statistical inferences and, overall suboptimal result because the amount of error or predictive ability in the model would not be consistent across the dependent variables (Jarque and Bera, 1980). Testing for the normality of the residuals is therefore integral in ensuring the precision of variable coefficients. 3 out of the 4 cross sections led to a rejection of the null hypothesis of normally distributed residuals. Statistical literature suggests several ways of dealing with the non-normality of the errors. These include transforming the data either into logs, square roots,
19
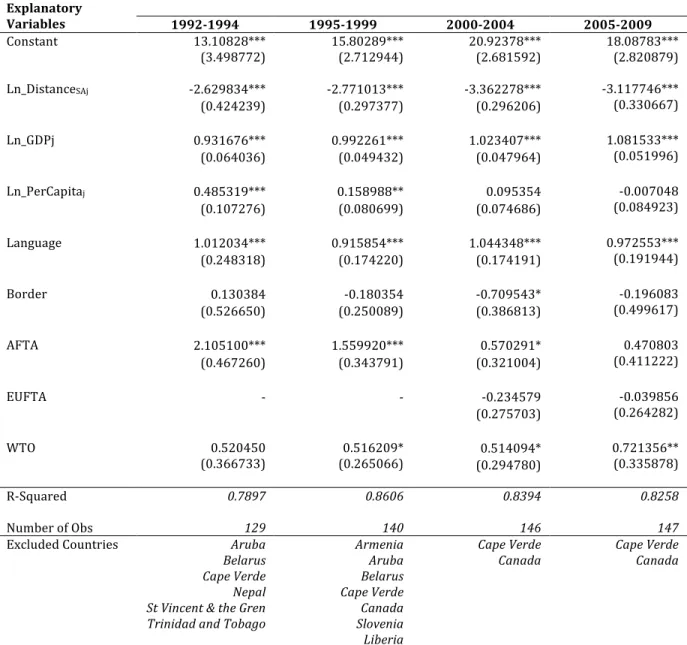
or inverses, changing the functional form of the model or removing the outliers in the data. Since the data used is already in logs, removing outliers was chosen as a solution to the non-normality problem. Osborne and Overbay, (2004) found that outlier removal altered the chances of making both Type I and Type II errors through the resultant changes in the correlations and t-tests and the enhanced accuracy of the estimates. The OLS estimates after solving the non-normality problem have been summarised in table 3 below.
Table 3: Model estimates after removing outliers Explanatory Variables 1992-1994 1995-1999 2000-2004 2005-2009 Constant 13.10828*** (3.498772) 15.80289*** (2.712944) 20.92378*** (2.681592) 18.08783*** (2.820879) Ln_DistanceSAj -2.629834*** (0.424239) -2.771013*** (0.297377) -3.362278*** (0.296206) -3.117746*** (0.330667) Ln_GDPj 0.931676*** (0.064036) 0.992261*** (0.049432) 1.023407*** (0.047964) 1.081533*** (0.051996) Ln_PerCapitaj 0.485319*** (0.107276) 0.158988** (0.080699) 0.095354 (0.074686) -0.007048 (0.084923) Language 1.012034*** (0.248318) 0.915854*** (0.174220) 1.044348*** (0.174191) 0.972553*** (0.191944) Border 0.130384 (0.526650) -0.180354 (0.250089) -0.709543* (0.386813) -0.196083 (0.499617) AFTA 2.105100*** (0.467260) 1.559920*** (0.343791) 0.570291* (0.321004) 0.470803 (0.411222) EUFTA - - -0.234579 (0.275703) -0.039856 (0.264282) WTO 0.520450 (0.366733) 0.516209* (0.265066) (0.294780) 0.514094* 0.721356** (0.335878) R-Squared Number of Obs 0.7897 129 0.8606 140 0.8394 146 0.8258 147 Excluded Countries Belarus Aruba Cape Verde Nepal St Vincent & the Gren Trinidad and Tobago Armenia Aruba Belarus Cape Verde Canada Slovenia Liberia Cape Verde
Canada Cape Verde Canada
The signs and magnitudes of the least square estimates are similar before and after removing the outliers. The level of South African exports is found to increase with the size of its trading partner and diminish with distance. In addition, having a common language is also found to positively
20
influence the volumes of exports. EUFTA has no statistically significant effect on South African exports while AFTA has a positive and significant effect in the period prior to 2000 and insignificant effect after. The per capita GDP of the trading partners is found to positively and significantly influence South Africa’s export levels in the period prior to 1999 and insignificant after. Sharing a border with South Africa has no significant trade promoting effect except in 2000-2004 where an expected negative effect is found. As already mentioned, this may be attributed to the small number of countries sharing a border with South Africa relative to the total number of trading partners. South Africa’s membership in the WTO is found to have no significant effect on the level of exports between the years 1992 to 1994. Removing outliers however, has an intriguing effect on the behaviour of the WTO variable. WTO membership has an insignificant effect on the level of South African exports in the period prior to 1995, being a WTO member has a positive and significant impact in the period after 1995. This finding is consistent with the reciprocity rationale of the theory of the GATT. This finding is also consistent with that of Eicher and Henn (2011) and Subramanian and Wei (2007) who found that countries that actively bargained for tariff reductions exhibited positive and significant WTO trade promoting effects, while countries that do not engage in the reduction of trade barriers did not.
4.3. Multicollinearity Test
Correlation among the independent variables has also been tested using the Variance Inflation Factor (VIF) method. The variance inflation factor is a measure of how much the variance of the estimated coefficient has been inflated. It is calculated using the equation below:
𝑉𝐼𝐹% = 1 1 − 𝑅
%/ (3)
Where R2i is the R-squared of the auxiliary regression obtained by regressing each of the
independent variable on the remaining independent variables. According to Mansfield and Helms (1982), the least squares coefficients in the presence of multicollinearity are often inflated, have inflated variances, and hence inflated standard errors, and may have signs that are inconsistent with the expected theoretical properties of the variables. A VIF of 1 implies that there is no correlation between the independent variable under assessment and the remaining independent variables, while a VIF exceeding 4 is an indication of some multicollinearity problem and therefore should be investigated further while a VIF exceeding 10 is a sign of
21
serious multicollinearity. In accordance with the general rule of 4, the VIFs shown in table 4 below show no evidence of the multicollinearity problem among the chosen independent variables, therefore the OLS estimates can be trusted.
Table 4: Collinearity among independent variables (Variance Inflation Factor, VIF) 1992-1994 1995-1999 2000-2004 2005-2009 Ln_DIST 3.33 3.3 3.34 3.3 Ln_GDPJ 1.65 1.6 1.6 1.58 Ln_PerCapita 1.93 1.88 2.18 2.15 Language 1.15 1.14 1.16 1.16 Border 2.28 2.3 2.28 2.26 AFTA 2.72 2.73 2.74 2.75 EUFTA - - 1.46 1.46 WTO 1.2 1.11 1.07 1.06
22
5. Conclusion
The current study set out to bring to light the prospects availed by membership in the WTO for the South African economy. In addition the paper aimed to quantify the effects of the regional trade agreements that South Africa is signatory to. In spite of the extensive research that has been done in examining the effects of WTO membership on members’ trade, little research has been done on the developing membership of the WTO especially after the completion of the Uruguay round of negotiations where developing countries were obliged to open up their markets by lowering trade barriers. The current paper utilised the gravity equation to analyse bilateral trade data between South Africa and one hundred and fifty six of its trading partners ranging from 1992 to 2009. The data was converted into 4 cross sections using the average values for the years 1992-1994, 1995-1999, 2000-2004 and 2005-2009. A series of diagnostic tests were undertaken on both the residuals and the dependent variables, and the problems found were solved to ensure that the least square estimates were as accurate as possible.
The empirical findings of this paper are that membership in the WTO has a positive influence on the level of exports between South Africa and her trading partners. After removing outliers, the results indicated that membership in the WTO had no significant trade promoting effect on the level of South African Exports in the period before 1995. After 1995 however, when South Africa lowered both tariff and non-tariff trade barriers to trade, a positive and significant result is found, and the magnitude of the impact seems to be slightly increasing over time. Among other liberalization commitments, South Africa pledged to increase the percentage of bound tariffs lines from 18% to 98%, and to reduce tariff rates (Edwards, 2005). This finding is consistent with the prediction of the economic theory of the GATT. Subramanian and Wei (2007) and Eicher and Henn (2011) also found that countries that engaged in tariff reductions experienced a positive and significant trade promoting effect from membership in the WTO. This result is an indication that the honeymoon is over for South Africa and similar developing countries and that trade liberalisation, economic diversification and innovation should be at the heart of their development agenda if they are to remain relevant in the global market or create jobs locally. One of the major impediments of this study has been the availability of data particularly for the countries that share a border with South Africa, that make up the Southern African Customs Union (SACU). It would be interesting, in future to investigate what membership in the WTO means to this customs union, since the countries trade tariff and quota free, have a common external tariff to third parties and engage in all trade negotiate as one bloc.
23
References
Allee, T. L., & Scalera, J. E. (2012). The Divergent Effects of Joining International Organisations: Trade Gains and The Rigors of WTO Accession. International
Organisation, 66(2), 243-276.
Bagwell, K., & Staiger, R. W. (1999). An Economic Theory of GATT. The American
Economic Review, 89(1), 215-248.
Balassa, B. (1963). An Emprical Demonstration of Classical Comparative Costs Theory. The
Review of Economics and Statistics, 45(3), 231-238.
Bergstrand, J. H. (1989). The Generalized Gravity Equation, Monopolistic Competition, and the Factor-Proportions Theory in International Trade. The Review of Economics and
Statistics, 71(1), 143-153.
Busse, M., & Gröning, S. (2012). Assessing the Impact of Trade Liberalization: The Case of Jordan. Journal of Economic Integration, 27(3), 466-486.
Chang, P. L., & Lee, M. J. (2011). The WTO trade effect. Journal of International Economics,
85(1), 53–71.
Cuong, H. C., Trang, T. T., & Thi, N. D. (2015). The Impact of the World Trade Organization (WTO) on Foreign Trade: Case Study of Vietnam. British Journal of Economics,
Management & Trade, 7(3), 200-217.
Du Plessis, S., & Smit, B. (2007). South Africa's Growth Revival After 1994. Journal of
African Economies, 16(5), 668-704.
Dutt, P., Mihov, I., & Van Zandt, T. (2013). The Effect of the WTO on the Extensive and Intensive Margins of Trade. Journal of International Economics, 91(2), 204-219. Edwards, L. (2005). Has South Africa liberalised its trade? South African Journal of
Economics, 73(4), 754-775.
Eicher, T. S., & Henn, C. (2011). In search of WTO trade effects: Preferential trade agreements promote trade strongly, but unevenly. Journal of International Economics, 83(2), 137-153.
Felbermayr, G., & Kohler, W. (2006). Exploring the Intensive and Extensive Margins of World Trade. Review of World Economies, 142(4), 642-674.
Felbermayr, G., & Kohler, W. (2010). Modelling the Extensive Margins of World Trade: New Evidence on GATT and WTO Membership. The World Economy, 33(11), 1430-1469. Gowa, J. (2010). Alliances, Market Power and Postwar Trade: Explaining the GATT/WTO.
24
Gowa, J., & S, K. Y. (2005). An Exclusive Club: The Effects of GATT on Trade, 1950-1994.
World Politics, 57(4), 453-478.
Herbert, A. L. (1996). Cooperation in International Relations: A Comparison of Keohane, Haas and Franck. Berkeley Journal of International Law, 14(1), 222-238.
Irwin, D. A. (1995). The GATT in Historical Perspective. The American Economic Review,
85(2), 323-328.
Jarque, C. M., & Bera, A. K. (1980). Efficient tests for normality, homoscedasticity and serial independence of regression residuals. Economics Letters, 6(3), 255-259.
Keohane, R. O. (1984). After Hegemony: Cooperation and Discord in the World Political
Economy (1st ed.). West Sussex, United Kingdom: Princeton University Press.
Kim, M. H. (2010). Does the WTO Promote Trade? Further Evidence. The Journal of
International Trade and Economic Development, 19(3), 427-431.
Krugman, P. R. (1979). Increasing returns, monopolistic competition, and international trade.
Journal of International Economics, 9(4), 469-479.
Langhammer, R. J., & Lucke, M. (1999). WTO Accession Issues. The World Economy, 22(6), 837-873.
Liu, X. (2009). GATT/WTO Promotes Trade Strongly: Sample Selection and Model Specification. Review of International Economics, 17(3), 428-446.
MacDougall, G. D. (1951). British and Amerian Exports: A Study Suggested by the Theory of Comparative Costs. Part I. The Economic Journal, 61(244), 697-724.
MacDougall, G. D. (1952). British and Amerian Exports: A Study Suggested by the Theory of Comparative Costs. Part II. The Economic Journal , 62(247), 487-521.
Mansfield, E. R., & Helms, B. P. (1982). Detecting Multicollinearity. The American
Statistician, 36(3), 158-160.
Martin, W., & Ianchovichina, E. (2001). Implications of China’s Accession to the World Trade Organisation for China and the WTO. The World Economy, 24(9), 1205-1219.
Micco, A., Dollar, D., & Ximena, C. (2004). Port efficiency, maritime transport costs, and bilateral trade. Journal of Development Economics, 75(2), 417–450.
Milner, H. V. (1999). The Political Economy of International Trade. Annual Review of
Political Science, 2(1), 91-114.
Osborne, J. W., & Overbay, A. (2004). The power of outliers (and why researchers should always check for them). Practical Assessment, Research & Evaluation, 9(6).
25
Ossa, R. (2011). A “New Trade” Theory of GATT/WTO Negotiations. Journal of Political
Economy, 119(1), 122-152.
Ricardo, D. (1817). On the Principles of Political Economy and Taxation (3rd ed.). Ontario, Canada: Batoche Books.
Rose, A. (2005). Which International Trade Institutions Promote International Trade? Review
of International Economics, 13(4), 682-698.
Rose, A. (2005b). Which International Institutions Promote International Trade? Review of
International Economics, 13(4), 682–698.
Rose, A. K. (2004a). Do WTO Members Have a More Liberal Trade Policy. Journal of
International Economics, 63(2), 209-235.
Rose, A. K. (2004b). Do We Really Know that The WTO Increases Trade. The American
Economic Review, 94(1), 98-114.
Rose, A. K. (2005a). Does The WTO Make Trade More Stable? Open Economies Review,
16(1), 7-22.
Rose, A. K. (2007). Do We Really Know That the WTO Increases Trade? Reply. The
American Economic Review, 97(5), 2019-2025.
Smith, A. (1776). An Inquiry into the Nature and Causes of the Wealth of Nations. London: Methuen & Co., Ltd: Edwin Cannan, ed. 1904. Library of Economics and Liberty. Stern, R. M. (1962). British and American Productivity and Comparative Costs in International
Trade. Oxford Economic Papers, 14(3), 275-296.
Subramanian, A., & Wei, S. (2007). The WTO Promotes Trade, Strongly But Unevenly.
Journal Of International Economics, 72(1), 151-175.
Tomz, M., Goldstein, J. L., & Rivers, D. (2007a). Does The WTO Really Increase Trade? Comment. The American Economic Review, 97(5), 2005-2018.
Tomz, M., Goldstein, J. L., & Rivers, D. (2007b). Institutions in International Relations: Understanding the effects of the GATT and the WTO on World Trade. International
Organisation, 61(1), 37-67.
White, H. (1980). A Heteroskedasticity-Consistent Covariance Matrix Estimator and a Direct Test for Heteroskedasticity. Econometrica, 48(4), 817-838.
Winham, G. R. (1998). The World Trade Organisation Institution- Building in the Multilateral Trade System. The World Economy, 21(3), 349-368.
Yongtu, L. (2000). On The Question Of Our Joining the World Trade Organisation. The
26
Appendix 1: Descriptive Statistics
1992-1994
Mean Standard Deviation Minimum Maximum No. of Observations ln_Exp 15.4363 3.315761 6.50229 21.16296 135 ln_Dist 8.922552 0.502 6.904225 9.598754 135 ln_GDPj 23.33427 2.198195 18.9632 29.56384 135 ln_PerCapita 7.508236 1.612845 4.444962 10.67052 135 LANGUAGE 0.292208 0.456261 0 1 135 BORDER 0.038961 0.194133 0 1 135 AFTA 0.077922 0.268923 0 1 135 WTO 0.720779 0.45008 0 1 135 1995-1999
Mean Standard Deviation Minimum Maximum No. of Observations ln_Exp 16.27639 2.608855 9.852194 21.54042 147 ln_Dist 8.922552 0.502 6.904225 9.598754 147 ln_GDPj 23.55501 2.18757 19.32283 29.78563 147 ln_PerCapita 7.730024 1.603659 4.725882 10.8288 147 LANGUAGE 0.292208 0.456261 0 1 147 BORDER 0.038961 0.194133 0 1 147 AFTA 0.077922 0.268923 0 1 147 WTO 0.779221 0.416125 0 1 147 2000-2004
Mean Standard Deviation Minimum Maximum No. of Observations ln_Exp 16.60376 2.535813 10.42193 21.86536 148 ln_Dist 8.922552 0.502 6.904225 9.598754 148 ln_GDPj 23.73071 2.201806 18.07669 30.04102 148 ln_PerCapita 7.856723 1.623857 4.780148 10.9632 148 LANGUAGE 0.292208 0.456261 0 1 148 BORDER 0.038961 0.194133 0 1 148 AFTA 0.077922 0.268923 0 1 148 EUFTA 0.162338 0.369963 0 1 148 WTO 0.863636 0.344294 0 1 148
27
2005-2009
Mean Standard Deviation Minimum Maximum No. of Observations ln_Exp 17.39146 2.596984 9.814988 22.56658 149 ln_Dist 8.922552 0.502 6.904225 9.598754 149 ln_GDPj 24.35325 2.18659 18.87635 30.27811 149 ln_PerCapita 8.401129 1.596495 5.10968 11.48676 149 LANGUAGE 0.292208 0.456261 0 1 149 BORDER 0.038961 0.194133 0 1 149 AFTA 0.077922 0.268923 0 1 149 EUFTA 0.175325 0.381485 0 1 149 WTO 0.883117 0.322329 0 1 149 Appendix 2: Correlation Matrices 1992-1994
Exports Distance GDPj PerCapita Language Border AFTA WTO Exports 1.000000 Distance -0.154164 1.000000 GDPj 0.679588 0.347179 1.000000 PerCapita 0.442742 0.487141 0.587877 1.000000 Language 0.063925 -0.129493 -0.174507 -0.049366 1.000000 Border 0.165317 -0.414247 -0.071288 -0.135032 0.054705 1.000000 AFTA 0.261316 -0.624559 -0.149113 -0.255380 0.180672 0.488592 1.000000 WTO 0.379229 -0.098606 0.163301 0.266894 0.104853 0.069750 0.069757 1.000000 1995-1999
Exports Distance GDPj PerCapita Language Border AFTA WTO Exports 1.000000 Distance -0.215013 1.000000 GDPj 0.672898 0.346970 1.000000 PerCapita 0.316225 0.511870 0.582589 1.000000 Language 0.178142 -0.139772 -0.134583 -0.019546 1.000000 Border 0.190551 -0.412046 -0.062521 -0.129693 0.057899 1.000000 AFTA 0.302726 -0.621490 -0.143769 -0.261257 0.185139 0.489546 1.000000 WTO 0.304412 -0.076716 0.130871 0.191913 0.107523 0.061952 0.126550 1.000000
28
2000-2004
Exports Distance LN_GDPj PerCapita Language Border AFTA EUFTA WTO Exports 1.000000 Distance -0.267739 1.000000 GDPj 0.656263 0.360186 1.000000 PerCapita 0.291395 0.489069 0.574856 1.000000 Language 0.206043 -0.166345 -0.132634 -0.023485 1.000000 Border 0.240309 -0.510268 -0.080694 -0.103911 0.122159 1.000000 AFTA 0.333373 -0.655831 -0.134594 -0.227845 0.216105 0.565279 1.000000 EUFTA 0.199385 0.187830 0.368658 0.503851 -0.154948 -0.063281 -0.111946 1.000000 WTO 0.190290 0.008345 0.075978 0.145301 0.041210 0.058490 0.103472 0.178897 1.000000 2005-2009
Exports Distance GDPj PerCapita Language Border AFTA EUFTA WTO Exports 1.000000 Distance -0.241592 1.000000 GDPj 0.672184 0.349841 1.000000 PerCapita 0.258946 0.497903 0.567305 1.000000 Language 0.153959 -0.167444 -0.156963 -0.064763 1.000000 Border 0.217779 -0.510365 -0.101763 -0.135166 0.122596 1.000000 AFTA 0.307218 -0.656012 -0.137113 -0.240970 0.216844 0.565362 1.000000 EUFTA 0.199725 0.192756 0.354932 0.510260 -0.178558 -0.067435 -0.119278 1.000000 WTO 0.181431 0.031821 0.116715 0.100019 0.003379 0.053136 0.093985 0.174382 1.000000 Appendix 3: White’s Heteroscedasticity Test 1992-1994 Heteroskedasticity Test: White F-statistic 2.340345 Prob. F(26,108) 0.0012 Obs*R-squared 48.65064 Prob. Chi-Square(26) 0.0045 Scaled explained SS 62.61432 Prob. Chi-Square(26) 0.0001 1995-1999 Heteroskedasticity Test: White F-statistic 0.939156 Prob. F(25,121) 0.5523 Obs*R-squared 23.88860 Prob. Chi-Square(25) 0.5258 Scaled explained SS 50.15589 Prob. Chi-Square(25) 0.0020 2000-2004
29 Heteroskedasticity Test: White F-statistic 1.057641 Prob. F(31,116) 0.4007 Obs*R-squared 32.61348 Prob. Chi-Square(31) 0.3875 Scaled explained SS 62.67162 Prob. Chi-Square(31) 0.0006 2005-2009 Heteroskedasticity Test: White F-statistic 0.831331 Prob. F(31,117) 0.7180 Obs*R-squared 26.89560 Prob. Chi-Square(31) 0.6774 Scaled explained SS 81.16123 Prob. Chi-Square(31) 0.0000 Appendix 4: Normality Test BEFORE REMOVING OUTLIERS AFTER REMOVING OUTLIERS 1992-1994 0 2 4 6 8 10 12 14 -5 -4 -3 -2 -1 0 1 2 3 Series: Residuals Sample 1 154 Observations 135 Mean -9.47e-15 Median 0.096671 Maximum 3.379860 Minimum -5.384575 Std. Dev. 1.651479 Skewness -0.722523 Kurtosis 3.908541 Jarque-Bera 16.38902 Probability 0.000276 0 2 4 6 8 10 12 14 -4 -3 -2 -1 0 1 2 3 Series: Residuals Sample 1 148 Observations 129 Mean -6.58e-15 Median 0.063434 Maximum 3.087013 Minimum -4.268890 Std. Dev. 1.331631 Skewness -0.450984 Kurtosis 3.276137 Jarque-Bera 4.782654 Probability 0.091508 1995-1999 0 4 8 12 16 20 -4 -3 -2 -1 0 1 2 3 4 Series: Residuals Sample 1 154 Observations 147 Mean 3.52e-15 Median 0.118259 Maximum 4.087198 Minimum -4.628574 Std. Dev. 1.258605 Skewness -0.388850 Kurtosis 5.696414 Jarque-Bera 48.23723 Probability 0.000000 0 5 10 15 20 25 -2 -1 0 1 2 3 Series: Residuals Sample 1 147 Observations 140 Mean -6.09e-15 Median 0.085940 Maximum 2.892244 Minimum -2.551477 Std. Dev. 0.932841 Skewness -0.017888 Kurtosis 3.199797 Jarque-Bera 0.240328 Probability 0.886775