HF CONCENTRATIONS
by Robert N. Meroney David E. Neff Seong-Hee Shin Thomas C. Steidle Thomas Z. Tan Gang WuFLUID
MECHANICS AND WIND ENGINEERING PROGRAM
CER88-89RNM-DEN-SHS-TS-TZT-GW-1
Co~do
ANALYSIS OF VAPOR BARRIER EXPERIMENTS TO EVALUATE THEIR EFFECTIVENESS AS A MEANS TO
MITIGATE HF CLOUD CONCENTRATIONS
FINAL REPORT (April 1988 - June 1988) by Robert N. Meroney* David E. Neff/I Seong-Hee Shin+ Thomas C. Steidle+ Thomas Z. Tani! Gang Wu+
Fluid Mechanics and Wind Engineering Program Civil Engineering Department
College of Engineering COLORADO STATE UNIVERSITY Fort Collins, Colorado 80523
for
EXXON Research and Engineering Company Florham Park, New Jersey 07932
on behalf of
An Industry Cooperative HF Mitigation Program Vapor Barrier Subcommittee
July, 1988
(Revised February, 1989)
* Professor, Civil Engineering
II
Research Associate+ Graduate Research Assistant
Colo~ctg
Cniversity-'/
INDUSTRY COOPERATIVE HF MITIGATION/ASSESSMENT PLAN PREFACEANALYSIS OF VAPOR BARRIER EXPERIMENTS TO EVALUATE THEIR EFFECTIVENESS AS A MEANS TO
MITIGATE HF CLOUD CONCENTRATIONS
This report is one of several work products generated by the Industry Cooperative HF Mitigation/Assessment Program. This ad hoc industry program was begun in late 1987 to study and test techniques for mitigating accidental releases of hydrogen fluoride (HF) and alkylation unit acid and to better estimate ambient impacts from such releases.
The hazards of HF have long been recognized, and operating practices have been aimed at minimizing the possibility of a release and mitigating the effects of a release should it occur. These practices have been continually monitored and improved to maximize safety protection based on the available technical data. This recent program has been aimed at further improvements based on new technical data.
This program has been sponsored and funded by twenty companies from the chemical and petroleum industries. These include Allied-Signal, Amoco, Ashland, Chevron, Conoco/Dupont, Dow, Elf Aquitaine, Exxon, Kerr-McGee, Marathon, Mobil, Phillips, Saras, Shell Internationale, Sohio, Sun, Tenneco, Texaco, Unocal, and 3M.
This document was prepared by the Fluid Mechanics and Wind Engineering Program, Colorado State University, as a part of its work for the Vapor Barrier Technical Subcommittee. The authors wish to acknowledge the interaction and encouragement of Rudolf Diener, EXXON Research and Engineering Company and Chairman of the Vapor Barrier Subcommittee, and the support and constructive criticism provided by all of the subcommittee members.
The results from this program are being publishe.d with the intent of making them available to any party with an interest in the subject matter. All are free to used these results subject to the rights of others. It is intended that the information presented herein will contribute to the further maximization of safety protection. However, neither the sponsors of this work nor their contractors accept any legal liability or responsibility whatsoever for the consequences of its use or misuse by anyone.
ABSTRACT
ANALYSIS OF VAPOR BARRIER EXPERIMENTS TO EVALUATE THEIR EFFECTIVENESS AS A MEANS TO
MITIGATE HF CLOUD CONCENTRATIONS
Accidental releases of Hydrogen Fluoride (HF) can result in initially dense, highly reactive and corrosive gas clouds. These clouds will typically contain a mixture of gases, aerosols and droplets which can be transported significant distances before lower hazard levels of HF concentration are reached. Containment fences or vapor barriers have been proposed as a means to hold-up or delay cloud expansion, elevate the plume downwind of the barriers, and enhance cloud dilution.
Previous related field and laboratory experiments have been analyzed to estimate the effectiveness of barrier devices. The experiments were examined to determine their relevance to Hydrogen Fluoride spill scenarios. Wind tunnel and field data were compared where possible to validate the laboratory experiments. Barrier influence on peak concentrations, cloud arrival time, peak concentration arrival time, and cloud departure time were determined. These data were used to develop entrainment models to incorporate into integral and depth averaged numerical models. The models were then run to examine barrier performance for a typic'al Hydrogen Fluoride spill for a wide range of vapor barrier heights, spill si~es, meteorological conditions and release
configurations. Finally the results of the data analysis and numerical sensitivity study were interpreted and expressed in a form useful to evaluate the efficacy of vapor barrier mitigation devices.
EXECUTIVE SUMMARY
ANALYSIS OF VAPOR BARRIER EXPERIMENTS TO EVALUATE THEIR EFFECTIVENESS AS A MEANS TO
MITIGATE HF CLOUD CONCENTRATIONS
Accidental releases of Hydrogen Fluoride (HF) can result in initially dense gas clouds that will typically contain a mixture of gases, aerosols and droplets which can be transported significant distances before lower hazard levels of HF concentration are reached. Containment fences, vapor barriers, and water-spray curtains have been proposed as a means to hold-up or delay cloud expansion, elevate the plume downwind of the barriers, enhance cloud dilution, and/or remove HF from the gas cloud , by deposition.
Exxon Research and Engineering Company, in conjunction with and on behalf of an ad hoc Industry Cooperative Hydrogen Fluoride (HF) Mitigation and Assessment Group has funded this study to assess the effectiveness of vapor barriers in diluting and delaying heavier-than-air HF vapor clouds. This data will provide a foundation of information to use to develop mitigation strategies, initialize numerical plume models, and/or design follow-up field and laboratory experiments. A secondary purpose of this study is to review evidence related to the accuracy and credibility of laboratory simulation of dense gas dispersion in the presence of vapor barriers. This information will be used to assess the value of future physical modeling experiments directed toward the mitigation of HF vapor clouds.
Previous related field and laboratory experiments have been analyzed to estimate the effectiveness of barrier devices. The experiments were examined to determine their relevance to Hydrogen Fluoride spill scenarios. ~ind tunnel and field data were compared where possible to
validate the laboratory experiments. Barrier influence on peak concentrations, cloud arrival time, peak concentration arrival time, and cloud departure time were determined. These data were used to develop entrainment models to incorporate into integral and depth averaged numerical models. The models were then run to examine barrier performance for a typical Hydrogen Fluoride spill for a wide range of vapor barrier heights, spill sizes, meteorological conditions and release configurations. Finally the results of the data analysis and numerical sensitivity study were interpreted and expressed in a form useful to evaluate the efficacy of vapor barrier mitigation devices~
Dilution Performance of Vapor Barriers in the Near-field Region
Eleven data sets from field and laboratory experiments dealing with the influence of vapor barrier fences and water spray curtains on the dispersion of dense gas clouds were examined. Tests were paired into sets of data which reflected the dilution of the cloud with and without the barriers present. Peak concentration ratios, cloud arrival time ratios, peak arrival time ratios, and departure time ratios were calculated for
each test pair. · Consideration of the regions immediately downwind from the fences and ~prays (distances less than 300 m downwind of the barriers) reveals that:
Vapor Barrier Fences:
@
@
Addidonal dilution occurs downwind of turbulence produced by the shear at the top for about 30 fence heights. Near concentrations ranges from 1.1 to 5.0.
the fence as the of the fence persists field reduction in
Cloud !arrival time, peak arrival time, and departure time ratios often !increase directly downwind of a fence because lower winds in the wake advect the cloud more slowly. However, farther
downw~nd the cloud arrives earlier because once the cloud leaves the wake region it is transported downwind with the greater depth averaged velocities associated with the increased cloud height. Near f~eld I increase in arrival, peak arrival, and departure times . range ·from 1.1 to 5.0.
Water Spriay Curtains: Removal Characteristics
@ Concerltrations in a gas cloud will decrease abruptly as a result of chebical reaction and removal processes associated with HF and water : spray interaction, even .when accelerated entrainment assoc ] ated with the water spray curtain is not considered. The removdl efficiency will be a function of water/HF volume ratios, water :droplet sizes and cloud concentrations.
I
Dilution Perfonmance of Vapor Barriers in the Mid to Far-field Region
I
HF is hazardous at ppm levels. Thus, far-field concentrations are of interest in1 evaluating mitigation strategies. Most laboratory and
field experimerlts were originally constructed to consider the behavior of flammable gaseJ ; hence, measurements were only taken at distances out to 1000 m ·downwind or less. Consideration of the regions modestly far downwind of barriers and spray curtains (300 m to 1000 m) reveals that:
Vapor Barrier Fences:
@
Entra~nment levels return to pre-fence levels at distancesgreater than 30 to 50 fence heights downwind of the ·fence location. After that point the concentrations generally asymptote to levels found in the absence of the fence or barrier about 2000 m downwind of fences placed between
10
and 100 metersdownw~nd of the spill site. A numerical model extrapolation
sugge~ts no discernible barrier effect will be present beyond 200
fence heights. ·
.-""
@ Peak concentrations measured during the experiments did not
gener~lly fall below 10,000 ppm of simulant or 150,000 ppm HF
Water Spray Curtains: Removal Characteristics
@ The reduction in HF cloud concentrations spray/cloud deposition processes persists distances.
Proposed Entrainment Models
induced by water at all downwind
Given a box or depth-integrated type numerical model simple expressions to account for the increased entrainment associated with water spray curtains or fence barriers may be used with confidence. These models do not account for chemical reactions, deposition, gravity current reflection, rapid flow speed up through a porous barrier, or the presence of a hydraulic jump downwind of a barrier. Both the initial dilution and post-barrier concentration decay are predicted well.
Laboratory Simulation of a Hydrogen Fluoride Spill
The capabilities and limitations of physical modell,ing techniques for HF gas clouds were reviewed. Performance envelopes were constructed to illustrate the constraints of facility size and gravity spreading. The following conclusions were made:
@
Laboratory simulation of a pure HF release with an isothermal simulant is not recommended. Reliable simulations would be limited to prototype wind speeds greater than 5 m/sec at scales less than 1:100. Model concentrations must be adjusted upward by a factor of 15 in the far downwind regions.@
Laboratory simulation of a pre-diluted HF cloud can be accomplished. Reliable simulations should be possible at all distances for prototype wind speeds greater than 5 m/sec at scales less than 1:100.I
TABLE OF CONTENTS
i
ABSTRACT ii
EXECUTIVE SUMMXRY . iii
LIST OF TABLES viii
I
LIST OF FIGURES ix
LIST OF SYMBOLS' . . . xxii
DEFINITION OF ~EY TERMS AND ABBREVIATIONS xxv
1.0 INTRODUCT~ON . . . . 1
2 3 7
2.0
1.1 The Formation Phase of a Hazardous Cloud
1.2 Fluid Modeling of Atmospheric Phenomena 1 3 R . eport rgan1zat1on . . . . I 0 . . DISPERSION OF.HYDROGEN FLUORIDE GAS CLOUDS .
2.1 Source Characteristics . . . .
2.2 Stat~ Equations for Hydrogen Fluoride .
2.3 Hydrogen Fluoride Spill Experience . . . . 2. 4 Entra!inment Models for Vapor Barriers and Water Spray
Curtains 8 8 9 10 12
3.0 APPLICABLE DATA BASES
3.1 Field Experiments . 21 21
22
3. 2 Labor:atory Experiments
4. 0 RESULTS FROM DATA BASE EVALUATION . . . 26 4 .1 Dispe1
rsion of Vapor from LNG Spills at Green Point Energy Centeir: Simulation in a Wind Tunnel," Kothari and Meroney, 1980 . . . 28 4. 2 Dispelrsion of Vapor from LNG Spills at Energy Service
Termipal Corporation: Simulation in a Wind Tunnel," Kothari and Meroney, 1981 . . . 33 4. 3 "LNG Plume Interaction with Surface Obstacles," Kothari,
Meroney, and Neff, 1981 . . . · 45 4. 4 "Accelerated Dilution of Liquefied Natural Gas Plumes with
Fence1s and Vortex Generators," Kothari, and Meroney,
1982 . . . 53 4. 5 "Model Studies of LNG Vapor Cloud Dispersion with Water
Spray Curtains," Meroney et al., 1983, 1984, and Heskestad et al,. , 1985 . . . 61 4. 6 "Larg1e Scale Field Trials on Dense Vapor Dispersion,"
McQuaid and Roebuck, 1984 . . . 71 4. 7 "Wind! Turinel Modeling of the Thorney Island Heavy Gas
4.8 "LNG Vapor Barrier and Obstacle Evaluation: Wind-tunnel Prefield Test Results," Neff and Meroney, 1986 . . . 93 4.9 "Wind Tunnel Modeling of Density Current Interaction with
Surface Obstacles," Koenig and Schatzmann, 1986 . . . 112 5. 0 EVALUATION OF NUMERICAL MODELS PROPOSED FOR WATER SPRAY AND
VAPOR BARRIER DILUTION EFFECTS . . . 127 5.1 Comparison of Numerical Models with Goldfish Trials Data 127 5.2 Calibration of the Vapor Barrier Fence Entrainment Model 128 5.3 Calibration of the Vapor Removal Model . . . . 129 6.0 PREDICTION OF HYDROGEN FLUORIDE DILUTION . . 135 6.1 Goldfish Trial No. 1 with Vapor Barrier Fences 136 6.2 Goldfish Trial No. 1 with Water Sprays . . . . 137 7. 0 REMARKS ABOUT LABORATORY SIMULATION OF A HYDROGEN FLUORIDE
SPILL . . . 141 7.1 Wind Tunnel Performance Envelope for HF Spills . . . 141 7.2 Conversion of Model Concentrations to HF Concentrations . 143 7.3 Potential for Laboratory Simulation of a Reactive Hydrogen
Fluoride Plume 144
8.0 CONCLUSIONS . . . . 147
8.1 Dilutio~ Performance of Vapor Barriers in the Near-field
Region . . . 147 8.2 Dilution Performance of Vapor Barriers in the Far-field
Region . . . 149
8.3 Vertical Concentration Distributions 150
8.4 ANOVA Regression Model . . . 150 8.5 Proposed Entrainment Models . . . . 151 8.6 Laboratory Simulation of a Hydrogen Fluoride Spill 151 REFERENCES
APPENDIX: Numerical
Plumes Simulation of Water Spray
vii
153 Dilution of Gas
LIST OF TABLES
Table No. Title
2.3-1 Spill .and Meteorological Conditions During Goldfish Trials . . . . 3.1-1 Swnmary of Field and Laboratory Tests Reviewed 4.6-1
4.6-2
4. 7·-1
4.7-2
Spill and Meteorological Conditions During Thorney Island Trials . . . .
Obstacle Configurations During Thorney Island Trials .
Prototype and Model Conditions Compared from Thorney Island Field and Model Tests by Davies and Inman . . . . Summary of Surface Pattern Comparison Results for Thorney Island Trials . . . .
15 24 74 75 88 89
LIST OF FIGURES Fig. No.
Hydrogen Fluoride Cloud Characteristics 2.2-1 2.2-2 2.2-3 2.2-4 2.2-5 2 .2-6 2.2-7 2.3-1 2.3-2
Cloud Density vs Air Dilution for Various
Initial Temperatures with 60% Relative Humidity (W. J. Hague, 1988) . . . . Cloud Density vs Air Dilution for Various Humidity Conditions with Temperatures of 100°F
(W. J. Hague, 1988) . . . . Cloud Density vs Air Dilution, Isothermal and Ideal Gas Conditions to Simulate Goldfish Trials 1 and 2 . . . . Cloud Density vs Air Dilution, Isothermal and Ideal Gas Conditions to Simulate Goldfish Trial 3 Cloud Density vs Air Dilution, Isothermal a~d
Ideal Gas Conditions to Simulate 60% Relative Humidity and Air Temperatures of 15° ·C .. Cloud Density vs Mole Fraction, Ideal Gas
S imulants . . . . .
Cloud Temperature vs Air Dilution, Ideal Gas Simulants . . . . . .
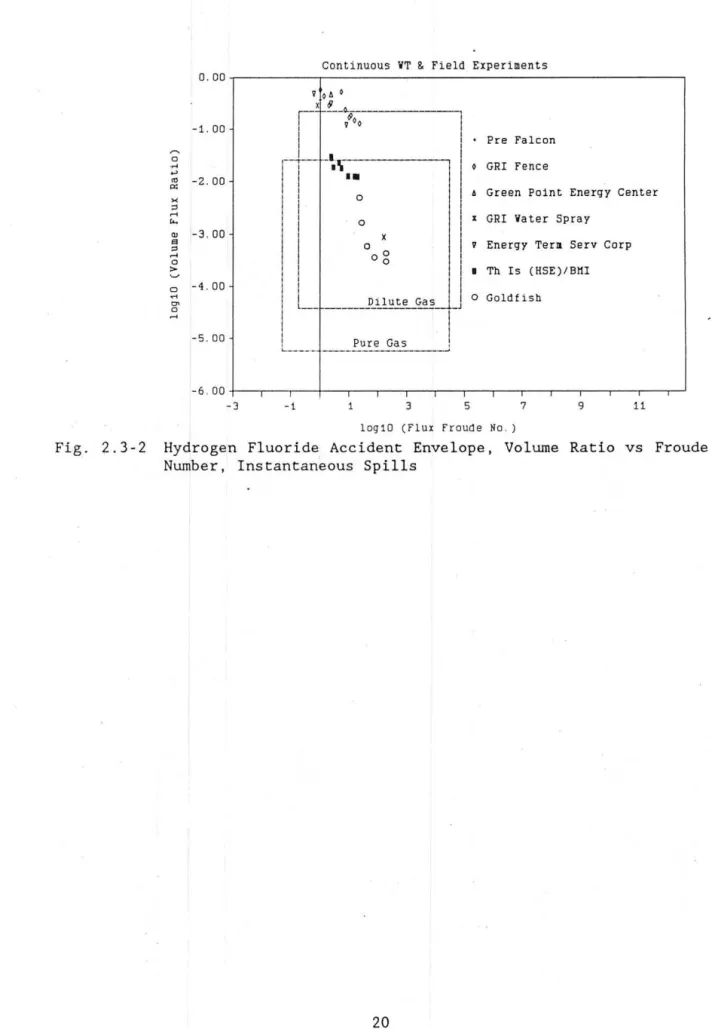
Hydrogen Fluoride Accident Envelope, Volume Flux Ratio vs Flux Froude Number, Continuous Spills . . . . Hydrogen Fluoride Accident Envelope, Volume Ratio vs Froude Number, Instantaneous Spills Wind Tunnel Study of Green Point Energy Center. New York 4.1-1
4.1-2
4.1-3
Experimental Configuration and Measurement Grid, Green Point Energy Center . . . Peak Concentration Ratio vs Crosswind Distance at X = 122 m, Continuous Spill at Green Point
Energy Center
Peak Concentration Ratio vs Crosswind Distance at X = 122 m, Instantaneous Spill onto Soil
Dike Floor at Green Point Energy Center
ix 16 16 17 17 18 18 19 19 20 29 30 30
Fig. No. 4 . 1-4
4.1-5
4.1-6
4.1-7
Peak Concentration Ratio vs Crosswind Distance at X = 122 m, Instantaneous Spill onto
Insul ~ ted Dike Floor at Green Point Energy
Cent.er . . . . . . . Peak doncentration Ratio vs Crosswind Distance I at X = 269 m, Continuous Spill at Green Point
Energy; Center
.... .. .. .
Peak Concentration Ratio vs Crosswind Distance at X = 269 m, Instantaneous Spill onto Soil Dike Floor at Green Point Energy Center
Peak Concentration Ratio vs Crosswind Distance at X = 269 m, Instantaneous Spill onto
Insulated Dike Floor at Green Point Energy Center .
Wind Tunnel Study of Energy Service Terminal Corporation, New York 4.2-1 4.2-2 4.2-3 4 . 2-4 4.2 - 5 4.2-6 4.2-7 4 . 2-8 4.2-9 I
Experimental Configuration and Measurement Grid, 315°, Energy Terminal Service Corporation LNG RE:llease Areas "P" and "D",
Service Corporation Energy Terminal Peak Concentration Ratio vs Crosswind Distance, Energy Terminal Service Corporation . . . . . Peak Concentration Ratio vs Crosswind Distance, Energy Terminal Service Corporation . . . . . Peak Goncentration Ratio vs Crosswind Distance, Energy Terminal Service Corporation
Experimental Configuration and Measurement Grid, 270°, Energy Terminal Service
Corporation
Peak Concentration Ratio vs Crosswind Distance, Energy Terminal Service Corporation . . . . . Peak Concentration Ratio vs Crosswind Distance, Energy Terminal Service Corporation
Experimental Configuration and Measurement Grid, 215°, Energy Terminal Service
Corporation . . . . 31 31 32 32 35 36 36 37 37 38 39 39 40
Fig. No. 4.2-10 4.2-11 4.2-12 4.2-13 4.2-14 4.2-15
Peak Concentration Ratio vs Crosswind Distance, Energy Terminal Service Corporation . . . . . Peak Concentration Ratio vs Crosswind Distance, Energy Terminal Service Corporation . . . . . Peak Concentration Ratio vs Crosswind Distance, Energy Terminal Service Corporation
Experimental Configuration and Measurement Grid, 215°, Source Area P*, Energy Terminal
Servic~ Corporation . . . .
Peak Concentration Ratio vs Crosswind Distance, Energy Terminal Service Corporation . . . . . Peak Concentration Ratio vs Crosswind Distance, Energy Terminal Service Corporation . . . . .
Wind Tunnel Study of LNG Spill Dispersion About Obstacles for GRI
4.3-1 4.3-2 4.3-3 4.3-4 4.3-5 4.3-6
Concentrat{on Measurement Locations and Configuration 1 - 22 Spill Arrangement Peak Concentration Ratio vs Downwind Distance, Configuration 15 U 4
and 7 m/sec
Peak Concentration Ratio vs Downwind Distance, Configurations 2, 15 and 20 . . . .
Peak Concentration Ratio vs Downwind Distance, Configurations 8, 17 and 22 . . . .
Peak Concentration Ratio vs Downwind Distance, Configurations 2, 3, 4, 5, 6, and 8 . . .
Peak Concentration Ratio vs Downwind Distance, Configurations 20, 21, and 22 41 41 42 43 44 44 47 50 50 51 51 52
Wind Tunnel Study of LNG Spill Dispersion Downwind of Fences and Vorte~
Generators, GRI
4.4-1
4.4-2
Concentration Measurement Locations and Configuration 0 Spill Arrangement
Fence and Vortex Spire Configurations 1, 2, and 3
xi
55
Fig. No. 4.4-3 4.4-4 4.4-5 4.4-6 4.4-7
Model 'Fence Enclosures . . Model Vortex Spire Enclosures
Peak Concentration Ratio vs Downwind Distance, Q - 2q m3/min LNG, Fence Height - 10 m, Wind
Speed= 4, 7, 9, and 12 m/sec . . . Peak Concentration Ratio vs Downwind Distance,
Q -
20 m3/min LNG, Fence Heights - 5 and 10 m.Wind S1
peed - 4 m/sec, Fences and Vortex Spires Peak Concentration Ratio vs Downwind Distance, Q =
2d
m3/min LNG, Fence Height ... 10 m, Wind57 58
59
. . . 59
Speed - 4 m/sec, Configurations 1, 2, and 3 . . . . 60 Wind Tunnel Study of LNG Spill Interaction with Water Spray Curtains. GRI 4.5-1 4.5-2 4 . 5-3 4.5-4 4.5-5 4.5-6 4.5-7 4.5-8 4.5-9 4.5-10 4.5-11
Experimental Configuration and Measurement Grid, Health and Safety Executive C02jWater Spray Trial No. 46 . . . . Experimental Configuration and Measurement Grid, 1Generic Bunded Spill Area
Water Spray Configurations for Generic Bunded Spill Area . . . .
Tank ~nd Fence Configurations for Generic Bunded Spill Area . . . .
Peak ~oncentration Ratio .. vs Downwind Distance,
HSE Trial No. 46 . . . . Vertical Concentration Profiles at X - 18.3 m, HSE Trial No. 46 . . . . . . Peak Concentration Ratio vs Downwind Distance, Water :Spray together with Small, Medium and Large Tank Obstacles
Vertical Concentration Profiles, No Tank Vertical Concentration Profiles, Small Tank Vertical Concentration Profiles, Medium Tank Vertidal Concentration Profiles, Large Tank
63 63 64 65 66 66 67 67 68 68 69
Fig. No. 4.5-12
4.5-13
4.5-14
Peak Concentration Ratio vs Total Water Spray Discharge Rate . . . . Vertical Concentration Profiles at X
Various Water Spray Discharge Rates Vertical Concentration Profiles at X for Various Water Spray Discharge Rates
90 m for
390 m
Thorney Island Dense Gas Dispersion Trials 4.6-1 4.6-2 4.6-3 4.6-4 4.6-5 4.6-6 4.6-7 4.6-8 4.6-9 4.6-10 4. 6-11 4.6-12 4.6-13
Spill Configuration and Measurement Grid, Thorney Island Trials . . . . .
Obstacle Arrangements, Phases II and III, Thorney Island Trials . . . .
Peak Concentration Ratio vs Downwind Distance, Thorney Island Trials 8 and 22
Arrival Time Ratio vs Downwind Distance, Thorney Island Trials 8 and 22
Peak Arrival Time Ratio vs Downwind Distance, Thorney Island Trials 8 and 22
Departure Time Ratio vs Downwind Distance, Thorney Island Trials 8 and 22
Peak Concentration Ratio vs Downwind Distance, Thorney Island Trials 19 and 23
Arrival Time Ratio vs Downwind Distance, Thorney Island Trials 19 and 23 . . . . Peak Arrival Time Ratio vs Downwind Distance, Thorney Island Trials 19 and 23 . . . . . Departure Time Ratio vs Downwind Distance, Thorney Island Trials 19 and 23
Peak Concentration Ratio vs Downwind Distance, Thorney Island Trials 43, 45, and 50
Arrival Time Ratio vs Downwind Distance, Thorney Island Trials 43, 45, and SO .. Peak Arrival Time Ratio vs Downwind Distance, Thorney Island Trials 43, 45, and SO . . .
xiii 69 70 70 76 77 80 80 81 81 82 82 83 83 84 84 8S
Fig. No.
4.6-14 Departure Time Ratio vs Downwind Distance, Thorney Island Trials 43, 45, and 50 . . .
Wind Tunnel Simulation of Thorney Island Dense Gas Trials. NMI 4.7-1
4.7-2
4.7-3
Surface Pattern Comparison Results, f-N vs Angular Displacement . . . . Surface Pattern Comparison Results, Bar Charts of f-N .vs Angular Displacement . . . . Surface Pattern Comparison Results, Bar Charts of f-N vs Angular Displacement . . . .
Wind Tunnel Pre-field Test Study of Falcon LNG Test Series , LLNL 4.8-1 4.8-2 4.8-3 4.8-4 4.8-5 4.8-6 4.8-7 4.8-8 4.8-9
Fence Enclosure Geometry, Pre-Falcon Wind-tunnel Tests . . . . . . . Measurement Grid, Pre-Falcon Wind-tunnel Tests . . . .
Peak Concentration Ratio vs Downwind Distance, V = 100 m3 , Q = 40 m3/min LNG, Various
Enclosure Arrangements .
Arrival Time Ratio vs Downwind Distance, V 100 m3 , Q = 40 m3/min LNG , Various Enclosure
Arrangements
Peak Arrival Time Ratio vs Downwind Distance, V = 100 m3 , Q = 40 m3/min LNG, Various
Enclosure Arrangements . . . . Departure Time Ratio vs Downwind Distance, V = 100 m3 , Q = 40 m3/min LNG, Various
Enclosure Arrangements . . . . Peak Concentration vs Downwind Distance, 14.1 m Vortex Generator and Fence,
Q = 40 m3/min LNG, Various Total Spill Volumes
Arrival Time Ratio vs Downwind Distance, 14.l m Vortex Generator and Fence,
Q = 40 m3/min Ll.~G, Various Total Spill Volumes
Peak Concentration Ratio vs Downwind Distance, 14.1 m Vortex Generator and Fence,
V = 100 m3 LNG, Various Spill Rates
85 90 91 92 96 97 98 98 99 99 100 100 101
Fig. No. 4.8-10 4.8-11 4.8-12 4.8-13 4.8-14 4.8-15 4.8-16 4.8-17 4.8-18 4.8-19 4.8-20 4.8-21
Peak Time Ratio vs Downwind Distance, 14.1 m Vortex Generator and Fence, V = 100 m3 LNG, Various Spill Rates
Peak Concentration vs Height at X = 15 m, V = 100 m3 , Q = 40 m3/min LNG, Various
Enclosure Arrangements . . . . .
Arrival Time vs Height at X = 15 m, V = 100 m3 ,
Q = 40 m3/min LNG, Various Enclosure
Arrangements
Peak Arrival Time vs Height at X 15 m, V = 100 m3 , Q = 40 m3/min LNG, Various
Enclosure Arrangements . . .
Departure Time vs Height, at X 15 m, V = 100 m3 , Q = 40 m3/min LNG, Various
Enclosure Arrangements . . .
Peak Concentration vs Height at X = 75 m,
V = 100 m3 , Q = 40 m3/min LNG, Various
Enclosure Arrangements . . . . .
Arrival Time vs Height at X = 75 m, V = 100 m3 ,
Q = 40·m3/min LNG, Various Enclosure
Arrangements
Peak Arrival Time vs Height at X = 75 m, V = 100 m3 , Q = 40 m3/min LNG, Various
Enclosure Arrangements . . . . Departure Time vs Height at X = 75 m, V = 100 m3 , Q = 40 m3/min LNG, Various
Enclosure Arrangements . . . . Peak Concentration vs Crosswind Distance at X = 15 m, V = 100 m3 , Q ~ 40 m3/min LNG,
Various Enclosure Arrangements . . Arrival Time vs Crosswind Distance at X = 15 m, V = 100 m3 , Q = 40 m3/min LNG,
Various Enclosure Arrangements
Peak Arrival Time vs Crosswind Distance at X = 15 m, V = 100 m3 , Q = 40 m3/min LNG,
Various Enclosure Arrangements . . . .
xv 101 102 102 103 103 104 104 105 105 106 106 107
Fig. No. 4.8-22 4.8-23 4.8-24 4.8-25 4.8-26 4.8-28 4.8-29 4.8-30 i
Depar ~ure Time vs Crosswind Distance at
X = 15 m, V = 100 m3 , Q - 40 m3/min LNG,
Various Enclosure Arrang~ments . . . . .
Peak Concentration vs Crosswind Distance at X - 7 5 m, V - 100 m3 , Q - 40 m3 /min LNG,.
Various Enclosure Arrangements . .
I I
Arrival Time vs Crosswind Distance at
X -
71
m, V =- 100 m3 , Q - 40 m3/min LNG,Various Enclosure Arrangements . . . . Peak Arrival Time vs Crosswind Distance at
X = 75 m, V = 100 m3 , Q - 40 m3/min LNG, Various Enclosure Arrangements . . . Departure Time vs Crosswind Distance at X = 7 51 m , V :z 100 m3 , Q =- 40 m3 /min LNG ,
Various Enclosure Arrangements . . .
Peak Ooncentration Ratio vs Downwind Distance, Volumel Flux Ratio ... 0 .1, Total Volume
Ratio I,... 10, 50, and 100, Predicted by ANOVA
Relation
Peak Concentration Ratio vs Downwind Distance, Total .Volume Ratio = 50, Volume Flux
Ratio - 0.01, 0.1, and 1.0, Predicted by ANOVA Relation
Measured versus Predicted Values of the
Logar ~thmic Ratio in Concentrations With and Without Vapor Fence for Falcon Test Series . Residual versus Predicted values of the Logari1thmic Ratio in Concentrations With and
Without Vapor Fence for Falcon Test Series . Wind Tunnel Tes·ts at University of Hamburg. West Germany
i
4.9-1
4.9-2
4.9-3
Peak c,oncentration Ratio VS Downwind Distance'
Thorne'y Island Trial 20 Model Simulation Arrival Time Ratio vs Downwind Distance, Thorney Island Trial 20 Model Simulation Peak Airrival Time Ratio vs Downwind Distance, Thorneif Island Trial 20 Model Simulation . . .
I 107 108 108 109 109 110 110 111 111 115 115 116
Fig. No. 4.9-4 4.9-5 4.9-6 4.9-7 4.9-8 4.9-9 4.9-10 4.9-11 4.9-12 4.9-13 4.9-14 4.9-15 4.9-16
Departure Time Ratio vs Downwind Distance, Thorney Island Trial 20 Model Simulation Peak Concentration Ratio vs Downwind or
Transverse Distance, Finite and Infinite Walls, Calm Conditions, Instantaneous Spill
Peak Concentration Ratio vs Downwind Distance, Finite and Infinite Walls, Windy Conditions, Instantaneous Spill
Peak Concentration Ratio vs Transverse Distance, Finite and Inf~nite Walls, Windy
Conditions, Instantaneous Spill
Peak Concentration Ratio vs Downwind Distance, Finite and Infinite Canyon Walls, Instantaneous Spill . . . . Peak Concentration Ratio vs Downwind Distance, Infinite Canyon Walls, 45° Orientation,
Instantaneous Spill . . . . .
Peak Concentration Ratio vs Downwind Distance, Canyon Intersection, Instantaneous Spill
Peak Concentration Ratio vs Transverse
Distance, Canyon Intersection, Instantaneous
Spill . . . .
Peak Concentration Ratio vs Downwind Distance, Crosswind Ditch, Instantaneous Spill . . . . Peak Concentration Ratio vs Transverse
Distance, Crosswind Ditch, Instantaneous Spill . Peak Concentration Ratio vs Downwind or
Transverse Distance, Finite and Infinite Walls, Calm Conditions, Continuous Spill
Peak Concentration Ratio vs Downwind Distance, Finite and Infinite Walls, Windy Conditions, Continuous Spill . . . . Peak Concentration Ratio vs Transverse
Distance, Finite and Infinite Walls, Windy Conditions, Continuous Spill . . . .
xvii 116 117 117 118 118 119 119 120 120 121 121 122 122
Fig. No. 4.9-17 4.9-18 4.9-19 4.9-20 4.9-21 4.9-22 4.9-23
Peak Concentration Ratio vs Downwind Distance, Finite and Infinite Canyon Walls, Continuous Spill . . . . Peak Concentration Ratio vs Downwind Distance, Infinite Canyon Walls, 45° Orientation,
Continuous Spill . . . . Peak Concentration Ratio vs Downwind Distance, Canyon Intersection, Continuous Spill
Peak Concentration Ratio vs Transverse ,
Distarrce, Canyon Intersection, Continuous Spill Peak Concentration Ratio vs Downwind Distance, Crosswind Ditch, Continuous Spill, Q 150 l/h Peak Concentration Ratio vs Transverse
Distance, Crosswind Ditch, Continuous Spill,
Q = 150 l/h . . . .
Peak qoncentration Ratio vs Downwind Distance, Crosswind Ditch, Continuous Spill, Q = 500 l/h
Validation of Numerical Models bv Goldfish Trials 5.1-1 5.1-2 5.1-3 5.1-4 5.1-5 5.1-6
Comparison of Observed, SLAB and DENS62
Predidted Plume Centerline Concentrations for Goldfish Test No. 1 . . . . Comparison of Observed, SLAB and DENS62 Predid ted Crosswind Concentrations at 300 m I .
for Goldfish Test No. 1
Comparison of Observed, SLAB and DENS62
Predicted Crosswind Concentrations at 1000 m for Goldfish Test No. 1 . . . .
Comparison of Observed, SLAB and DENS62 Predicted Plume Centerline Concentrations for Goldfish Test No. 2
Comparison of Observed, SLAB and DENS62 Predicted Plume Centerline Concentrations for Goldfish Test No. 3 . . . .
Compa~ison of Ratios of Observed to SLAB and
DENS62 Predicted Plume ·centerline
. Concentrations for Goldfish Tests No. 1, 2, and 3 . . . . 123 123 124 124 125 125 126 130 130 131 131 132 132
Fig. No.
5.1-7 Predicted Plume Centerline Concentrations for Goldfish Tests Nos. 1, 2, and 3 by DENS62 Calibration of Vapor Barrier Entrainment Model
5.2-1 Comparison of Observed and FENC62 Predicted Plume Centerline Concentrations for Pre-Falcon Tests No. 5 and 10 . . . . Calibration of Numerical Water-spray Gas Removal Model 5.3-1
5.3-2
Comparison of Observed and SPRAY65 Predicted Plume Centerline Concentrations for Goldfish Test No. 4 . . . . . . .
Comparison of Observed and SPRAY65 Predicted Plume Centerline Concentrations for Goldfish Test No. 6 . . . .
Numerical Predictions of Hydrogen Fluoride Dilution by Vapor Barriers 6.1-1
6.1-2
6.1-3
6.1-4
FENG62 Predicted Plume Centerline
Concentrations for Goldfish Test No. 1,
Fence Heights - 0, 3, 6, 9, and 12 mat X - 100 m FENC62 Predicted Plume Heights for Goldfish
Test No. 1, Fence Heights == 0, 3, 6, 9, and 12 m at X - 100 m . . . . FENC62 Predicted Plume Centerline
Concentrations for Goldfish Test No. 1, Fence Height - 3 m, X - 100 m, U - 1, 2, 4, 6, and 8 m/sec . . . . FENC62 Predicted Plume Heights for Goldfish Test No. 1, Fence Height - 3 m, X - 100 m,
U - 1, 2, 4, 6, and 8 m/sec . . . 133 133 134 134 138 138 139 139
Numerical Predictions of Hydrogen Fluoride Removal by Water-spray Curtains 6.2-1
6.2-2
SPRAY65 Predicted Plume Centerline Concentrations for Goldfish Test No. 1, 80% HF Removal by Water Spray at X - 100 m
and X - 300 m . . . 140 SPRAY65 Predicted Plume Centerline
Concentrations for Goldfish Test No. 1, 80% HF Removal and w8 - 1 m/sec by Water
Spray at X - 100 m . . . .
xix
Fig. No.
Laboratory SimJlation of a Hydrogen Fluoride Spill 7.1-1
7.1-2
Performance Envelope for Simulation of HF Spills in Meteorological Wind Tunnels Conversion of Model Concentrations to HF Concentrations, Corrections for Pure Gas and Dilute Gas Model Scenarios . . . . Calibration of 1Numerical Water-spray Entrainment Model
A.2-1
A.2-2
A.2-3
Comparison of Observed and SPRAY62 Predicted Plume Centerline Concentrations for Colorado State Water Spray Tests . . . .
I
Compa~ison of Observed and SPRAY62 Predicted
Plume !Centerline Concentrations for Colorado State Water Spray Tests . . . . Comparison of Observed and SPRAY23 Predicted Plume Centerline Concentrations for Colorado State Water Spray Tests . . . .
145
146
163
163
164 Numerical Predictions of Hydrogen Fluoride Dilution by Water-spray Curtains A.3-1 A.3-2 A.3-3 A. 3-4 A.3-5
SPRAY62 Predicted Plume Centerline
Concentrations for Goldfish Test No. 1 ,
I
Water Spray Placed at X~rQ - 30, 55, . 100,
and 400 m . . . . . .
SPRAY 162 Predicted Plume Heights for Goldfish I Test No. 1, Water Spray Placed at Xspray - 30,
55, 100, and 400 m . . . . SPRAY62 Predicted Plume Centerline
Concentrations for Goldfish Test No. 1 ,
xspray = 100 m, we= 1, 2, 4, 6, 8, and 10 m/sec SPRAY62 Predicted Plume Heights for Goldfish Test No. 1, Xspray = 100 m, we = 1, 2, 4, 6, 8,
and 10 m/sec . . . .
SPRAY~2 Predicted Plume Centerline
Concentrations for Goldfish Test No. 1 ,
xspray """ 100 m, we 6 m/sec,
u -
1, 2, 4, 5.6, 8, and 10 m/sec . . . . 164 165 165 166 166Fig. No. A.3-6
A.3-7
A.3-8
SPRAY62 Predicted Plume Heights for Goldfish Test No. 1 , Xspray - 100 m, w8 - 6 m/sec, U - 1, 2, 4, 5.6, 8, and 10 m/sec . . . .
SPRAY23 Predicted Cloud Arrival and Cloud Departure Times for Goldfish Test No. 1,
Xspray - 100 m (Based on predicted cloud
heights) . . . . SPRAY23 Predicted Cloud Arrival and Cloud Departure Times for Goldfish Test No. 1,
Xsprey = 100 m (Based on predicted cloud
concentrations) . . . .
xxi
167
167
Symbol A,a,b, c,d,e B
c
p * D f-N Fr g Hv.G. H LIST OF SYMBOLS DefinitionRegression constants in ANOVA
Area of intersection between gas cloud and water spray
Characteristic cloud width calculated by cross-section averaged numerical programs Model concentration
Prototype concentration
Conc~ntrations
measured with barrier presentConcentrations measured without barrier present
Fence drag coefficient factor
Molar specific heat capacity at constant constant pressure
Molecular diffusivity
Diameter of water spray intercept area with gas1 clouds
Surface pattern comparison factor, % predicted within N
Froude number, U2/(g(SG - l)L)
Flux Froude number, U3L/(Qg(SG - 1))
Gravitational acceleration
I
Fence height
Vortex generator height
Characteristic cloud height calculated by cross-section averaged numerical programs Characteristic length, typically 10 m
[ L] [ L] [L/T2 ] [L] [ L] [ L] [ L]
Symbol M,MW MR 11 N p Pe Ri p RH
s
SG Tdap DefinitionCharacteristic length for instantaneous spills used by Koenig and Schatzman (1986)
Characteristic length for continuous spills spills used by Koenig and Schatzman (1986)
Lateral water-spray nozzle separation Molecular weight
Multiplicative factor used in water-spray entrainment model
Kinematic viscosity
Number of water-spray nozzles Fence porosity
Peclet number, U1c/D 3.1417
Source strength spill rate Air entrainment rate
Spill rate gas Spill rate liquid
Richardson number, g(l - SG)Lc/U2
Density
Relative humidity
Water-spray intersection interval Specific gravity
Ambient air temperature Dew point temperature Source gas temperature
Cloud arrival times with and without barrier
xx iii [L] [L] [L] [13 /T] [13 /T] [ 13 /T] [ 13 /T] [ 1] [ 8] [ 8] [ 8] [ T]
Symbol
Definition
I
Tp c1w , Tp '1wo P~ak concentration arrival time with and
without barrier U(H) u,., V,Vol x,y,z y I
Cloud departure times with and without barrier
I
Characteristic wind speed for instantaneous spills used by Koenig and Schatzman (1986)
I
Characteristic wind speed for continuous spills used by Koenig and Schatzman (1986) Wind speed at 10 m reference height
Wind speed at fence height Frontal velocity of dense cloud Friction velocity
Total gas volume released
Di~ensionless continuous volumetric spill
ra tle, Q/(UL3 )
Dimensionless instantaneous volume spill, Vol/L3
Air entrainment rate Convection velocity
Coordinate system, origin at spill location Downwind distance from spill location to fence
Downwind distance used for Thorney Island Trials Surf ace roughness length
[T] [T] [L/T] [L/T] [L/T] [L/T] [L/T] [L/T] [ L3] [L/T] [L/T] [ L] [L] [L] [L]
DEFINITION OF KEY TERMS AND ABBREVIATIONS
Arrival Time
Peak Arrival Time
Departure Time
Arrival Time Ratio
The time after the release a minimal level of concentration arrives at a specified downwind location
- The time after the release a peak concentration arrives at a specified downwind location
The time after the release the concentration falls below a minimal level at a specified downwind location
The ratio of the cloud arrival time with a barrier to the cloud arrival time without a barrier at a specified downwind location
Peak Arrival Ratio - The ratio of the cloud peak arrival time with a barrier to the cloud peak arrival time without a barrier at a specified downwind location
Departure Time Ratio - The ratio of the cloud departure time with a barrier to the cloud departure time without a barrier at a specified downwind location
Concentration Ratio The ratio of the peak concentration with a barrier to the peak concentration without a barrier at a specified downwind location
ANALYSIS OF VA~.OR BARRIER EXPERIMENTS TO
EVALUATE THEIR EFFECTIVENESS AS A MEANS TO MITIGATE HF CLOUD CONCENTRATIONS 1 .. 0 INTRODUCTION
Over the past twenty years there has been a marked increase in concern about the consequences of large · and small scale releases of flammable or toxic gases into the atmosphere. This new awareness reflects the increasing scale, in number and extent,. of industrial and transport operations involving these hazardous materials. The occurrence of recent disastrous accidents has focused attention on the potential risks of these operations. Regulation of production, storage and transport of such products, the design of mitigation equipment, and the preparation of accident response strategies requires an accurate evaluation procedure to predict the consequences of haz~rdous gas release.
Exxon Research and Engineering ·Company, in conjunction with and on behalf of an ad hoc Industry C6operative Hydrogen Fluoride (HF) Mitigation and Assessment Group has funded this study to assess the effectiveness of vapor barriers in diluting and delaying heavier-than-air HF vapor clouds. This data will provide a foundation of information to use to develop mitigation strategies, initialize numerical plume models, and/or design follow-up field and laboratory experiments. A secondary purpose of this study' is .to review evidence related to the accuracy and credibility of laboratory simulation of dense gas dispersion in the presence of vapor barriers. This information will be used to assess the value of future physical modeling experiments directed toward the mitigation of HF vapor clouds.
Examination of the Acute Hazardous Events Database prepared by EPA (and earlier statistics about vapor cloud accidents) reveals that three-quarters of all events occur in-plant (production, operations or storage) and one-quarter occur in-transit (truck, rail, pipeline, etc.). In-plant events are about equally divided between storage, valves and pipes, and processing. In-transit events are associated with truck and rail modes. Collisions and leaks cause most transportation deaths and injuries Storage and pipeline failures cause the majority of in-plant deaths and injuries (Crum, 1986; Wiekema, 1984; Davenport, 1977).
Thus, the majority of hazardous gas accidents result from failure of confinement whether from a stationary tank, pipeline or mobile storage container. Disregarding whether the loss of containment is due to a small leak, a complete rupture, or continuous high volume release from an aperture, the puff, plume or cloud will interact with the container, the nearby buildings, vapor barriers, water spray or the ground and the surface boundary layer to produce dilution behavior which can not be predicted by conventional isolated plume theories.
It is apPiropriate to review what is known about the physics of the initial format ~ on phase of a cloud or plume, the interaction of dense gas
clouds with barriers and the ability of fluid modeling to illuminate the entrainment mechanisms further.
1.1 The Formation Phase of a Hazardous Cloud
Hartwig and Flothman (1980) prepared diagrams outlining important processes occurring during a hazardous gas release scenario. They identified self
1
-generated dilution as an important unresolved issue during consequence analysis. Brenchley (1981) and DeSteese (1982) reviewed the hazard characteristics of operation, storage and transportation for ammonia and liquid petroleum gas products. They tabulated the typical container sizes, accident statistics, and hazards. They recommended research on mix ~ ng models, source physics, and the instantaneous character of the cloud co~centration distribution. McQuaid (1982) identified three
phases in the estimation of the consequences of a hazardous cloud release: a.) The initial formation of a cloud or plume near the source, b.) The dispersion of the cloud or plume to where it ceases to be
a hazard, and
c.) The consequences if the cloud or plume is ignited or passes over a population.
The formation phase of cloud generation is dependent on the quantity of gas releaseci (or rate of evolution from a liquid), the nature of the release (leak or rupture), and the geometry of tank, pipe and/or local buildings. Griffiths and Kaiser (1979) examined in detail the implications of different types of spills of ammonia. They evaluated small and large releases from vapor spaces in pressurized containers, small and large releases from liquid spaces, onto land, onto and under water and the effect of buildings. For ammonia they determined small leaks from vapor spaces were not a major problem, but they concluded further research was necessary about:
I
a.) The effect of intermediate size holes from vapor spaces in storage containers,
b.) The interaction of plumes with nearby buildings which could destroy plume buoyancy or alternatively encourage dense plume persistence, and
c.) Plume release configurations which might suppress lift-off. Other rellevant studies have examined the character of sources resulting from lthe evaporation from liquid pools (Shaw and Briscoe, 1978), mixing down wi~d of relief valves (Jagger and Edmondson, 1981; Samimy and
Addy, 1983), cloud formation during massive containment rupture or explosion (Kaiser and Walker, 1978; Jagger and Kaiser, 1980 ; Bodurtha, 1980), and plume formation during losses from large exhaust jets
(Abramovich, ~963; Ricou and Spalding, 1961; Wilson, 1981). Most
quantitative e~timates are based on conjecture about the release process, most verification is based on examining plume behavior downwind from the
source, and few measurements are available in the direct vicinity of the release.
Hardee and Lee (1975) developed a simple model to predict the growth of a hazardous cloud near a rupture-type containment accident. The model used two-phase flow expansion in an isentropic process. Total momentum is calculated and used to predict subsequent cloud growth, but no adjustments are made for the possible consequences of plume buoyancy or interaction with surrounding structures. Hirst (1986) has shown that liquid mass release through short circular orifices in pressurized propane tests are reliably predicted by the Bernoulli equation, but for gas or two-phase situations the mass flow is substantially less. At the other extreme of sophistication Wilson (1981) has developed a jet-plume model for estimating dispersion downwind of a buried pipeline. He incorporated transient mass release rates, expansion and acceleration of the compressible plume outside the rupture area, interaction of the supersonic jet with soil crater walls, and entrainment of ambient air into the head of the starting plume. This excellent model was calibrated and compared against full scale pipe-rupture experiments performed in Alberta during 1978. Validation of all possible source conditions against full-scale field tests is possible, but represents a very costly approach to model verification. Fluid modeling should provide equivalent data at great savings.
1.2 Fluid Modeling of Atmospheric Phenomena
Recently Briggs and Binkowski (1986) reviewed the state of numerical model prediction of plume behavior in the atmosphere. They concluded "a
major need is for diffusion experiments, both in the field and in laboratory settings. The laboratory studies are needed to test theoretical results in specific simplified situations that are free of confounding influences." The acceptance of fluid modeling by the meteorological community as a viable prediction tool is reaffirmed through their assertion that "confidence in these tools [fluid modeling] has increased to the point that they have been used extensively to investigate diffusion from releases on and near buildings and terrain features . ... . In addition to being less expensive than field experiments, laboratory modeling offers control over the meteorological variables, so that both the flow and surface characteristics can be idealized .... It is obvious that this tool has not been fully exploited ... it makes sense to use laboratory facilities as much as possible."
Complex Terrain and Buildin~ Aerodynamics:
Successful modeling of some of the more complex atmospheric surface layer and building aerodynamic phenomena in a wind tunnel have only been accomplished in the last fifteen years. Although guidelines for modeling flow over complex terrain are essentially similar to those for modeling hydraulic flows or flow around buildings, a few unique features are different. Irregular terrain may alter atmospheric airflow characteristics in a number of different ways. These effects can generally be grouped into those due to inertial-viscous interactions
associated with a thick neutrally stratified shear layer and to thermally induced intera~tions associate4 with stratification or surface heating
(Meroney, 1980).
Meroney (1980) compared three model/field investigations of flow over complex terrain, suggested performance envelopes for realizable modeling in complex terrain, and discussed recent laboratory studies which provide data for valley drainage flow situations. Not all of the model/field comparison experiments performed in the past were successful. Many early studiies had model approach flow velocity exponents near zero, were modeled as neutral flows when the field observed strong stratification effects, or simulated unrealistic boundary layer depths, integral scales, or turbulence intensities which did not match their atmospheric counterpart. But few studies claimed unreasonable correlation, and some were strongly self-critical. Nonetheless most studies accomplished their prestated limited objectives. It would appear that the simulation wisdom developed in the last few years is appropriate for physical mo~eling of flow over complex terrain.
The interaction of an approach wind field with bluff bodies or structures constructed on the earth's surface is broadly termed "Building Aerodynamics." In a review article on this subject Meroney (1982) discusses the charaGter of bluff body flow about rectangular buildings and cylindrical cooling towers. Defects in velocity profiles can easily persist to 10 to 15 building heights downwind. Turbulence excesses and deviations in temperature profiles may persist to 20 or 30 building heights downwind. Field and laboratory measurements of plume dispersion about the Rancho Seco Nuclear Power Station in Sacramento, California, confirm that cooling tower wake effects persist for significant downwind distances under a variety of stratification conditions (Allwine, Meroney and Peterka, 1979; Kothari, Meroney and Bouwmeester, 1979).
For accidrntal releases the quantity desired for safety measures is the "imrnission," which is either the concentration of the gas or the dosage. Such quantities depend upon the "emission," which is the released quantity of mass or volume, and the "transmission," which is the combined effect of the wind field at the moment of release and thereafter plus the mixing properties of the wind field determined by obstacles, surface roughness, and thermal heating. The transmission function can be divided into three regions--the region-of-release, the near-field, and the far-field. The region-of-release depends upon the source characteristics and its immediate surrounding. The near-field region is governed by the local characteristics of the industrial plant and its surroundings. In the far-field the ground is characterized by homogeneous surface roughness and heating characteristics. These regions will depend upon the nature of the mitigation device or barrier considered; for example a fence may be expected to perturb the velocity field for 10 heights downwind, the turbulence field for 20 to 30 heights downwind, and the entrainment rate over a similar distance. On the other hand, a water spray curtain produces most of its dilution or reduction very close to the water spray device. The far-field region will exist once dense-gas gravitational effects are minimal and the perturbations of barriers decay. The effect
of water-spray removal of vapor or particles will, of course, persist at all downwind distances, to the extent that it does not modify (reduce) the dynamic mixing of the vapor cloud. The distance to such a region will depend upon both spill size and barrier height.
A number of studies have been performed in the CSU Fluid Dynamics and Diffusion Laboratory to establish the near-field effect of buildings on flow fie ids and dispersion. Hatcher et al. (1977) examin~d flow and
dispersion in stratified flow downwind of the Experimental Organic Cooled Reactor, Idaho Falls; Allwine et al. (1979) studied the Rancho Seco Reactor, Sacramento; Kothari et al. (1979) studied the Duane Arnold Energy Center, Iowa. In each case field measurements were compared to laboratory measurements with good agreement.
Relatively few studies have examined the compo~ite effect of
combined building and industrial equipment upon plume dispersion. Recently Plate and Baechlin (1987) reported a wind tunnel study of dispersion over a model of one of the largest chemical plants in the
wo~ld, the Badische Anilin und Soda Fabrik (BASF) in Ludwigshafen, FRG.
Measurements of wind field and concentration over the 1:500 scale model are being used to develop a catalog of ground level concentration fields for typical plant situations. Point sources .of neutral density source gases were studied to produce generic plume behavior for different wind directions.
Hazardous Gas Dispersion:
Meroney (1982) reviewed the use of fluid modeling to evaluate the dispersion of dense gases. He notes that wind tunnels have simulated a wide range of conditions associated with dense gas transport and dispersion (bunded tanks, spills on water, water spray mitigation equipment, vertical emission through stacks, etc.) Measurements of dense fluid behavior in both air and water facilities appear reproducible and consistent. Idealized release configurations appear optimal for testing numerical or analytical models. Wind tunnels are primarily limited by operational constraint associated with the necessary low wind speeds and low Reynolds numbers.
In a two volume Gas Research Institute report Meroney (1986) provides guidelines for using fluid modeling to generate Liquid Natural Gas (LNG) dispersion information. The second volume reviews the fluid modeling _ science and the extensive model/field validation efforts performed over the last ten years. The wind tunnel was found to reproduce field data over a wide variety of scales. The comparisons between field and model data from the Thorney Island Freon-air experiments, the Maplin Sands LPG and LNG experiments, and the China Lake LNG experiments were particularly satisfying.
More recently British Maritime Technology (Davies and Inman, 1986) has completed a report on their own fluid model experiments performed to reproduce the Thorney Island experiments, and, again, plume shape and
concentration fields wene reproduced in almost every respect including instantaneous structure f f the cloud interior. They concluded that,
a.) There was nol evidence that the neutrally stable wind tunnel boundary layer failed to represent the dispersion in the more stable full-scale atmospheric conditions,
b.) Reductions in the downwind dispersion distance to a given concentration level due to vapor fences were reproduced by the laboratory experiments, and
c.) For trials involving sharp-edged mixing elements, such as buildings or fences, there was no evidence for a lower validity level for the simulation Reynolds number. For continuous and instantaneo~s releases onto unconfined terrain
the lower limits of the simulation Reynolds number (U10m*Lom/v)
for conserva! ive simulations (ie. model/full scale> 1) were 100 and 30000 respectively. (U10m is the scaled 10 m velocity in the wind tunnel, and
Lorn
is
the buoyancy length scale of the re lease) .Releases of pressurize.d, superheated Hydrogen Fluoride are known to produce a heavy (Specific Gravity - 10), cold, two phase vapor plume close to the source. (Vapor or boiling pool releases of HF will not produce such I dense clouds.) The gas cloud subsequently condenses water vapor, changes molecular polymer state through dissociation and association and consequently absorbs and releases heat to the surroundings. Special problems associated with the simulation of Hydrogen Fluoride spills and the subsequent behavior l of its vapor cloud are discussed further in Section 7.0 of this report.
Dense Vapor Interaction with Fences, Barriers and Obstacles
Dense gas plumes dispersing over the ground undergo mixing due to the turbulence produceq by gravity driven vapor spreading and the turbulence associated with the atmospheric surface flow. However, these conditions may be consid~ rably perturbed oy the additional complications of surface obstructions
·I
Such interference may cause additional plume dilution or temporary pooling of higher gas concentrations. Researchers at Colorado State Univet sity have examined a cross section of barrier, water spray and obstacle ! configurations. ;rests include the influence of high and low barrier dikes (Meroney et al : , 1976, 1977, 1980, and 1981);tanks, fences and vegetl tion barriers (Kothari and Meroney, 1981); and fences and vortex generat ors (Kothari and Meroney, 1982), and water spray curtains (Andriev et al
,I
1983, Heskestad et al, 1983, Meroney and Neff,1~83, apd Meroney et al, 1983). Recently, Neff and Meroney ( 1986)
completed a pre-field-test wind tunnel series of the Falcon LNG vapor barrier test series, andl are now preparing a post-field test program on
the Falcon tests. '
British Maritime Trchnology (Davies and Inman, 1986), as mentioned above, completed a series of wind tunnel simulation tests of some of the
Thorney Island dense gas spill experiments which included barriers. These tests were found to replicate most features of the field experiments, and they did not seem to be sensitive to model perturbations associated with low Reynolds numbers or low Peclet to Richardson number ratios developed during the model tests.
Researchers at the University of Hamburg (Konig and Schatzmann, 1986) examined the behavior of instantaneous and continuous releases of dense gases in a wind tunnel when dispersing in the vicinity of model walls, between model buildings, over model street canyons, and when confined by fences. Their data is unique in that they studied situations which actually tend to "reduce" dilution rather than enhance it. Significantly, the release scenarios they considered are frequently encountered in industrial complexes and cities.
1.3 Report Organization
The previous remarks summarize the current status of understanding for dense gas dispersion, obstacle (buildings, tanks, dikes, fences and sprays) -and terrain aerodynamics and physical simulation of these flows. Currently there are no analytic algorithms or numerical programs capable of producing the necessary flow defect/dispersion information. The following chapters discuss additional insight gathered during the detailed analysis of the dense gas dispersion literature. Chapter 2.0 considers specific characteristics of Hydrogen Fluoride gas and proposes simple algorithms _ ~o allow for additional entrainment of air or removal of HF
developed by vapor barriers or water spray curtains. Chapter 3. 0 summarizes the applicable data bases available during this review. Chapter 4.0 provides the results from further evaluation of the data bases identified in Chapter 4.0. In Chapter 5.0 the entrainment models proposed in Chapter 2.0 are compared to the data extracted from previous studies in Chapter 3.0. Subsequently, the calibrated numerical models are used to predict potential mitigation of HF spills by sprays and barriers in Chapter 6.0. Chapter 7.0 summarizes some thoughts about the effective simulation of HF cloud behavior through fluid modeling. Conclusions drawn from the review, analysis, and numerical interpretations are provided in Chapter 8.0.
2.0 DISPERSION OF HYDROGEN FLUORIDE GAS CLOUDS
Hydrogen fluoride is a colorless, corrosive toxic liquid or gas, depending on the temperature. Hydrogen fluoride is used to prepare fluorides, to manufacture fluorine, as a catalyst in isomerization, condensation, dehydration, polymerization, and hydrolysis reactions, and a fluorinating :agent in organic and inorganic reactions. It is also used as an alkylat:Lon catalyst in the petroleum industry, for etching and polishing of glass, and in the manufacture of aluminum fluoride and synthetic cryolite.
Because hydrogen fluoride's boiling point of 292.67°K (19.5°C) is often exceeded by the temperature at which it is transported or used, it is typically shipped in cylinders under its own vapor pressure of 2.1 kPa (0.3 psig) at 20°C. The gas is both toxic and corrosive. The concentration that produces acute effects varies with the time of exposure. The American Industrial Hygiene Association reconimends levels of EPRGl = 5 ~pm, EPRG2 - 20 ppm and EPRG3 - 50 ppm for the Emergency
Response Plann{ng Guidelines. These are exposure levels that the general populace can experience without receiving other than mild transient adverse healt~ effects, irreversible or serious health effects, or
developing life-threatening health effects, respectively. Less severe exposures cause irritation of the nose and eyes, smarting of the skin, some degree of conjunctival and respiratory irritation. The 1979 ACGIH has also established a Threshold Limit Value (TLV) of 3 ppm (2 mg/m3 ) for exposures of p~ople in occupational settings.
2.1 Source Characteristics
Diener (1988) suggested two typical scenarios for hypothetical HF releases. One covers HF Alkylation units and the other covers typical transport and production scenarios. For conservatism, the upper bounds on release rates were deliberately set on the high side. The envelopes indicated are however fairly typical and representative.
HF Alkylation Unit Scenarios Pressure Temperature Flowrate Duration Re lease Type Aerosols 100 - 200 psig 100°F (57°C)
1 - SOO gpm HF or alkylation unit acid 1 - 10 minutes
release in middle of typical refinery setting from line rupture (l" - 3" range), flange leak, pump mechanical seal leak, etc; majority of releases at or near grade but possibility of elevated
releases ·
:total aerosolization expected (i.e. no liquid pool)