LEAN SIX SIGMA STRATEGY: A CASE STUDY FROM SWEDEN
Roy Andersson Jönköping University Sweden roy.andersson@jth.hj.se Peter Manfredsson Ericsson AB Sweden peter.manfredsson@ericsson.com Per Hilletofth Jönköping University Sweden per.hilletofth@jth.hj.sePurpose: The aim is to examine if the joint-use strategy of Lean Six Sigma can improve
flexibility, robustness, cost-efficiency, and agility at the same time.
Design/methodology/approach: A single case study including a Swedish company from the
telecom manufacturing industry was conducted.
Findings: A Lean Six Sigma strategy ensures more flexible, robust, and efficient processes.
However, to make them agile, something more is required. This could include training the staff, strengthening company culture and collaborating with key partners in the supply chain.
Research limitations/implications: This study is limited to large companies that usually
have a lot of resources and choices where to put the strategic emphasis. The situation could be very different in small and medium-sized companies.
Practical implications: This research provides guidance on how to manage the Lean Six
Sigma strategy in order to ensure more flexible, robust, and efficient processes.
Originality/value: This research provides guidance to companies regarding the applicability
and properties of the Lean Six Sigma strategy.
Keywords: Lean, Six Sigma, Telecom manufacturing Paper type: Case study
INTRODUCTION
The joint-use strategy of Lean Six Sigma recently has appeared in the literature (George and Wilson, 2004). Nowadays, these two strategies have been effectively integrated (George et al., 2004). The Lean strategy takes care of waste across all processes and focuses on speed and time, whereas the Six Sigma strategy focuses on design, eliminating defects, driving out process variability as well as reducing costs. The Six Sigma strategy gives extra value to the Lean strategy, since it squeezes out variability in time. Lead-times become more reliable and safety stock levels can be reduced (Christensen et al., 2007). Thus, the Lean Six Sigma strategy offers a solution that creates more flexible, robust, and cost-efficient processes. Nowadays, something more than fast delivery and high quality at a minimal cost is needed to be successful in the market. Firms must have a balanced combination of objectives as well as satisfy dissimilar customer needs that rapidly changes with cost control, much in line with the agile strategy. Agility is a relatively new strategy and represents a more holistic attribute than
flexible. Agile means being able to react fast when something unusual happens, or being successful in unpredictable, uncertain, and changing environments (Schrage, 2004).
The four attributes of flexibility, robustness, agility, and cost-efficiency are often in conflict. Still, if they are in conflict, it is important to decide how flexible, robust, and agile a company should be to be competitive and profitable. The critical issue is variability in the processes. If everything were absolutely constant or even expected, then there would be no problems. On the other hand, if variability can be reduced, the output can be guaranteed through a robust process. However, striving for agility will often induce more variability. The basic approach is then to eliminate or control variability.
This led us to elaborate, whether the Lean Six Sigma strategy could fulfill all these four requirements. The specific research question is: “Can the joint-use strategy of Lean Six Sigma improve flexibility, robustness, cost-efficiency, and agility at the same time?”. This issue has been examined through a single case study including a Swedish company from the telecom manufacturing industry (Ericsson). In particular, a Six Sigma project has been followed and thoroughly analyzed during 2002, mainly through in-depth and semi-structured interviews with key persons representing senior and middle management in the case company. However, the outcome of the Six Sigma project has been studied in longitudinal manner until 2014.
THEORETICAL FOUNDATION
The main components of Lean are stable and standardized methods of working, making all employees involved and committed, keeping a focus on what the customer really wants, delivering the right quality at the right time, at a minimum cost (Pascal, 2002). Lean is fundamentally customer value driven and is a continuous improvement process, in small steps, which makes it appropriate for many manufacturing and distribution situations. Lean includes five phases (McCurry and McIvor, 2001; Bicheno, 2004)
1. Understanding customer value: Only what the customers perceive as value is important. The customers could be the next process, the next company, the customer´s customer or the end customer.
2. Value stream analysis: Having understood the value for the customers, the next step is to analyse the business processes to determine which ones actually add value. The value stream should be mapped and improved regularly. If an action does not add value, it should be modified or eliminated from the process.
3. Flow: Focus on organising a continuous flow through the production. If possible use one-piece flow, rather than moving commodities in large batches and keep it moving. Avoid queues, or at least continuously reduce them and the obstacles in the way. 4. Pull: Pull means short-term response to the customer´s rate of demand, without
over-producing. Level one is that most organisations will have to push the products to a certain point and after that respond to the final customer’s signal, the idea is to push this point further and further upstream. Level two is responding to a pull signal from an internal customer, within the value chain, for this often a Kanban system is used. Pull needs to take the whole demand flow network in consideration, not only within the company.
5. Perfection: The elimination of non-value-adding elements (waste) is a process of continuous improvement. According to McCurry and McIvor (2001), “There is no
end to reducing time, cost, space, mistakes, and effort”. Often a systematic approach is used for continuous improvement.
These five phases are not a sequential, one-off procedure, but rather a journey of continuous improvement (Bicheno, 2004; McCurry and McIvor, 2001).
The main components of Six Sigma are a clear infrastructure, fact-based decisions, effective and efficient methods and tools, systematic follow-up and feedback on results, broad training programmes, and uniform procedures for improvement and design of products, processes and systems. A central aspect is committed leadership on all levels (Henderson and Evans, 2000). There are two types of improvement cycles in Six Sigma: one for existing processes and one for new products (Pyzdek, 2003). The improvement cycle of existing processes (DMAIC) includes five phases (Magnusson et al., 2003):
1. Define: Identify the process or product that needs improving. Find the most capable persons for involvement in the project. Define customers and stakeholders and find out about their needs and expectations. Design a process map, identify the current base line and select SMART goals. Set up a communication strategy. Design a time & resource plan and carry out a risk analysis for the project. Finally construct a project chart.
2. Measure: Identify potential root causes; establish what effect they have on the process and how they are to be measured. Investigate the capability of the measurement system. Identify suitable benchmarking partners.
3. Analyze: Analyze the root causes and the factors that need improving. Find areas that need to be addressed.
4. Improve: Design the most effective and efficient solution. Perform cost/savings and risk analyses of solutions and construct a plan for resource allocation and implementation. Make the process robust.
5. Control: Establish whether the chosen solution proved successful and permanent. Validate the result against the goal statement and investigate whether the solution is robust. Transfer responsibility, share learning and best practice.
In the DMAIC cycle, the focus is on variability, saving money and achieving company objectives (Andersson et al., 2006). It is a modification of the PDCA cycle (Plan, Do, Check, and Act), with complementary addition tools and methods for improvement work. The PDCA cycle originates from Deming and Shewhart, besides being used in Lean.
RESEARCH APPROACH
The case study was conducted at one of the production facilities in the Ericsson Group located in Borås (Sweden). An improvement project was identified together with the senior management of the production facility. A decision was taken to study the assembly and testing processes of the MINI-LINK production line (push system). A Six Sigma project was initiated and carried out according to the DMAIC cycle and the outcome of this project is reported in this research work.
The product MINI-LINK is used for transmitting data into the air (between two pylons). MINI-LINK is available at a frequency range between 6 and 80 GHz, and capacity up to 1 Gbps. The frequency band is divided into a large number of ”sub-bands” (small frequency ranges) and the product is therefore available for the customers in a great variety of variants.
Since customization must be done before delivery, the products cannot be stored. Hence lead-time and delivery precision are vital to meeting customer demands.
Empirical data has been collected during 2002, from on-site interviews with staff members who work in the targeted processes. Data was also collected through observations as well as from internal documents. More than 5,000 observations were made from each process during two months. These observations were considered to be representative for the rest of the year. After the improvement project ended the data collection has contained on an annual basis until 2014. In other words, the authors have followed the improvements and the outcomes at annual basis in over 10 years. The data in the figures below was collected at the production line in Ericsson Borås using local production system as source.
CASE STUDY FINDINGS Define Phase
A problem statement was made, as well as an analysis of profitability. The lead-time was 80 hrs for 98% of the products; the median was 42 hrs, or 66% within 72 hrs and only 47% within 48 hrs. The measurements were based on a production volume of 900 units a week during four shifts.
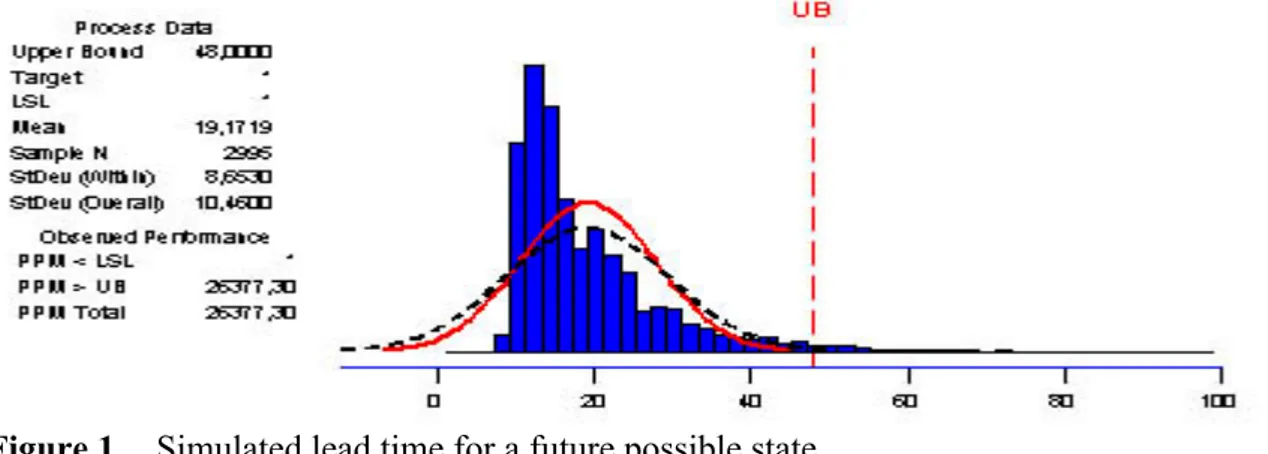
Having set waiting time at a perceived reasonable level, using the SMART (Specific, Measurable, Accepted, Reasonable and Time Set) method of setting targets and then simulating values. Figure 1 shows a simulation of a reasonable value for future lead times. The optimal value of the lead-time is 48 hrs or less for 98% of the products. The simulation was built using both simulated and actual data for the 2995 samples. For each sample, data for each component was established as a sum of all components (Figure 3). For each buffer component an expected value was used together with an exponential distribution to create a simulated value. For each sub-process a distribution was calculated using real-life data from production line as a base and then this distribution was used in Minitab to create a simulated value. Each of these simulated values was summarized and then gives the total simulated lead-time for each sample.
Figure 1. Simulated lead time for a future possible state
The simulations also show that at least five business objectives would be improved at a low cost. If products in process are reduced to a reasonable level, the average lead-time will be 20 hrs for the products. These arguments are strong enough to warrant the project. The improvement aims at fulfilling a customer delivery precision of 99 %.
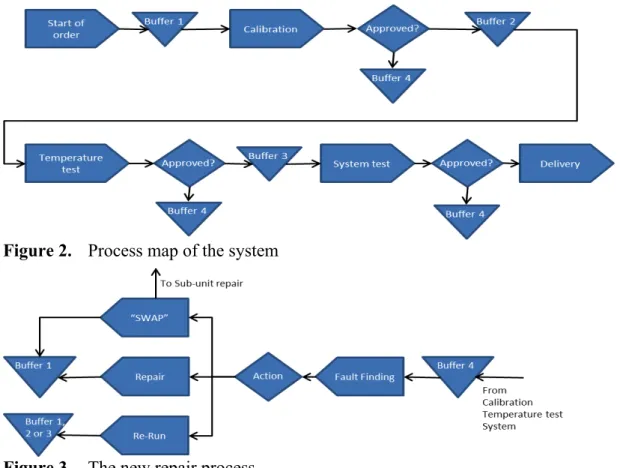
A SWOT (Strengths, Weaknesses, Opportunities, and Threats) analysis was made and stakeholders were identified. VOCs (Voice of Customers) were then identified, their requirements broken down to CTQ (Critical to Quality parameters). Next a project plan was constructed. To achieve a better understanding of the process, a SIPOC (Supplier Input Process Output Customer) was carried out, and a process map designed (Figure 2).
Measure Phase
After brainstorming and discussion with regard to how to identify potential root causes; establish what effect they have on the process, and how they are to be measured, the following were found to be of interest:
• The order in which the products were assembled.
• Waiting time before the assembly and calibration processes, the temperature and system tests.
• The repairs and waiting times for the products arriving from the calibration process, temperature test and system test.
• Variability and inventory levels of the products before the calibration process, temperature test and system test.
• The measurement system analysis of the data indicated that the reliability and validity data were acceptable.
Figure 2. Process map of the system
Figure 3. The new repair process Analyze Phase
The next step was to analyze the factors and find areas that need to be addressed in Measure phase in order to find the root causes. The analysis of the order in which the products were assembled showed only one accurate assembly out of five of the correct MINI-LINK to the same index pair.
An analysis of calibration consistency of index pairs in line was also carried out. When there are faulty components in the system, disorder in the system is created, resulting in decreased same-index reliability. This leads to an increased inventory level before calibration. The disorder is further increased in subsequent processes.
The next step was to look into waiting times within the assembly process, as well as in the calibration process and the system test. Median values for waiting times were increased further into the system. Median waiting time before calibration test was 1.9 hrs, before temperature test 4.9 hrs and before system test 8.5 hrs.
Repair time (Rt), is waiting time before repair of the products after calibration, temperature test and system test (Buffer 4, see Figure 3). The products which did not pass calibration had a median value of 24 hrs, i.e. waiting time before repair, time to repair and time to transport the product into the system. The values for the temperature test and system test were 60 hrs and 1.5 hrs, respectively. The long duration of the temperature test is due to the fact that the MINI-LINK cannot proceed to temperature test before the oven is filled up. Variability was large for getting the MINI-LINK repaired at calibration. Similar variability appeared at temperature and system test repair.
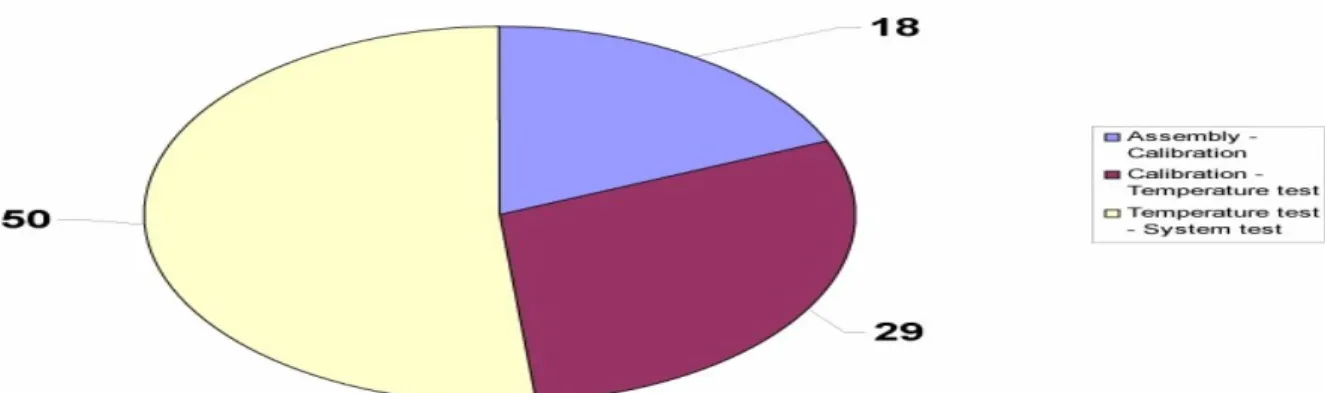
Store levels and variability before calibration, temperature test and system test were set. The median value of MINI-LINK storage was 18 units between assembly and calibration, 29 units between calibration and temperature test and 50 units between temperature test and system test. The rate of variability is increased further into the system (Figure 4).
Figure 4. The median value of store levels between the different processes
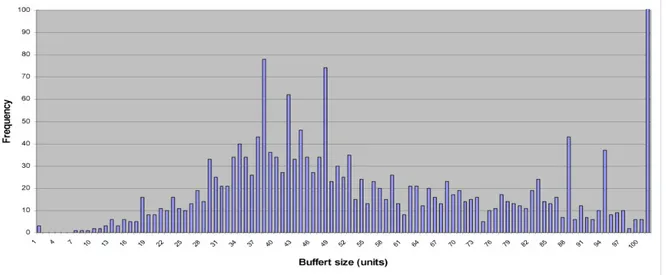
Variability in different store levels between temperature test and system test. The median stock value was 50 units; two distributions can be discerned (Figure 5).
After analyzing the present situation, finding the root causes and trying to predict a future design, the next step was to design the most effective and efficient solution in order to make the process robust and flexible. By using Lean and Six Sigma tools and methods the following changes were to be implemented:
• Modification of the start routine, so that products with the same index would be started in sequence.
• Customer-driven start of the right index, with regard to products in the system. • Identification of an optimal starting time in temperature tests.
• Store level before calibration to be two units per test site. • Special transport wagons to be made for a Kanban system.
• Store level before temperature test to be four positions and two transport wagons. • Store level before system test to be two transport wagons. Priorities to be made in
conjunction with temperature test, ensuring that the right index pair is transported. • At repairs: MINI-LINKS straight from temperature test to be given priority, and to be
back in the system within four hours.
• A staff rotation system to be introduced at test sites in order to improve flexibility. • Calibration staff to receive training in how to install and start units in temperature
tests.
• A new layout of the system to be made.
Figure 5. Variability in different store levels between temperature test and system test
Perform cost/savings and risk analyses of solutions and construct a plan for resource allocation and implementation, the next step was to implement.
Improve Phase
After implementation, the outcome was that the products in the process were reduced by 50 units. Reducing the number of products in process leads to visibility of problems in the system, which also results in further improvement, e.g. putting a stop to picking when the buffer stock exceeds 12 units, and asking for help, when the buffer stock is below 6 units, which make the process more robust and flexible.
Internal transportation distance of the MINI-LINK was decreased and walking time for employees was cut and after base decision on fact by having calculated tact time, some staff could be given other duties. After interviews with the staff, the main conclusions were that the environment had been much improved. There was considerably less stress, the atmosphere was more cheerful, the staff was more proud of and satisfied with their work, and the number of accidents was reduced. Thanks to the removal of the lift machines, the staff was very positive to the new and improved work place. Proximity between employees made for better communication, creating a more pleasant atmosphere and a quicker response to any problems cropping up. Fewer products in work and less staff reduced stress among staff, and also all employees could perform each other’s routines. In case of a new incoming product-family order, or a changed starting order of a MINI-LINK index, the performance of the system did not deteriorate, which the case was before. The result of all these implementation gave a system that was more reliable, robust, flexible and in line with an agile system.
Average lead time (4 weeks moving average) 0,0 10,0 20,0 30,0 40,0 50,0 60,0 70,0 80,0 90,0 v2 7 v2 9 v3 1 v3 3 v3 5 v3 7 v3 9 v4 1 v4 3 v4 5 v4 7 v4 9 v5 1 v0 1 v0 3 v0 5 v0 7 v0 9 v1 1 v1 3 v1 5 v1 7 v1 9 v2 1 v2 3 v2 5 v2 7 v2 9 v3 1 v3 3 v3 5 v3 7 v3 9 v4 1 v4 3 v4 5 v4 7 v4 9 v5 1 v5 3 v0 2 v0 4 v0 6 v0 8 v1 0 v1 2 v1 4 v1 6 v1 8 v2 0 v2 2 v2 4 v2 6 v2 8 v3 0 v3 2 v3 4 v3 6 v3 8 v4 0 v4 2 v4 4 v4 6 v4 8 v5 0 v5 2 Week Hours
Lead time MINI-LINK Goal
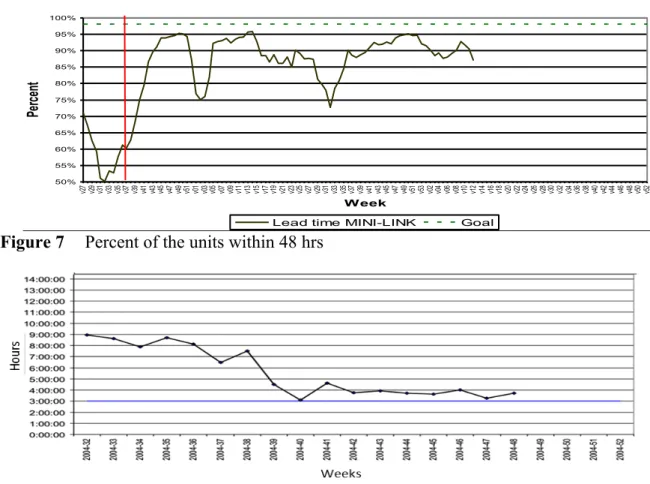
Figure 6. Lead-time after implemented changes Units within 48hours of lead time (4 weeks moving average)
50% 55% 60% 65% 70% 75% 80% 85% 90% 95% 100% v2 7 v29 v31 v33 v35 v37 v39 v41 v43 v45 v47 v49 v51 v01 v03 v05 7v0 v09 v11 v13 v15 v17 v19 v21 3v2 v25 v27 v29 1v3 v33 v35 v37 v39 v41 v43 v45 v47 v49 v51 v53 v02 v04 v06 v08 v10 v12 v14 v16 v18 0v2 v22 v24 v26 v28 v30 v32 v34 6v3 v38 v40 v42 4v4 v46 v48 v50 v52 Week Pe rc en t
Lead time MINI-LINK Goal
Figure 7 Percent of the units within 48 hrs
Figure 8. The time for the repair process
Other quantitative results were that refinement time was considerably reduced and delivery precision was secured and the lead time was decreased from 80 hrs for 98% of the products to 48 hrs or less for 98% of the products. One of the objectives was to reduce lead-time to 48 hrs for 98% of the products. The chart shows that delivery precision was improved, but not to 98%. Continuous improvement might achieve the target (Figures 6-8).
Before the above-mentioned changes were implemented, the repairs process was critical. After changing the routine and the flow, waiting time was decreased, i.e. the products were back in the system much sooner. The chart shows that the values were improved over time, due to the introduction of the last phase of the Lean concept, Perfection, i.e. continuous (step
by step) improvement, visualizing management systems and adopting preventive maintenance routines (Figure 8).
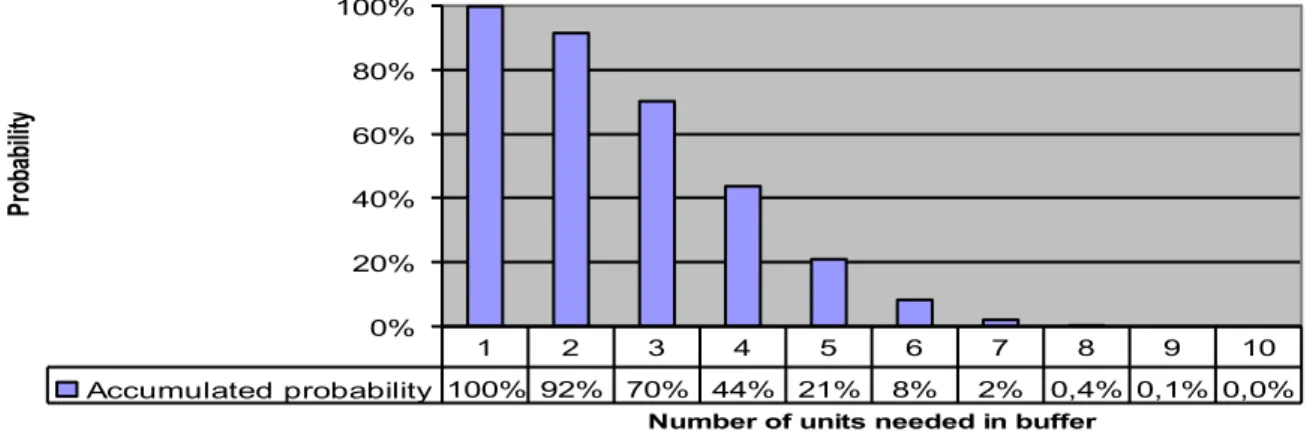
Calibration was a bottleneck. In this process waiting time must be low for the right index pair. The optimal amount of warming sites was calculated using simulation of old data. Data from the three processes were explained as normal distribution for the assembly process, exponential distribution for the warming site and Weibull distribution for the calibration process. Using simulation, the optimal amount of units at warming sites was fixed at a minimum of eight, with a risk of less than 1% of there being a unit ready for calibration (Figure 9). Simulated buffer size
0% 20% 40% 60% 80% 100%
Number of units needed in buffer
Pr ob ab ili ty Accumulated probability 100% 92% 70% 44% 21% 8% 2% 0,4% 0,1% 0,0% 1 2 3 4 5 6 7 8 9 10
Figure 9. Number of units in the calibration process
Total savings per annum exceeded 1 million euros after implementing all and finishing the improve phase.
Control Phase
Team building was introduced to promote shared values. Training sessions were to be held twice a year, and stand-up meetings introduced between each shift to further strengthen shared values and team spirit. To improve results over time, the following criteria of the Lean philosophy were introduced: continuous (step by step) improvement (PDCA cycle was introduces), Total Preventive Maintenance (TPM), application of Visual Management System (VMS) three times a day, removal of additional waste, and visualization routines.
CONCLUDING REMARKS
This research aimed to examine if the Lean Six Sigma strategy can improve flexibility, robustness, cost-efficiency, and agility at the same time. The conducted improvement project made the studied processes more flexible, robust and cost-efficient, moving closer towards agile. In addition, the processes became more reliable because of preventive maintenance, continuous improvement, and self-governing teams. A simulated trial showed that a new product family could be introduced into the production line without an increase in the total lead-time. The insertion of an extra shift, due to increased production volumes, also is not a problem since the workers are familiar with each other’s routines.
The same results would have been very difficult to achieve if only the Lean or Six Sigma strategy had been used. One reason for this is that the Lean strategy focuses on value stream mapping, where process variability usually does not emerge. Possibly, the same excellent results could be reached without using the Six Sigma strategy since the last phase in the lean strategy is about long term perfection, however, this would take a very long time. Another
reason why it would have been difficult to achieve the same results is that the Six Sigma strategy includes a better framework for project management, providing project members with comprehensive training and a clear project management structure, as well as middle management involvement and a result orientation from senior management.
The result shows that the Six Sigma strategy is suitable for making processes more flexible, robust, and cost-efficient. However, when the Six Sigma project is finished, the last phase of the Lean strategy (perfection) is appropriate to make the process flexible, robust, and efficient over time. This phase includes waste removal, preventive maintenance, visual management system, continuous improvement, and self-governing teams. Therefore, the Lean Six Sigma strategy ensures more flexible, robust, and cost-efficient processes over time. However, to make the processes agile to sustain in changing environment, requires something more. This could include training the staff, strengthening the company culture, and collaborating with the key partners in the supply chain.
REFERENCES
1. Andersson, R., Eriksson, H., and Torstensson, H. (2006) Similarities and differences between TQM, Six Sigma and Lean, The TQM Magazine, 18(3), 282-296.
2. Bicheno, J. (2004) The new lean toolbox, towards fast, flexible flow. Buckingham: PICSIE Books.
3. Christensen W., Germain R., and Birou L. (2007) Variance vs. average: supply chain lead-time as a predictor of financial performance, Supply Chain Management: An International Journal, 12(5), 349–357.
4. George, M.L., and Wilson, S.A. (2004) Conquering Complexity in Your Business. New York: McGraw-Hill.
5. George, M.L., Rowlands, D., and Kastle, B. (2004) What is Lean Six Sigma? New York: McGraw-Hill.
6. Henderson, K., and Evans, J. (2000) Successful Implementation of Six Sigma. Benchmarking General Electric Company, Benchmarking: An International Journal, 7(4), 260-281.
7. McCurry L., and McIvor, R.T. (2001) Agile Manufacturing, 21st Century Strategy for Manufacturing on the Periphery? Irish Academy of Management Conference, University of Ulster.
8. Magnusson, K., Kroslid, D., and Bergman, B. (2003) Six Sigma - The Pragmatic Approach. Lund: Studentlitteratur.
9. Pascal, D. (2002) Lean Production Simplified. New York: Productivity Press.
10. Paton, D., Smith, L., and Violanti, J. (2000) Disaster response: risk, vulnerability and resilience, Disaster, Prevention and Management, 9(3), 173-179.
11. Pyzdek, T. (2003) The Six Sigma Handbook. New York: McGraw-Hill.
12. Schrage, M. (2004) The Struggle to Define Agility, CIO Magazine, August 15.
13. Sheffi, Y. (2007) The resilient enterprise: overcoming vulnerability for competitive advantage. Cambridge: MIT.