i
Faculty of Engineering, LTH
Customer Adoption of Data-Driven Services:
A Model for Customer Prioritization
Olle Gemfors & Emil Persson
Supervisors Ola Alexanderson, Faculty of Engineering, Lund University
Fredrik Sagerstedt, Director Business Development & Quality, Tetra Pak Processing Systems AB
ii
I.
ACKNOWLEDGEMENTS
This study has been carried out as a master thesis during the spring of 2018 at the Faculty of Engineering at Lund University (LTH). The thesis crowns and finishes our education in Industrial Engineering and Management at the university. It has been written in collaboration with Tetra Pak Processing Systems AB (hereafter referred to as TPPS).
This project has helped us apply what we have learned at the university in practice, and given us valuable insights and experience from the industry. It has also given us a chance to further increase our knowledge of the manufacturing industry and the food industry, as well as the area of after-sales service.
First of all we would like to express our gratitude towards TPPS for letting us write our thesis in collaboration with them and especially Fredrik Sagerstedt for all the support throughout the study. A huge thanks as well to the sales managers at TPPS that devoted time to helping us in the process. We would also like to thank Ola Alexanderson at the university for all the support and guidance in the role of our supervisor for the thesis.
Lund, June 2018
iii
II. ABSTRACT
Title
Customer Adoption of Data-Driven Services: A Model for Customer Prioritization
Authors
Olle Gemfors Emil Persson
Supervisors
Ola Alexanderson, Faculty of Engineering (LTH), Lund University
Fredrik Sagerstedt, Director Business Development & Quality, Tetra Pak Processing Systems AB
Background
In the latest years, developments in technology has created new opportunities within the area of after-sales services. Examples of such developments are the Internet of Things and Big Data, which can be used e.g. for predictive maintenance. Combined, the developments imply that there is potential gain for an OEM in using the IoT, Big Data and a transformed business model in their after-sales service offering. For OEMs operating within less mature industries it becomes of interest to explore these possibilities within their existing customer relationships. There are many aspects that need to be decided upon in this exploration, but one important aspect is which customers to begin with when developing and deploying the offering.
Purpose
The purpose of this thesis is to suggest a model that can be used by OEMs to find out which of their customers would most likely adopt data-driven service offerings.
Methodology
In order to fulfill the purpose of the thesis, a literature review was conducted to find out what affects a customer’s interest in a data-driven service offering. The results from the review were then used to suggest a model that could be used by OEMs for customer prioritization. The model was finally applied in a case study.
Conclusions
The customers’ interest in a data-driven service offering can be divided into two parts, which in this thesis are called Potential and Receptiveness. The former is based on the benefits the customer can get from implementing a data-driven service offering and the latter is based on factors affecting whether the customer is ready to adopt a data-driven service offering or not. These can be scored with the help of sub-areas and the scores can be used as a discussion basis for a prioritization of customers.
iv
Keywords
After-sales service, Big Data, customer prioritization, data-driven services, Internet of Things, Original Equipment Manufacturer, Product-Service System, servitization
v
III. LIST OF DEFINITIONS
Big Data
Large amounts of data, e.g. collected via sensors, that can be analyzed in order to draw conclusions and among other things create predictive algorithms.
Data-driven services
Services offered by an OEM to its customers, made possible by gathering and analyzing data from the customer’s equipment.
Original Equipment Manufacturer (OEM)
A company that produces equipment and parts used in manufacturing processes. Performance-based contract
A type of contracting where the payment from the customer to the provider of the service is based on agreed upon performance levels.
Product-Service System (PSS)
Integrated solutions to enhance the product offering with services in order to increase the total value proposition.
Servitization
A trend in which manufacturing firms adopt more and more service components in their offerings.
The Internet of Things (IoT)
A new paradigm where things and objects can communicate and interact with each other using e.g. sensors and tags.
vi
TABLE OF CONTENTS
1. INTRODUCTION ... 1 1.1 Background ... 1 1.2 Problem Description ... 3 1.3 Purpose ... 3 1.4 Research Questions ... 3 1.5 Delimitations ... 31.6 Disposition of the Thesis ... 5
2. METHODOLOGY ... 6
2.1 Summary of work process ... 6
2.2 Model design ... 7
2.2.1 Scoping, delimitations & methodology ... 7
2.2.2 Literature review ... 7 2.2.3 Hypothetical modeling ... 8 2.3 Model implementation ... 8 2.3.1 Operationalization ... 8 2.3.2 Application ... 9 2.4 Model validation ... 9 2.4.1 Analysis ... 9 2.4.2 Discussion ... 10
3. THEORY - LITERATURE REVIEW ... 11
3.1 Benefits from data-driven services ... 11
3.1.1 Cost savings ... 11
3.1.2 Predictive maintenance ... 12
3.1.3 Increased revenue ... 12
3.1.4 Environmental benefits ... 12
3.1.5 Improved risk management ... 12
3.2 Factors affecting adoption of data-driven services ... 13
3.2.1 Relationship ... 13
3.2.2 Value understanding ... 14
vii 3.2.4 Culture ... 15 3.2.5 Industry environment ... 16 3.3 Prioritization ... 16 3.4 Cases ... 17 3.4.1 Xerox ... 17 3.4.2 Rolls-Royce ... 18 3.4.3 Alstom Group ... 18
3.4.4 Thales Training & Simulation ... 19
3.4.5 Krones ... 19
4 THEORY - HYPOTHETICAL MODEL ... 20
4.1 Summary of model ... 20
4.2 Construction of model ... 21
4.3 Potential ... 22
4.3.1 Potential of installed base ... 23
4.3.2 Above average maintenance costs ... 23
4.3.3 Cost of standstill ... 24 4.3.4 Equipment uptime ... 24 4.3.5 Environmental benefits ... 24 4.3.6 Amount of accidents ... 25 4.4 Receptiveness ... 25 4.4.1 Relationship ... 26 4.4.2 Maturity level ... 26 4.4.3 Risk aversion ... 26 4.4.4 Innovative culture ... 27 4.4.5 Competitive situation ... 27 4.5 Intended use ... 27 5. CASE STUDY ... 29
5.1 The case company ... 29
5.1.1 Tetra Pak Processing Systems AB ... 29
5.1.2 Choice of company ... 30
viii
5.2.1 Choice of customers to score and people to set scores ... 31
5.2.2 Changes and adaptations in scoring areas ... 32
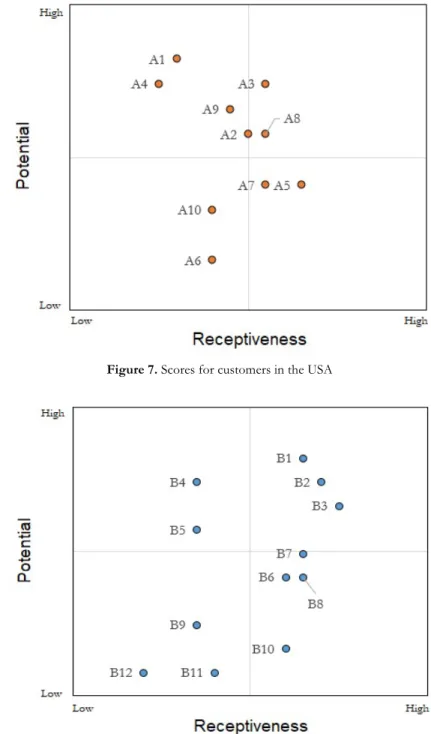
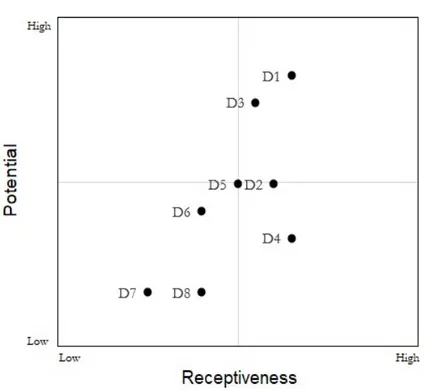
5.2.3 Scoring instructions ... 34 5.3 Application ... 37 5.3.1 Process ... 37 5.3.2 Results ... 37 6. ANALYSIS ... 41 6.1 Analysis structure ... 41
6.2 The output as a basis for prioritization ... 42
6.3 Design validity ... 46
6.4 Output reliability ... 47
7. DISCUSSION ... 48
7.1 Analysis discussion ... 48
7.2 Further usability of applied model within TPPS ... 49
7.3 Usability of general model ... 51
7.3.1 Choice of customers to score ... 51
7.3.2 Choice of people to set scores ... 51
7.3.3 Choice of scoring areas to incorporate ... 52
7.3.4 Choice of scoring method ... 52
7.3.5 Choice of scoring basis ... 52
7.3.6 Choice of scale for scoring ... 53
7.3.7 Considerations to mitigate the risk of low output reliability ... 53
7.4 Relevance ... 54
7.4.1 General model ... 54
7.4.2 Scoring areas of the Potential axis ... 55
7.4.3 Scoring areas of the Receptiveness axis ... 56
7.4.4 Further considerations ... 56
7.5 Credibility ... 57
7.5.1 Reliability ... 57
7.5.2 Validity ... 58
ix
8. CONCLUSIONS ... 60
8.1 Findings ... 60
8.2 Purpose fulfillment ... 61
8.3 Academic contribution ... 62
8.4 Directions for future research ... 62
REFERENCES ... 64
APPENDICES ... 69
A. Scoring instructions ... 69
1
1.
INTRODUCTION
This first chapter starts with a background for and description of the problem the thesis will address, followed by the thesis’s purpose, research questions, and delimitations. Finally, an overview of the disposition of the thesis is presented.
1.1 Background
Many companies have by now come to see and understand the value of after-sales service. The numbers on after-sales vary, but even though it on average only generates 24 % of a company’s total revenue, it stands for 45 % of the profits (Viardot 2007). General Motors have even indicated that they generated more profit from their $9bn revenue in after-sales than they did from their $150bn revenue from car sales. For some B2B businesses, after-sales service can even represent up to 80 % of total revenues (Viardot 2007). This stresses the importance of having a strategy for the after-sales service offering. Despite this, examples can be found where companies have not realized that their service contracts do not cover the costs of carrying them out, or that they’ve been giving huge unwanted discounts (Bundschuh & Dezvane 2003). To summarize, there are large potential gains in a well managed after-sales service offering, and equally large potential losses in a badly managed one. In the last few years developments in technology have created new opportunities for companies and their service offerings. One of the mentionable developments that has received a lot of attention is the emergence of what is called the Internet of Things (IoT). There are many definitions of the IoT, but de Senzi Zancul et al. (2016) define it as a new paradigm where things and objects can
communicate and interact with each other using e.g. sensors and tags. An example of a great benefit with the IoT is that it can help generate and collect data from the sensors. Such collection of huge amounts of data is usually referred to as Big Data, which can be analyzed in order to draw
conclusions and e.g. create predictive algorithms (de Senzi Zancul et al. 2016). These opportunities and technology can be used by original equipment manufacturers (OEMs) to create predictive models of the equipment’s performance, which can be used to optimize the maintenance of them (Canizo et al. 2017).
In recent years, a new business model for OEMs has emerged. This business model transforms the business from supplying products to supplying a service instead. As an example, Rolls-Royce has transitioned from selling aeroplane engines to selling “power by the hour”, meaning that the customers pay a fixed amount for each hour that the engines are used. In this offering, Rolls-Royce takes all the costs for the maintenance and support of the engines.
Combined, these developments imply that there is potential gain for an OEM in using the IoT, Big Data and a transformed business model in their after-sales service offering. By using these solutions to gather and analyze data predictive maintenance algorithms could be created, which can provide the customer with e.g. higher uptime and cost savings, for which the OEM can charge a premium, thus creating value for both parties.
2
In literature, there is not one agreed upon concept that unambiguously and fully describes these opportunities. There are however a handful closely related concepts that together cover the opportunities to a large extent. These have been used throughout this thesis to find literature that could be studied in order to answer the research questions. Therefore, the reader should be
acquainted with them, which is why they are presented below. The offerings that could be developed from these opportunities will in this thesis hereafter be referred to as data-driven service offerings.
Product-Service System (PSS)
PSS is a concept that initially was defined by Goedkeep et al. (1999, p.18) as “a marketable set of products and services capable of jointly fulfilling a user’s need”. Since then several other definitions have been provided, e.g. by Colen and Lambrecht (cited in Alotaibi 2016, p. 26), who define PSS as: “integrated solutions to enhance the product offering with services to increase the total value proposition”. In other words, the concept is a description of how an OEM bundles their product and their service. In later years, Baines et al. (2007) have introduced three different types of PSS mentioned in literature:
● Product-oriented PSS: Traditional selling of the equipment along with additional services such as maintenance, repair and training.
● Use-oriented PSS: The ownership of the equipment remains with the OEM and the customer pays for the amount of usage.
● Result-oriented PSS: The ownership of the equipment remains with the OEM and the customer pays for the performance level of the equipment.
The result-oriented type represents the most popular interpretation of PSS (Baines et al. 2007). Hereafter, the use of PSS will refer to this interpretation of the concept.
Servitization
Another important concept in understanding the business context of OEMs and their customers is servitization. It is defined as “a trend in which manufacturing firms adopt more and more service components in their offerings" (van Looy, cited in Huxtable & Schaefer 2016, p.47). Specifically for OEMs this means that they shift from supplying equipment to instead delivering the capability of the equipment and using their knowledge about the equipment to continuously improve this capability. Servitization often involves elements such as pay-for-use, long-term contracts, risk management and commitments to process improvements from the OEM (Baines & Shi 2015). Baines et al. (2007) argue that PSS is a special case in servitization, whereas the terms are used synonymously in other literature (Meier & Roy 2010). This stresses the close relationship between the two concepts.
Industry 4.0
Industry 4.0, or the fourth industrial revolution, is an expression that has been heard more and more in the last few years. It stems from a strategic initiative by the German government launched in January 2011 (Bartodziej 2017). The idea behind the concept was that there had been so many
3
technical innovations in the recent years that these when used in conjunction would be able to spark a fourth industrial revolution. What characterizes this revolution is information and automation enabled by the Internet of Things. (Bartodziej 2017)
1.2 Problem Description
As can be seen in the background there are examples of industries where firms have been successful in using data-driven service offerings and have created an increased value for themselves and their customers. There are however also examples of industries where this development has not yet started. For OEMs operating within less mature industries in this regard it becomes of interest to explore these possibilities within their existing customer relationships. There are many aspects that need to be decided upon in this exploration, but one important aspect is which customers to begin with when developing and deploying the offering. The customers of an OEM can differ dramatically from each other, implying that some customers might be more eager than others to adopt data-driven service offerings. Therefore, it becomes relevant to prioritize between customers and identify which customers would most likely be interested in and benefit from exploring the new possibilities. Doing so requires an understanding of what factors could affect whether or not a customer adopts data-driven service offerings. The existing literature on this subject is generally more focused on examining the process of creating and selling data-driven service offerings from the OEM’s perspective, describing benefits, challenges and key considerations for OEMs choosing this path, than it is on the customer’s perspective.
1.3 Purpose
The purpose of this thesis is to suggest a model that can be used by OEMs to find out which of their customers would be most likely to adopt data-driven service offerings.
1.4 Research Questions
Given the problem description and the purpose of the thesis the following research questions were decided upon:
1. What are the potential benefits with data-driven service offerings from the perspective of the customer?
2. What other factors could affect whether or not a customer adopts data-driven service offerings?
3. How can the answers to 1 and 2 be used by OEMs to prioritize between customers when developing and deploying data-driven service offerings?
1.5 Delimitations
After-sales service
Realizing that IoT and Big Data open up for possibilities related to many areas of a firm's activities, this thesis is limited to the domain of after-sales service.
4
B2B relationships
This thesis is limited to the relationship between an OEM and their customers, a strict B2B relationship. Therefore, B2C relationships will not be investigated.
Data gathering and analytics
What exact data is to be gathered from the equipment and what analyses should be made in order to create a viable data-driven service offering will not be discussed, since this is a question that more or less could be made into a thesis in itself.
Technology
This thesis will not investigate or discuss the technical aspects of data-driven services. Problems and challenges with e.g. connectability, compatibility, reliability, infrastructure and security of the
technology will not be discussed. Generally, the required technology is assumed to exist and will hence not be regarded as a barrier affecting the customers’ interest in exploring data-driven services.
Contracting
Contracting is something that most likely will be changed with the introduction of new service offerings. That area needs to be examined closely in order to bring any viable results, but possible contracts can only be developed after the offering and after a relationship has been established with the customer. Therefore, it has been excluded from this thesis.
System perspective
Some of the possibilities with data-driven service offerings arise from looking at manufacturing plants as a whole, with a system perspective (Bartodziej 2017). Since this thesis is limited to OEMs, which might not provide all the equipment in a factory, it will also be limited to looking at the equipment themselves and not the factory as a system.
Customer owns the equipment
One of the possibilities with the new technological solutions, which has also been pursued in many industries, is that of the customer renting the equipment as a service instead of buying and owning it. This development has been used as input and inspiration, but the model that has been created in this thesis has been developed assuming that this is not yet a viable option in the situation where the model is to be applied.
Internal use
The tool is supposed to be used internally within the OEM’s organization with data that is already available. This means that the OEM’s customers are not to be involved when using the tool.
5
1.6 Disposition of the Thesis
The thesis starts with an introductory chapter that explains the background of the subject and a few relevant concepts, and contains a problem description, the purpose of the thesis, research questions, delimitations and the disposition of the thesis.
The next chapter describes the methodology used in the project. Here the work process and the method used are described in detail, along with motives of why these were chosen. The work process is first described as a whole and then in more detail for each phase of the process. The third chapter describes the theory used in the thesis. This chapter has been divided as to first describe the benefits that can be realized for the customer with a data-driven service offering, then present the factors believed to influence a customer’s willingness to adopt such an offering. Some theory on how a prioritization between customers is also presented. Finally, some example cases of companies that have implemented a data-driven service offering are given.
The fourth chapter describes the first hypothesis of what a customer prioritization model could look like. The chapter starts with a summary of the model, then describes how it was constructed and the parts of the model in more detail. Finally, how the model is intended to be used is briefly presented. The fifth chapter describes the application of the model in the case study that was conducted in the thesis. This chapter starts with a description of the case company and organization, along with a discussion of why this company was chosen. Then follows a description of the operationalization of the hypothetical model into a tool that was made in order for it to be applicable at the case company, including who were involved in the scoring, what changes were made to the hypothetical model, and what scoring instructions were used. Finally, the application process and its results are presented. The sixth chapter is an analysis of the results from chapter 5. The chapter starts with a description of the analysis structure, where three questions that are to be answered are posed. These are then answered.
The seventh chapter starts with a discussion of the analysis method and results. Then follows discussions of the usability of the applied model and then the general model. Next, the relevance of the areas in the model are discussed. The chapter is concluded with a discussion of the credibility of the thesis and its results.
Finally, the results from the thesis are summarized in conclusions in the last chapter. This chapter also includes a passage on whether or not the purpose of the thesis was fulfilled, a description of the academic contribution of the thesis, as well as directions for future research.
6
2.
METHODOLOGY
This chapter explains the methodology of addressing the problem described in chapter 1. The chapter contains a detailed description of the work process, including considerations made along the way and the motives for the decisions made.
2.1 Summary of work process
The purpose of this thesis is to suggest a model for customer prioritization. Höst et al. (2006)
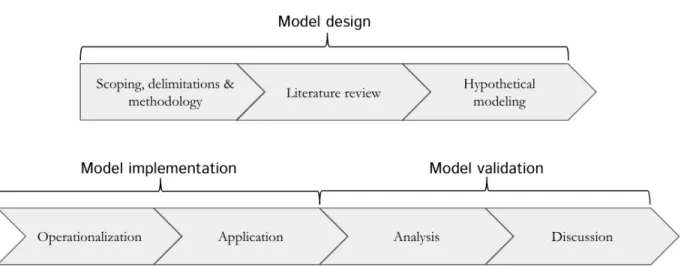
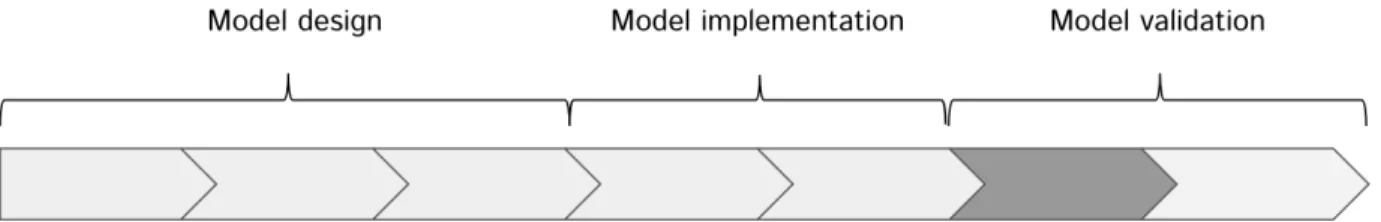
suggest three general steps to follow in the process of creating a theoretical model, each with its own considerations that have to be made. The three steps are model design, model implementation and model validation. Model design includes decisions about delimitations for the model, what data to input to the model and what data the model should output. The abstraction level also has to be decided in order to avoid the model becoming too detailed or too abstract. Model implementation can consist of various things depending on the aim of the model. In this thesis the implementation step
consisted of a case study where the model was applied. Model validation is supposed to conclude if the model generates reasonable results and that it describes the phenomena it models.
It is important to make sure that the credibility of the work meets a high standard. Höst et al. (2006) identify three areas of credibility that can be discussed. These are reliability (in the data collection with regards to natural variance), validity (if the correct systematic symptoms have been studied), and representativeness (that the conclusions are generalizable). These areas are important to remember throughout the whole work process, and have been used as guidance when making decisions. The work process of this thesis has been designed based on the three steps suggested by Höst et al. (2006) and with the areas of credibility in mind. The following subchapters will in detail describe the work process of the thesis along with methodological considerations made in connection to the three steps. The full work process is visualized in Figure 1.
7
2.2 Model design
This section describes the work process and methodological choices made in connection with the model design. The model design was performed in three phases. First, the scope of the thesis along with delimitations and methodology was decided upon. Thereafter a literature review was conducted and finally a first draft of the model was created.
2.2.1 Scoping, delimitations & methodology
To explore the subject in general and get enough knowledge to establish a reasonable scope, an initial unstructured screening of existing literature was performed. This screening resulted in both motivating references confirming the relevance of the problem as well as relating references mapping out how this thesis would build on previous research. Research questions and delimitations were then formulated in dialogue with the supervisors from both LTH and the case company. The
delimitations naturally followed from the case company’s particular situation, but it was noted during the initial screening of literature that similar situations also exist in other firms, which further
motivates the delimitations made. The input and output of the model were also decided upon in this phase. Given the purpose of the thesis, the methodology and work process elaborated on in this chapter were decided upon.
2.2.2 Literature review
The aim of the literature review in general was to increase the knowledge about what research has been performed and make sure that the model builds on previous research. More specifically it was aimed at providing a basis for answering the research questions by finding mentionings of the following things in academic literature:
● benefits that lead customers in the direction of purchasing data-driven services ex-ante as well as realized customer benefits from purchasing data-driven services
● factors affecting whether or not a customer customer adopts data-driven services, both enabling and inhibiting
● how one can prioritize between customers in general, or how models for such prioritizations can be created
A systematic approach to the literature review1 was not used since it was considered too time
consuming in relation to its contribution. Instead, an iterative search process was used where search words and phrases were narrowed down to find publications with a high degree of overlap with this thesis in terms of background, problem description, purpose and research questions. The literature review was conducted primarily by using Lund University’s database for books, publications, articles and journals (LUBSearch). Regarding reliability, Höst et al. (2006) acknowledge the importance of being thorough and meticulous when collecting the data. In order to increase the reliability of the
1 Here, a systematic approach refers to an extensive literature review including elements such as setting up detailed
8
thesis, all benefits and factors were sought in more than one source to ensure it was not isolated to a certain setting. It was considered more important to generate a large set of possible benefits and factors for customer adoption rather than making certain that everything would be directly
applicable to the model. Therefore, at a later stage of the literature review publications with a more distant relationship to this thesis were examined.
2.2.3 Hypothetical modeling
In this phase benefits and factors for customer adoption found in the literature review were used to create a hypothetical model. Since the model is not meant to be specific to a certain industry it was acknowledged that not all the benefits and factors affecting customer adoption retrieved from the literature study would apply to all possible situations. Therefore, in order to increase the level of abstraction, a decision to group the benefits and factors for customer adoption into larger areas was made. Finally, in order to be able to visualize the output from the model, the larger areas were grouped into two axes in a matrix.
2.3 Model implementation
The implementation of a theoretical model can be done in various ways depending on the study. As described by Denscombe (2009), one of the instances when a case study is suitable is when a theory, such as a model, is to be tested to see how it can be used in a real setting. Furthermore, Höst et al. (2006) argue that the use of a case study is suitable when doing a study that aims to describe a phenomenon or an object in depth, especially when the phenomenon is difficult to isolate from its surroundings. Research question 3, how to prioritize between customers when developing and deploying data-driven service offerings, is very dependent on the company and its surroundings. For these reasons, the implementation of the model was made through a case study. When it comes to representativeness of a case study it is usually difficult to generalize the results since the situation studied is just one isolated occurrence of the phenomenon and might not at all look like other occurrences. However, the closer the case study resembles the context that is to be generalized, the more representative are the results (Höst et al. 2006). Therefore, in order to improve
representativeness it is important to choose the case company with care so that it displays the key characteristics of the general phenomena. The choice of case company will be further elaborated upon in chapter 5.1.2.
The model implementation was performed in two phases. First, the hypothetical model from the model design was operationalized and adapted into a usable tool so that it could be used within the case company. Second, the tool was applied on a number of the case company’s customers.
2.3.1 Operationalization
In order for the model to be applied on the case company the abstraction level had to be lowered, and it had to be adapted to the case company’s situation. This was primarily achieved by creating scoring criterias for each area that was to be scored. Whenever possible these criterias where based
9
on available quantitative data in order to reduce the risk of the results being too dependent on the person scoring the customers. Decisions were also made about excluding areas and merging areas. The whole operationalization procedure was iterative. The model was at different occasions presented for two sales managers at the case company, the supervisor at the case company and the supervisor at LTH. Between each of these presentations the model was revisited and revised based on the feedback received.
2.3.2 Application
According to Höst et al. (2006) a better picture of the studied phenomenon as well as an increased validity can be obtained by using triangulation, i.e. to use several methods for gathering and analysis of data. The validity of the results will be elaborated on in chapter 7.5.2. In this thesis the data from the model application was collected both in the form of quantitative scores on the customers that the model was used on, and qualitative data in the form of feedback from the sales managers that used the model. To collect the quantitative data a scorecard was built in Excel where customers could be imported from the CRM system, scored in each of the areas in the model and then visualized in a matrix based on the scores. A number of sales managers responsible for different geographical customer segments were then asked to score their customers in this Excel file
according to the scoring criterias that had been established in the model operationalization. In order to collect the qualitative data they were also asked to provide feedback on how easy it was for them to understand the model, whether or not it was easy or difficult for them to score the customers based on the criteria and how well the model output matched their intuitive feeling for which customers should be prioritized.
2.4 Model validation
Finally, the model was validated. In the validation phase the model is to be tied back to the initial phenomenon and an analysis of whether or not the model gives a correct and reliable description of the phenomenon is done (Höst et al. 2006). The validation in this thesis was performed in two phases. First the data from the model application was analyzed. Then, based on this analysis, the validity, reliability and usability of the model was discussed.
2.4.1 Analysis
In this thesis, whether or not the model gives a correct description of the phenomenon, i.e. a correct customer prioritization, was difficult to analyze. This is because there was no other known
information about the case company’s customers’ interest in data-driven services that the model output could be compared to. Given research question 3 it was however not deemed necessary to analyze this, since the model is just supposed to be a suggested way of prioritizing between
customers. Still, in order for the hypothetical model to be useful, it is important to ensure that it is possible to make a customer prioritization based on the model output, that the design of the model is valid and that the output from the model is reliable. Therefore the analysis was aimed at answering the following questions:
10
a. Can the model be used as a basis for customer prioritization? b. How valid is the design of the model?
c. How reliable is the model output?
To answer these questions data from the model output was analyzed. The methods for these analyses will be elaborated upon in chapter 6.1.
2.4.2 Discussion
Based on the analysis the validity, reliability and usability of the model were discussed and
suggestions were given for how to improve these. When possible these suggestions were generalized to be applicable to situations outside of the case study that was performed in the model
implementation. According to Höst et al. (2006), the degree to which the results from the case study are generalizable depends on how closely the case study resembles other contexts where the model could be applied. This will be further elaborated on in chapter 7.5.3.
11
3.
THEORY - LITERATURE REVIEW
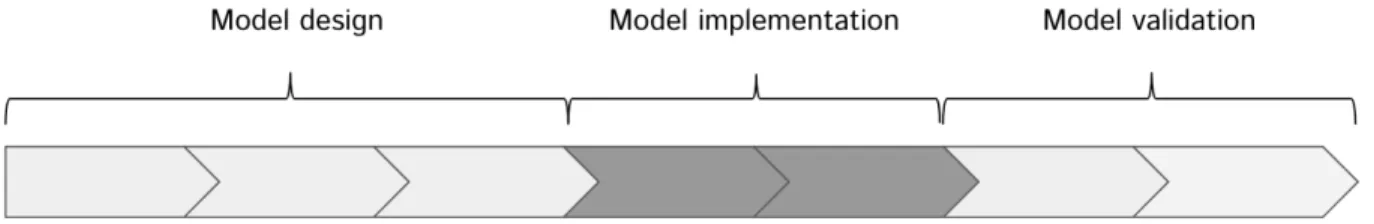
This chapter describes the theoretical framework used in the thesis and constitutes the literature review of the model design phase, visualized in Figure 2. The chapter starts with summarizing customer benefits from data-driven services as well as other factors that could affect whether or not a customer adopts data-driven services. Next, the theoretical basis for the customer prioritization is described. Finally, a few of examples of firms that have developed and deployed data-driven services and what they have been able to realize for their customers as a result are given.
Figure 2. Position of chapter 3 in the work process
3.1 Benefits from data-driven services
This subchapter provides a basis for answering research question 1 by summarizing benefits from data-driven services that have previously been mentioned in literature in connection with PSS, servitization and Industry 4.0. These benefits will later be used in the construction of the
hypothetical model presented in chapter 4. Both benefits that ex-ante lead customers in the direction of purchasing data-driven services, as well as realized customer benefits from purchasing data-driven services are summarized here. The headings in this subchapter are meant to facilitate the reading of and are not directly related to the hypothetical model in chapter 4.
3.1.1 Cost savings
Bartodziej (2017) states that there is a substantial potential for the manufacturing industry from Industry 4.0. In a report by PriceWaterhouseCoopers the authors state that the importance of developing industrial internet solutions is high for all companies, regardless of their size, in order to not fall behind the competition (Geissbauer et al. 2014). Estimates are still hard to make on the exact economic potential of Industry 4.0, but according to a study by the German Federal Association for Information Technology, Telecommunications and New Media (BITKOM e.V.), the gross value added in the mechanical and plant engineering sector in 2025 will be about 30 % higher than in 2013 (Bauer et al., cited in Bartodziej 2017). Kauermann et al. (cited in Bartodziej 2017) identify eight changes that are likely to be introduced with the rise of Industry 4.0:
● customer customization ● flexibility
● optimization of decision-taking
● increased productivity and efficiency of resources ● emergence of value opportunities through new services
12 ● demographic changes in the workplace ● increased importance of Work-Life-Balance
● the development towards a high-wage economy that is still competitive
These changes are positively correlated to cost savings, and will potentially have huge impacts on labor costs, energy costs, and capital costs (Bartodziej 2017).
3.1.2 Predictive maintenance
Industry 4.0 will also bring on the possibility of predictive maintenance, which aims at reducing the downtime of equipment by predicting and planning for maintenance before breakdowns occur. Equipment breakdowns are costly for the company. For example, when new maintenance practices were introduced at a global steel manufacturer, they managed to reduce their equipment downtime with 13 %, saving them $5M per year (McCarthy et al. 2013). The introduction of sensors and the analysis of Big Data in Industry 4.0 will improve the possibilities of predictive maintenance (Huxtable & Schafer 2016, de Senzi Zancul et al. 2016), thus indicating huge cost savings and efficiency gains for the customers of an OEM.
3.1.3 Increased revenue
The new technologies also bring potential for increased revenue for the customer. The
transportation company Alstom managed to increase the number of passengers drastically largely thanks to the adoption of data-driven services (Baines & Shi 2015). The increased uptime resulting from less downtime with predictive maintenance also gives overall more effective operations, higher output and therefore potentially increased sales (Markeset & Kumar 2005). In a survey of 33
companies in the UK by Baines & Shi (2015) they clearly showed revenue growth potential, with examples of 5-10 % growth potential per year.
3.1.4 Environmental benefits
PSS is often mentioned as a way of aligning incentives of the supplier and the customer in such a way that life-cycle environmental impact of the product can be minimized (Tukker & Tischner 2006). There are a number of examples within B2B relationships where this potential has been confirmed (Mont & Plepys 2003). One example is MAN Truck and Bus UK who implemented new technology when adopting a more servitization-oriented business model, thereby managing to decrease their fuel consumption by more than 10 % and their emissions of CO2 by 10-15 % (Baines
& Shi 2015).
3.1.5 Improved risk management
Decreasing risks for the customer is important for companies trying to develop data-driven service offerings. Companies in mature industries report that their customers demand reduced risks and liabilities in connection with service-oriented solutions (Mont 2002b), which means improving the risk management for the customer is a necessity when offering data-driven services. PSS is often
13
brought up as a way for the customer to decrease risk (Neely 2008; Datta & Roy 2011). The decreased risk stems from e.g. higher equipment uptime and transferring of fixed costs into more predictable variable costs (Baines & Shi 2015). Baines & Shi (2015) have also noticed improved safety as one of the potential gains with the new technology, as well as improved asset reliability and asset security.
3.2 Factors affecting adoption of data-driven services
This subchapter provides a basis for answering research question 2 by summarizing factors that could affect whether or not a customer adopts data-driven services. The summarized factors have previously been mentioned in literature in connection with PSS, servitization and Industry 4.0. The benefits from chapter 3.1 also affect customer adoption, but the factors presented here are those that affect customer adoption without being directly connected to what is being realized by a data-driven service offering. Both factors that could enable the adoption and factors that could inhibit the adoption are summarized here. The factors in this subchapter will later be used to construct the Receptiveness score in the hypothetical model presented in chapter 4. The headings in this
subchapter are meant to facilitate the reading and are not directly related to the hypothetical model in chapter 4.
3.2.1 Relationship
In the context of setting up a successful PSS, several authors stress the importance of the
relationship between the OEM and the customer. Kumar and Kumar (2004) argue that the delivery of the required product along with the flow of functionality and the associated services is easier achieved if the parties have been involved with each other before. The relationship also becomes of importance when defining the required activities within the PSS from the perspective of the
customer (Ng & Nudurupati 2010). The increased ability to customize the service offering to the customer that comes from a close relationship also affects the perceived value of the offering for the customer (Goedkoop et al. 1999).
As servitized business models include not only a transactional element but also a relationship element (Baines & Lightfoot 2009), an important factor in answering whether or not a customer is willing to adopt data-driven services is whether the customer is willing to accept a closer relationship with the OEM (Goedkoop et al. 1999). Trust in the service provider enables customer adoption of servitization and is also the basis for successful sales of PSS (Goedkoop et al. 1999).
How the customer views the relationship with the OEM is also relevant. In literature on purchasing strategy it is often suggested that supplier relationships should be managed differently depending on the strategic importance of the supplier. The relationships with strategically important suppliers are more collaborative and could include elements such as setting joint operational improvement targets and sharing cost structures. (v. Weele 2014)
14
3.2.2 Value understanding
An important factor when looking at customers buying any kind of service or product is whether or not the customer understands the value of the offering. This can be regarded as a problem from the producer’s side, meaning it’s up to them to be able to communicate the benefits with their product or service (Mohr et al. 2010). When it comes to a more complex service or product however, the customer’s ability to understand the value might be hindering, regardless of the ability from the seller to communicate the benefits of the product or service. As identified by Erkoyuncu et al. (2011), understanding service uncertainties and estimating costs based on them is a complex and difficult process. Therefore, if the customer is unable to understand all the current and future costs, and benefits of their service, they might be unable to understand the value added in new offerings, thus becoming uninterested in them. What is also important for value understanding is that the customer has a long-term perspective on their service costs and thinks more in the terms of the life cycle costs for the equipment. Customers lacking such understanding might find the cost of data-driven service offerings prohibitively high (Mont 2002b).
Furthermore, many customers might have the ability to theoretically understand the value of an offering, but might not be convinced if the OEM can’t demonstrate the value to them on a satisfactory level (Baines & Shi 2015). There are different ways of demonstrating the value to customers, where one of the most common and traditional ones is the use of a validated reference case (Brunelli et al. 2017). The use of reference cases when selling Industry 4.0 solutions is viable and effective (Brunelli et al. 2017), but requires pilot tests to be run by the OEM.
3.2.3 Organization
Baines & Shi (2015) note that customers can adopt new data-driven services only when they are confident that the new services will fit within the organization. Thus, the organizational structure of the customer plays an important role. In companies surveyed by Baines & Shi (2015), the importance of process compliance and compatibility of existing systems were stressed as facilitating factors when adopting data-driven services. This means that lack of process compliance can negatively influence the customer’s decision of whether or not to adopt data-driven services. Regarding existing systems, the current level of digitization also factors in as a facilitating aspect when adopting new technologies (Raut 2017). In addition to the systems and IT infrastructure, the organizational infrastructure also plays a role in whether or not a customer is able to transition to buying data-driven services (Mont 2002a).
It is also a facilitating factor if the customer has a purchasing strategy for its services. The existence and nature of such a strategy will determine the perceived importance of, and time devoted to, the purchasing of services (Weele v. 2014). Brunelli et al. (2017) note that the degree of centralization also plays a role when adopting new technology, as would be the case with data-driven services. The authors argue that a balance needs to be found between central and local control, where the former is needed for standardization and cost control, and the latter is important for encouraging innovation and creating commitment.
15
Furthermore, the role and the internal political power of the OEM’s point of contact at the customer will affect whether or not a shift towards buying data-driven services will be initiated. Where the point of contact is in the organizational hierarchy in relation to where that kind of decision is made also affects the potential transition towards buying data-driven services.
Finally, the customer needs a budget for the new services. Even though one of the major advantages of the transition to new technology and data-driven services is cost savings, there are costs
associated with switching from the old way of buying service to the new way. This requires a flexible enough budget for the customer to be able to perform the transition (Baines & Shi 2015). It can also require that the customer makes changes in its accounting systems, as current systems might be based on traditional charts of accounts not adapted for data-driven services.
3.2.4 Culture
The ability to integrate new and existing capabilities is identified as a key component in the adoption of Industry 4.0. In order to succeed managers have to change their mindset and be more receptive to new technology and innovations (Brunelli et al. 2017). Furthermore, in a review of existing literature on organizational innovation adoption, Frambach & Schillewaert (2002) identify the organization’s innovativeness as an important factor affecting their adoption decision. Their research shows that a higher organizational innovativeness has a positive effect on the probability of innovation adoption. Another important cultural aspect that has been brought up by Hypko et al. (2010) is risk aversion. A company that is risk avert is a company that every time they stand before a choice where the alternatives have the same expected return but different risks always will choose the less risky alternative. To exemplify, given the choice between a 50/50 gamble paying $200 or $0 and receiving $100 for certain, they would always choose the latter alternative (O’Neill 2001). Hypko et al. (2010) argue that the more risk avert the customer is, the more interested the customer is in a performance-based contract that transfers part of the risk to the OEM.
Among the drivers for servitization is a focus on core competencies. A consequence of this is that institutional unwillingness to outsource and a fear of being too dependent on a single supplier are factors that inhibit customers’ service adoption (Baines & Shi 2015). Loss of perceived control by the customer has also been confirmed ex-post in performance-based contracts. Ng & Nudurupati (2010) examined two performance-based contracts delivering aircraft flying hours and missile system availability in the UK. During interviews with people in the customer’s organization they brought up the loss of perceived control as one of the challenges with the new contract model. The shift in responsibility from the customer to the supplier regarding performance and uptime of the equipment caused discomfort with the customer as they tried to accept their new role.
16
3.2.5 Industry environment
The environment in which the customer is active also plays an important role for the potential interest in data-driven services. Bartodziej (2017) identifies changing market demands as one of the drivers behind Industry 4.0. Among these changing demands Bartodziej counts volatility. Volatility can arise from different sources, e.g. seasonal fluctuations, company-specific situations, local variations and product life cycle stage changes. Regardless, volatile markets set higher requirements on flexibility and adaptability, which can be acquired through data-driven services (Bartodziej 2017). Furthermore, the competitive situation of the company will also affect its tendency to seek new and yet unproven solutions. If a company has a fierce competitive environment, competitive advantages are likely to be temporary. In such a situation, the importance of finding these temporary advantages are vital in order to perform on a high level. Following what the competitors are doing, thus
removing their competitive advantages, is equally important (Chen et al. 2010).
3.3 Prioritization
This subchapter provides a basis for answering research question 3 by describing theory relevant for the customer prioritization.
It is widely acknowledged that setting priorities between customers and creating relationships with the most profitable ones is important for a company to maximize their profitability (Homburg et al. 2008, Mathur & Kumar 2013). It is not uncommon for companies to create customer loyalty programs with different tiers, where different customers are given different service levels. What these tiers are based on is usually purchasing volumes; customers can essentially climb tiers by purchasing more from the company (Lacey et al. 2007). In a study by Homburg et al. (2008) investigating whether or not companies should prioritize between customers at all, a model where the prioritization was based on both past profitability and expected future profitability for the customers was used. Their findings show that there is a positive correlation between customer prioritization based on these two variables and profitability from the prioritized customers.
For the prioritization that is to be made in this thesis however, this kind of customer prioritization does not take into account enough aspects for it to be deemed usable. Since the customer adoption is in question because of the customer unfamiliarity with and complexity in data-driven service offerings, historical sales volumes and customer profitability are not by themselves reliable for identifying which customers are most likely to buy the new kind of service. Expected future
profitability was used for the customer prioritization in the study by Homburg et al. (2008) and could include more aspects related to customer adoption, but this concept was not strictly defined and differed between the companies studied. Furthermore, to strengthen the focus on the likelihood of the customer adopting the new service offering, the value can be discussed from the customer’s perspective instead of the provider’s perspective. Thus, existing customer prioritization models are not sufficient for the prioritization of customers when implementing a data-driven service offering in a conservative industry.
17
In order to tackle research question 3, a different approach for analyzing it and coming up with a prioritization was needed. There are many general problem-solving approaches described in
academic literature. A notable example is the use of a 2x2 matrix, which has been identified by Lowy & Hood (cited in Brown 2004) as a great problem-solving tool that provides a good structure and encourages to see both sides of an issue. A 2x2 matrix helps attack the problem on a higher level of logic and provides a model that is very easy to apply and communicate. At the same time, it does not sacrifice in potential complexity, proved in models such as the Kraljic matrix (Kraljic, 1983), the BCG matrix (Henderson 1970) and the Ansoff matrix (Ansoff, 1957). It is however important that there is that there is some opposition between the axes in the matrix. Furthermore, the axes need to be relevant and cover a large part of the issue the matrix is meant to help solve. Thus, the axes need not cover only one aspect, and they need to be constructed with care (Lowy & Hood, cited in Brown 2004).
When constructing a matrix like this, it is important to start with the end state in mind. This helps guide the process and sets the bar for what is considered a successful model. Then one needs to find all potentially important aspects that influence the problem at hand. These are then used to find larger areas or themes. Finally, after a prioritization of the themes these are used to design the actual matrix by setting them on the axes. The matrix then of course needs to be questioned to see if it actually covers the most important aspects of the problem or if there is something missing. (Lowy & Hood, cited in Brown 2004)
3.4 Cases
In this subchapter a few examples of OEMs that have developed and deployed data-driven services, along with what they have been able to realize for their customers, are given. The subchapter is written from the perspectives of the OEMs since that is how most literature has chosen to approach the cases.
3.4.1 Xerox
An industry that has been one of the pioneers in the field of servitization is the photocopier industry. They adopted pay-per-use revenue models long before many other industries. The first servitized offering in the industry came in the end of the 1950s, when Xerox started renting out instead of just one-off selling their Xerox 914 model. This shift in business model came about because of the high manufacturing cost for the model, since it used a different, newly developed technology. A monthly cost for leasing the equipment that included all costs for service and the first 2 000 copies was used, which became very successful. (Visintin 2014)
Xerox has since continuously developed their servitized offering and today, they offer what they call document management services, which is supposed to optimize the customer’s document-related processes and infrastructure (Visintin 2014), including managing the contact with external parties such as the postal service (Baines & Shi 2015). As a result of adopting the servitized offering from Xerox, British
18
Airways, Islington Borough Council, and Sandwell Borough Council all managed to save around 30 % in printing and reprographic costs (Baines & Shi 2015).
3.4.2 Rolls-Royce
In the beginning of the 21st century Rolls-Royce faced a decline in the demand for spare parts following the advances in technology. Since this was their most profitable income, it sparked a strategic change in the company, from being product-centric to customer-centric (Smith 2013). This in turn sparked a change in their offering, from selling jet engines to selling a service where the customer pays for each hour that the engines are in the air. Their first customer for this offering was the US navy. In the contract Rolls-Royce assumed all responsibility for the maintenance in exchange for being the only provider of engines and engine maintenance. The contract also included a
guarantee of a certain performance, which was measured in engine availability, where Rolls-Royce guaranteed a rate of 80 % where the average at the time being was 70 % (Smith 2013).
The three main benefits for the US navy with this contract as identified by Smith (2013) was firstly that they could avoid the uncertainty inherent from the unpredictability of machine breakdowns. Secondly, they would get an improved service level and a guaranteed higher engine availability. Third, this contract would in total cost them less than the previous way of buying engines and maintenance. The contract proved to be a big success, with Rolls-Royce being able to meet and even exceed the expectations and guarantees. The US Navy even ended up saving in total $38M in the first three years of the contract (Smith 2013).
Today Rolls-Royce have developed this offering to provide after-sales services to both the defence sector and the civil airline sector. They offer different care packages, including services like logistics management, engine health monitoring, spare engines services, efficiency management, engine & parts trading, etc (Rolls-Royce, n.d.). The transition to the new strategy has helped them significantly increase their revenue and provide more value to their customers (Smith 2013).
3.4.3 Alstom Group
The Alstom group is one of the biggest energy and transportation infrastructure manufacturers in the world. Their transport division has since the middle of the 1990s changed their business model towards becoming a system and service provider, instead of just selling goods. This transition was sparked by changes in the UK railway market. When British Rail broke up in 1993, the market demand for maintenance contracts increased dramatically. Alstom saw this opportunity and decided to create a service business that offers services that were previously performed by national railway monopolies. (Davies 2004)
One of the main reasons the opportunity presented itself to Alstom was that when the railway in the UK was privatized, the companies operating the railways had different financial stakeholders to answer to, i.e. banks and finance companies. They had higher demands on making sure that the railway was in good condition with a low risk of failing in order to grant the operating companies
19
loans. Therefore, the operators wanted to involve the OEM, i.e. Alstom, who had the most knowledge about the asset. Alstom Transport has, as an example, since managed to increase the passenger numbers from 13 million per year to 32 million per year on a certain line, an increase which they to a large extent attribute to the adoption of data-driven services (Baines & Shi 2015) Another branch of the Alstom group, namely Alstom Power, has mentioned that one of the reasons they decided to servitize their offering was to defend their ground on the market. Their reasoning was that if a competitor secured a contract on one of their machines, they could possibly do so for more machines all around the world. Their servitization strategy prevents this by securing a contract with the customer so that Alstom is the sole provider of service. (Baines & Shi 2015)
3.4.4 Thales Training & Simulation
Thales Training & Simulation is a company that traditionally has sold flight simulators to both the defence and civil market. In the beginning of the 21st century, they too adopted a new business model that focuses more on selling flight training services instead of just selling simulators. The Vice Chairman of the company himself commented: ‘Whereas a few years ago you could sell a unit and walk away, generating a profit now depends more on selling services, selling hours on simulator services’ (Mulholland 2000, cited in Davies 2004). The main reason for the shift in business model is to enable Thales to gain additional revenue from the aftermarket service offering, compared to only having one-off sales (Davies 2004).
3.4.5 Krones
Another example of a customer who has developed advanced data-driven services for their
customers is Krones, a manufacturer of packaging and bottling equipment. At the drinktec 2017 fair they presented a new offering based on digitalization solutions that they will begin to offer their customers (Canadian Packaging 2017). With the help of data collected from the equipment, they offer help to their customers with maximizing their efficiency in production. The data collected from the equipment is collected in one platform so that all information about the plant is available in one place. Analyses of the large amounts of data help them draw conclusions about the site’s
performance and suggest improvements. Their offering also includes condition monitoring of equipment, real time event tracking, and predictive maintenance. (Krones n.d.)
20
4
THEORY - HYPOTHETICAL MODEL
This chapter constitutes the hypothetical modeling of the model design phase, visualized in Figure 3. It compiles and arranges the established theoretical basis from chapters 3.1-3.3 along with what has been seen in cases in chapter 3.4 into a hypothetical model for customer prioritization model according to the purpose of the thesis. The chapter starts with a summary of the model. Then a description of how the model was constructed follows. Next, the parts of the model are described in more detail. Finally, the authors’ intention of how to use the model is presented.
Figure 3. Position of chapter 4 in the work process
4.1 Summary of model
This model is intended to be general and applicable to OEMs in different industries. The abstraction level of the model as presented here is therefore intentionally quite high.
The basic idea behind the model is to score each customer on:
1. to what extent the benefits of data-driven services from chapter 3.1 have the potential to be realized for that customer if it would adopt data-driven services
2. to what extent the factors from chapter 3.2 are present within that customer and/or its environment
Hereafter, 1 will be referred to as the customer’s Potential and 2 will be referred to as the customer’s Receptiveness. The Potential and Receptiveness of a customer are obtained by scoring that customer in a number of areas and then weigh these area scores together into Potential and Receptiveness scores respectively.
The logic behind the Potential score is that customers with higher potential for realized benefits with data-driven services will be more prone to adopt these offerings. However, the existence of a
potential for realized benefits might not be enough to be able to sell data-driven services to the customer. There are several other factors that could make the customer decide to not implement the offering. These factors are instead supposed to be reflected in the Receptiveness score. The areas that make up the Receptiveness score are to anticipate the way that the customer will value the business case presented by the OEM, as well as how ready the customer is to transform their business to utilize the new service offering. These areas are more dependent on the customer’s surrounding and overall business strategy than the areas within the Potential score.
21
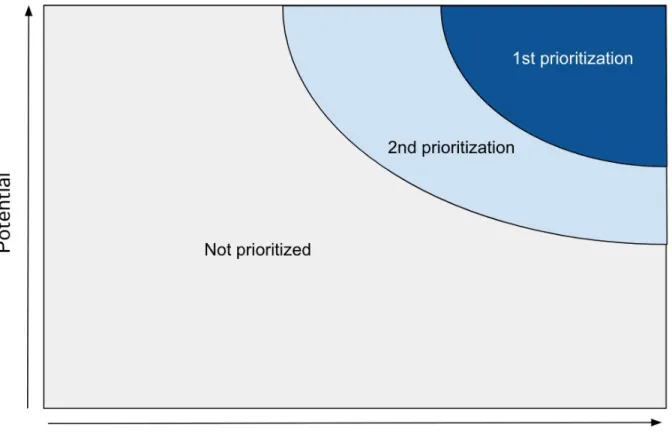
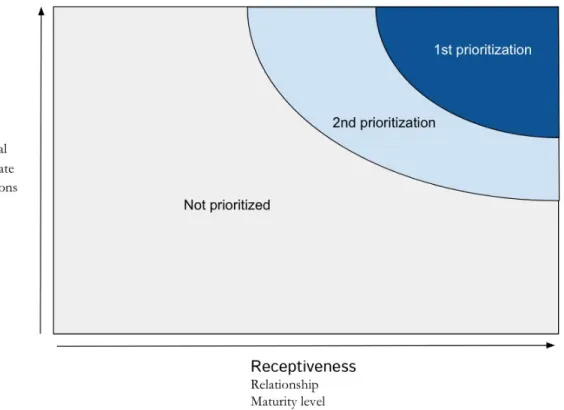
From the Potential and Receptiveness scores a discussion basis for prioritization among an OEM’s customers can be obtained by visualizing the customers in a matrix where the Potential score represents the Y axis and the Receptiveness score represents the X axis. There are several ways in which the information from the matrix can be used. An example would be to draw threshold lines to segment the customers. These can be drawn in different ways depending on how the user of the model wants to set the lower thresholds for the prioritization segments. An example of such lines and segments can be seen in Figure 4, where parabolic lines have been used to create two
prioritization areas, where customers in the darker area are the most prioritized, the customers in the lighter area are 2nd in prioritization and remaining customers are not prioritized.
Figure 4. Example of matrix with prioritization areas
4.2 Construction of model
A hypothesis behind the construction of the model, also reflected in research question 3, is that a customer’s current likelihood of adopting data-driven services can be described partly by the benefits that can be realized for that customer (chapter 3.1) and partly by other factors that influence
customer adoption (chapter 3.2). In order to put this together into a model the theory on prioritization from chapter 3.3 was used.
22
The choice of using the matrix concept described in chapter 3.3 was made for several reasons. First, this model is meant to be general and applicable to different OEMs, meaning that it needs to describe the problem on a rather high level. Second, it is meant to provide a discussion basis for prioritization among customers, meaning that is is advantageous if the model is easy to
communicate. Third, the findings from literature in connection with research question 1 and 2 (i.e. what is here called Potential and Receptiveness) were deemed to explain a large part of a customer’s likelihood of adopting data-driven services, meaning that these would be a good fit for axes in a matrix. Furthermore, Potential and Receptiveness were hypothesized to be opposing to each other to a high degree, which strengthens the reasoning behind using them as axes in a matrix.
When constructing the matrix the guidelines presented in the end of chapter 3.3 was roughly followed. The aspects identified to influence the problem were the answers to research question 1 and 2. The first step was therefore to make a long list with these answers. From this list, larger areas were then formed. This was done in an iterative manner with feedback from the supervisors at LTH and the case company influencing each iteration. Given the delimation on internal use, one
important guideline for the process of forming larger areas was that it should be possible to score a customer in each area with information available within the OEM’s organization.
There were two main differences in the construction process compared to the guidelines in the end of chapter 3.3. The first one was that the gathering of potential aspects influencing the problem was done prior to deciding that a matrix was to be constructed. This was a consequence of how the research questions of the thesis were formulated, where research question 1 and 2 were investigated before research question 3. The second one was that the strict 2x2 matrix concept where each quadrant is labelled was not used. The reason for this decision was that the aim of the model is to prioritize customers rather than segmenting them. It is therefore the customers’ relative placement in the matrix that is the most important aspect of the model output, not their absolute placement.
4.3 Potential
The Y axis of the model is called Potential and describes to what extent the benefits from chapter 3.1 have the potential to be realized for a customer if it would adopt data-driven services. A customer’s Potential is obtained by scoring the customer in areas presented in this subchapter and then weight and summarize these area scores into a Potential score. How to do this should be adapted to each application of the model, and will depend on the OEM’s equipment offering and industry. For example, a high score in one area and a low score in another should not necessarily indicate a medium score on the axis, depending on what the OEM equipment offering looks like. In summary, the areas on the Potential axis are:
● Potential of installed base
● Above average maintenance costs ● Cost of standstill
23 ● Equipment uptime
● Environmental benefits ● Amount of accidents
Below follows a presentation of the areas on the Potential axis, along with the reasoning behind them and an indication of what is sought in each area.
4.3.1 Potential of installed base
Cost savings is one of the main potential benefits with data-driven services and has also been observed in several of the cases investigated, e.g. for Rolls-Royce’s customers. Therefore, the first area on the Potential axis is the potential of the installed base at the customer. What would render a high score here is a large installed base at the customer site, with equipment that in general is expensive to repair and maintain. The logic is that the more equipment the customer has, the more equipment the new technology can be implemented on, and the higher the potential of adopting a data-driven service offering is. However, exactly how to score the customer in this area and what size should give what score is up to the OEM applying the model.
When setting the score for the installed base, there are several considerations that should be made. First of all, what equipment is to be looked at should be decided upon. For example, if an OEM sells several machines that vary in size and cost to maintain, these shouldn’t be valued equally. The score of the size has to be comparative as well, meaning that what is considered a “large” installed base will have to be based on some kind of average among the OEM’s customers. Beyond these, there might be OEM-specific considerations to be made when deciding upon the criterias for the scoring.
4.3.2 Above average maintenance costs
The second area is the average maintenance costs for the installed base at the customer site, which also directly relates to cost savings. What would render a high score here is higher than average maintenance costs for the customer’s equipment, especially for equipment with a relatively high maintenance costs from the outset (if those vary). The logic behind this area is that it, together with the installed base, will give a good idea of the potential cost savings that can be achieved at the customer. Again, what constitutes high maintenance costs must be decided upon by the OEM applying the model.
When setting the score for the maintenance costs the OEM needs to take many things into
consideration and decide upon criterias for the scoring. As an example, one consideration could be whether the costs should be counted as a percentage above the average or as an absolute value which both have their advantages. In any case the OEM needs to consider that a customer that has
maintenance costs just above average on equipment that is expensive to repair might have a higher potential than a customer with costs high above average on equipment that is cheap to repair. Ideally the score in this area is set in relation to what the OEM calculates it can reduce the maintenance costs to with a data-driven service offering.