Analysis of three sets of SWIW
tracer test data using a two-population
complex fracture model for matrix
diffusion and sorption
Research
Authors:
2009:09
Christine Doughty Chin-Fu Tsang
Title: Analysis of three sets of SWIW tracer test data using a two-population complex frac-ture model for matrix diffusion and sorption
Report number: 2009:09
Author/Authors: Christine Doughty1) and Chin-Fu Tsang1, 2)
1)Earth Sciences Division, Lawrence Berkeley National Laboratory, Berkeley, California 94720, USA 2)Department of Earth Science and Engineering, Imperial College, London, SW7 5JP, UK
Date: Mars 2009
This report concerns a study which has been conducted for the Swedish Radiation Safety Authority, SSM. The conclusions and viewpoints pre-sented in the report are those of the author/authors and do not neces-sarily coincide with those of the SSM.
SSM Perspective Background
In preparation of the review of a license application for a spent nuclear fuel repository, SSM funds research on different aspects that are of im-portance for the repository safety. One aspect is the potential for reten-tion of radionuclides in the fractured rock surrounding the planned repository. The Swedish Nuclear Fuel and Waste Management Company (SKB) has studied the retention of different tracers using single well injection withdrawal tests (SWIW) as part of the site characterisation programmes at the two candidate sites. The SWIW test data is analysed using mathematical modelling in order to shed light on occurring pro-cesses and to quantify related process parameters. In the safety analysis this information can then be used to build confidence in the used radi-onuclide transport models and their parameterisation.
Objectives of the project
This study has been undertaken to obtain a better understanding of the processes underlying retention of radionuclides in fractured rock by using different model conceptualisations when interpreting SWIW tests. In particular the aim is to infer the diffusion and sorption parameters from the SWIW test data by matching tracer breakthrough curves (BTC) with a complex fracture model. The model employs two populations for diffusion and sorption. One population represents the semi-infinite rock matrix and the other represents finite blocks that can become saturated, thereafter accepting no further diffusion or sorption.
Results
For the non-sorbing tracer uranine, both the finite and the semi-infinite populations play a distinct role in controlling BTC. For the sorbing tra-cers Cs and Rb the finite population does not saturate, but acts essenti-ally semi-infinite, thus the BTC behaviour is comparable to that obtained for a model containing only a semi-infinite rock matrix. The ability to match BTC for both sorbing and non-sorbing tracers for these three different SWIW data sets demonstrates that the two-population complex fracture model may be useful to analyze SWIW tracer test data in general. One of the two populations should be the semi-infinite rock matrix and the other finite blocks that can saturate. The latter can represent either rock blocks within the fracture, a fracture skin zone or stagnation zones.
Effect on SSM activity
Knowledge of how process and model assumptions affect the radionu-clide transport calculations is important for the evaluation of a safety analysis for a spent nuclear fuel repository. Present report contributes to building such knowledge and thus to the authority’s preparation for a license application review.
Project information
Project manager: Georg Lindgren Project reference: SSM 2008/306
Content
1. Introduction ...2 2. Model Features...4 3. Field Data...10 4. Model Results...14 5. Discussion ...17 Background Concentration ...17Use of Semi-infinite Only Model for Analysis ...17
6. Concluding Remarks...21
Acknowledgements ...22
1. Introduction
The usual conceptual model of flow and transport through fractured rock involves advection and dispersion through the fracture network coupled with diffusion and sorption into the surrounding rock matrix. In a single-well injection-withdrawal (SWIW) test, one well injects fluid and tracer at a con-stant rate for a period of time, followed by injection of fluid (chase fluid) without tracer for a somewhat longer period. Then the pump is reversed and the well withdraws fluid at the same rate until most or all of the tracer is recovered. SWIW tests have also been referred to as push-pull and huff-puff tests (Tsang, 1995; Haggerty et al., 1998). Unlike typical two-well tracer tests, SWIW tests, involving reversing flow fields by injection and subse-quent withdrawal at the same flow rate, focus on diffusion and sorption, and, ideally, are independent of advective heterogeneity (“advective disper-sivity”), channelling, and flow dimension.
For two-well tracer migration, key features of a tracer breakthrough curve (BTC) are the peak arrival time tpk, the peak height Cpk, the slope of the tail,
and the tracer “first” arrival: C ≈ 10-3.Cpk. For a SWIW test, they are peak
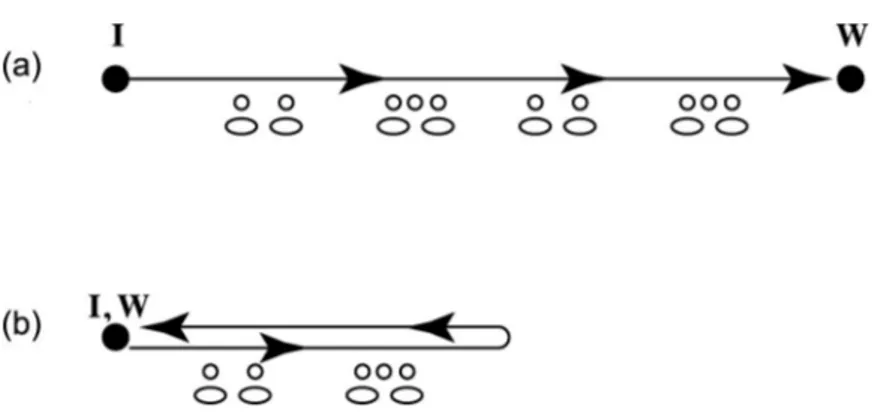
height, slope of tail, and the tracer recovery factor. Travel time is essentially fixed for a SWIW test, set by the schedule of the test, whereas travel dis-tance is essentially fixed for a two-well test, set by well separation. Figure 1 shows a schematic view of tracer particles moving through a fractured me-dium for a two-well test and for a SWIW test, and the opportunities they experience for diffusion and sorption into the surrounding rock matrix. In a two-well test, particles always see new rock matrix, whereas in a SWIW test, they revisit the same rock matrix on the withdrawal phase that they already passed during the injection phase. If this rock matrix is composed of finite-sized blocks, these blocks may become saturated in a SWIW test, thus greatly inhibiting further diffusion and sorption.
Compared to a typical two-well tracer test, a SWIW test is expected to pro-duce a higher tracer recovery, be more feasible in the field, and possibly provide information on the flow wetted surface (FWS) of a fracture network (Tsang and Doughty, 2007).
Figure 1. Schematic diagram of particle travel path during a two-well test (a) and a SWIW test (b). Arrows represent advection through the fracture and circles and ovals represent finite rock blocks into which diffusion and sorption may occur. The semi-infinite rock matrix, also present, is not shown in this figure. I and W indicate injection and withdrawal wells respectively.
The present paper uses complex fracture models containing two rock popula-tions for diffusion and sorption to model three representative SWIW tests conducted at Forsmark and Laxemar, the two sites currently under investiga-tion by the Swedish Nuclear Fuel and Waste Management Company (SKB). For tracers, the tests used uranine (U), a non-sorbing tracer, and rubidium (Rb) and caesium (Cs), which are sorbing tracers. By calibrating the models to the BTC obtained in the field, diffusion and sorption parameters for the two populations are obtained. The next section, Section 2, briefly presents the complex fracture models. Section 3 then describes the field data, fol-lowed by results of the model calibration in Section 4. Section 5 discusses some of the features that make modelling challenging, and Section 6 pro-vides some conclusions.
2. Model Features
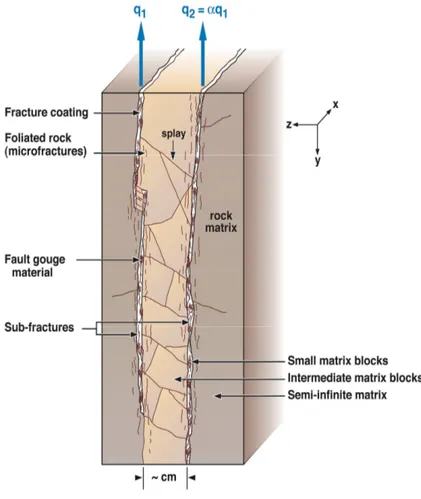
In this section, we briefly describe the complex fracture model (Tsang and Doughty, 2003). The complex-fracture model for fluid flow and tracer transport incorporates the important physical effects of a realistic fracture, including advection through a heterogeneous fracture plane, partitioning of flow into multiple sub-fractures in the third dimension (orthogonal to the fracture plane), and diffusion and sorption into fracture-filling gouge, small altered rock matrix blocks within the fracture zone, and the unaltered semi-infinite rock matrix on both sides of the fracture zone (Tsang and Doughty, 2003). Figure 2 illustrates the complex fracture model.
The complex fracture model is composed of two sub-fractures, and the flow through the fracture q is the sum of the flow through the two sub-fractures, q1 and q2.
q = q1 + q2. (1)
The flows q1 and q2 are related by
q2 = q1, (2)
where can range from 0 (only a single sub-fracture) to 1 (two identical sub-fractures). The transmissivity over the fracture plane is assumed to be heterogeneous: T(x,y).
In general, the complex fracture model assumes possible diffusion and sorp-tion into three populasorp-tions: fracture-filling gouge, small altered rock matrix blocks within the fracture zone (intermediate blocks), and unaltered semi-infinite rock matrix on both sides of the fracture. For the present study, however, only two populations are considered: one finite population repre-senting gouge and small altered blocks, and one semi-infinite population representing intact rock matrix on both sides of the fracture plane.
The parameters characterizing the transport are fracture porosity f, matrix
porosity m, and effective matrix diffusion coefficient De, which is defined as
the product of free-water diffusion coefficient, matrix tortuosity , and ma-trix porosity m. For a sorbing tracer, the product of rock density p and
sorption coefficient Kd replaces m. Each of the two populations has its own
values of m, τ, and pKd, with its own characteristic length scale. For the
finite population, the characteristic length scale is denoted 2rm, and
repre-sents the size of the finite block. For the semi-infinite population, the char-acteristic length scale is the fracture aperture b.
A numerical model is used to simulate the fluid flow field through a two-dimensional fracture, which has a heterogeneous transmissivity distribution, based on a finite-difference method using a rectangular grid. The central portion of the model, where the well is located and where the tracer is ex-pected to remain, has high spatial resolution. Beyond this region, the model becomes coarser, and extends a great distance to constant-pressure bounda-ries. Then a particle-tracking algorithm is used to calculate tracer advection through the fracture, including the distribution of particles among sub-fractures. Diffusion and sorption into the different populations making up the surrounding rock matrix are determined probabilistically by inverting semi-analytical solutions (Tsang and Tsang, 2001; Tsang and Doughty, 2003) to determine delay times that represent diffusion and sorption.
In order to minimize numerical dispersion that occurs while calculating ad-vective transport in the fracture plane, we employ a special procedure for modelling the flow reversal that happens during a SWIW test. During the injection period the advection calculation is normal — particle advection from one cell to its neighbouring cells occurs based on the finite-difference calculation of the flow velocities between these cells. If the flow direction is not parallel to the grid orientation, the destination cell is chosen probabilisti-cally from among all the neighbouring cells, with probability proportional to the flow rate into each cell. For each particle, the sequence of cells traversed is recorded. Then, for advection during the withdrawal period, the sequence of cells traversed during injection is reversed. Thus, the advective part of transport occurring during the injection period is exactly reversed for the withdrawal period, properly simulating the physical situation. Diffusion and sorption still occur probabilistically by inverting semi-analytical solutions as described above.
Over the course of the development of the complex fracture model, three different conceptual models, C1, C2 and C3, have been considered to de-scribe how the different populations operate relative to each other. In con-ceptual model C1 (Tsang and Doughty, 2003), for each particle at any given time step, diffusion and sorption occur into only one of the three popula-tions, chosen probabilistically (sum total of probability being unity) based on given proportions of each population. This conceptualization implies that all populations block each other. Thus, when finite populations saturate, the particle does not have an opportunity to diffuse into the semi-infinite me-dium instead. Conceptual model C2 (Tsang et al., 2008; Tsang and Doughty, 2007) considers two-level diffusion. At the first level, each particle chooses one of two finite populations probabilistically (P ≤ 1) and a tentative delay time t1 is calculated. At the second level, diffusion into the semi-infinite
medium is calculated and a second tentative delay time t2 is obtained. We
then take the maximum of t1 and t2. This conceptualization implies that only
the two finite populations block each other. When finite populations satu-rate, the particle does have an opportunity to diffuse into the semi-infinite medium instead. The conceptual model C2 has the advantage over C1 in that the tracer BTC tend to the semi-infinite case for large times, when the finite blocks are saturated.
Conceptual model C3, proposed by Tsang and Doughty (2009), is the ap-proach used in the present paper. In this model, each particle sees each of three populations at each time step. For the finite-block populations, fracture porosity f is increased to account for the limited amount of that population
present. Delay times for each population are added. This conceptualization implies that none of the populations block each other. Each particle always has the opportunity to diffuse into all populations. This conceptual model not only yields the semi-infinite results at large times after the saturation of the finite blocks, but also provides the possibility of representing, at least
ap-proximately, the multi-layer effect of tracer migration into the semi-infinite matrix after passing through rock of a finite thickness.
With the improved numerical scheme for reversed flow calculation and the implementation of the new conceptual model C3, the model is applied to calculate tracer flow and transport. The BTC is obtained by binning particle arrivals to form a histogram. If n particles arrive in bin i of time-duration t(i), they correspond to a dimensionless concentration Cbin(i)/Cin given by
inj in bin
t
N
i
t
i
n
C
i
C
/
)
(
/
)
(
)
(
, (3)where N is the total number of particles injected (typically of the order of 200,000), tinj is the duration of the injection period, and Cin is the injection
concentration, given by Cin = IM/Vbh, where IM is the injected mass and Vbh
is the volume of the borehole section into which tracer is injected. Bin time duration (i.e., bin width) increases with time to more efficiently handle BTC with long tails. The time corresponding to bin i is given by
2
/
)
(
)
(
)
(
1 1i
t
j
t
i
t
i j
. (4)Rearranging Equation (3) for dimensionless concentration yields
bh inj bin
V
IM
t
N
i
t
i
n
i
C
/
)
(
/
)
(
)
(
. (5)Cbin(i) is then modified to explicitly include borehole mixing according to
)
(
)
(
)
(
)
1
(
)
(
i
V
V
i
C
i
V
i
C
V
i
C
bin bh bin bin bh bh bh
, (6)where Cbh(i) is the mixed concentration in the borehole for bin i and Vbin(i) is
the volume of fluid extracted during time interval t(i). A dummy is in-serted into the borehole to minimize Vbh, and thus minimize the difference
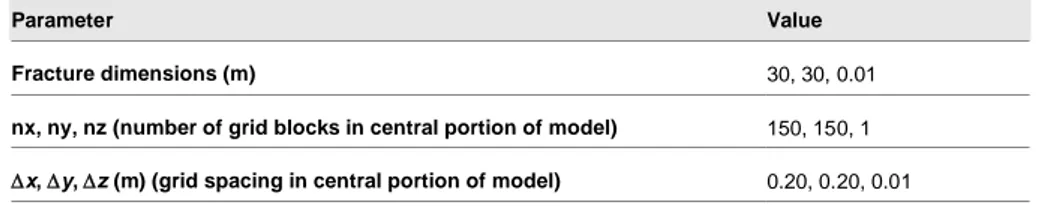
Table 1. Parameters of fracture transmissivity distribution (Doughty and Uchida, 2003).
Parameter Value
Fracture dimensions (m) 30, 30, 0.01
nx, ny, nz (number of grid blocks in central portion of model) 150, 150, 1
x, y, z (m) (grid spacing in central portion of model) 0.20, 0.20, 0.01
Sequential indicator simulation using a CDF for log10T based on 15 well-test analyses for 5 boreholes
Geometric mean transmissivity T 3.56.10-7 m2/s
Standard deviation of log10T (T in m2/s) 1.35
Fracture aperture b (from cubic law) 7.54.10-5 m
Geometric mean hydraulic conductivity K = T/b 4.73.10-3 m/s
Spherical variogram range – for lower 80% of T values 0.6 m
Spherical variogram range – for higher 20% of T values 2 m
Mean fracture porosity f 0.0226 Fracture structure parameter 0
Table 1 summarizes the parameters of the stochastic fracture transmissivity distribution (Deutsch and Journel, 1988) used for the present study which are representative of a tracer test site in granitic rock at Äspö, Sweden (Doughty and Uchida, 2005) and thus correspond to realistic field properties. The transmissivity and fracture porosity values are comparable to values esti-mated for the Forsmark site (Thur et al., 2007a; 2007b). Recent studies (Tsang and Doughty, 2007) have shown that SWIW-test BTC are not very sensitive to the heterogeneity level of the transmissivity distribution, or the fracture structure parameter . Table 2 summarizes the initial diffusion and sorption parameters for the model. Values shown in bold are varied during calibration to the BTC observed in the field.
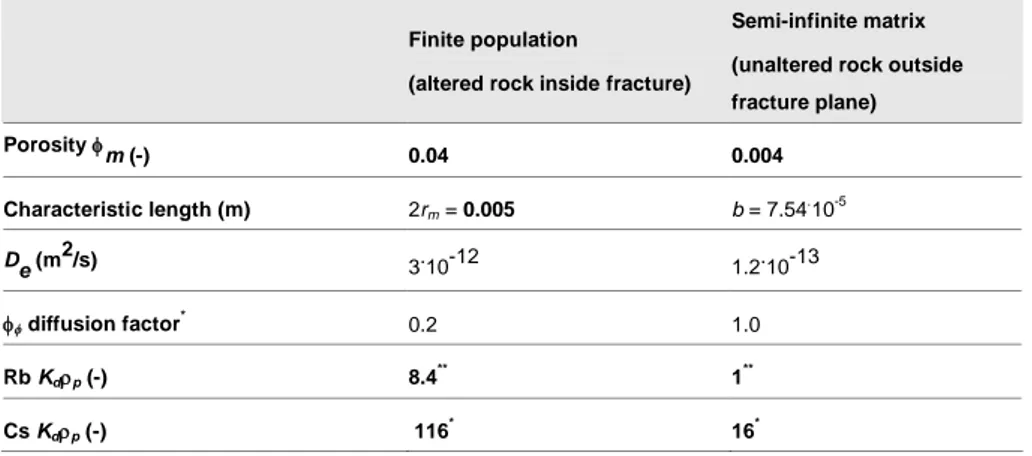
Table 2. Diffusion parameters for finite and semi-infinite rock populations. Values shown in bold are varied during model calibration.
Finite population
(altered rock inside fracture)
Semi-infinite matrix (unaltered rock outside fracture plane) Porosity m (-) 0.04 0.004 Characteristic length (m) 2rm = 0.005 b = 7.54 . 10-5 De (m2/s) 3.10-12 1.2.10-13 diffusion factor * 0.2 1.0 Rb Kdp (-) 8.4 ** 1** Cs Kdp (-) 116 * 16* *
Fraction occupied by finite population for conceptualization C3
**
3. Field Data
Field data from three SWIW tracer tests conducted by Swedish Nuclear Fuel and Waste Management Company (SKB) were proposed for our analysis (Geier, private communications, 2008). They were selected as representative of a range of possible BTC profiles found in a series of many SWIW tracer tests that were performed by SKB in the past few years. Specifically the three data sets are from the SWIW test in a well at Laxemar, KLX11A, borehole section 598-599 m, and from two SWIW tests in a well at Fors-mark, KFM01D, borehole sections 431-432 m and 377-378 m. Table 3 summarizes the operating conditions for each SWIW test modelled. In each of the SWIW tests, the tracer injection period is modelled as having a con-stant flow rate. Following tracer injection, there is a chase-fluid injection period, also modelled with a constant flow rate. Next is a waiting period in which no flow occurs, followed by withdrawal at a constant flow rate. In these tests, some of the tracers are already present in the formation fluid prior to the SWIW tests, giving rise to a background level that needs to be subtracted from the BTC.
Tracer concentration C entering the fracture has a time-dependent concentra-tion to represent mixing in the borehole, calculated according to
C(t) = (C0 – Cin)exp[-qt/(Vbh + KaAbh)] + Cin for 0 < t < tinj (7a)
C(t) = C(tinj)exp[-q(t – tinj) /(Vbh + KaAbh)] for t > tinj, (7b)
where surface sorption coefficient Ka = 0.01 for Cs and Rb and 0 for U, C0 =
0 (no tracer initially in borehole), Cin is input concentration of tracer, Vbh is
borehole volume, Abh is borehole surface area, and q is flow rate. Figure 3
illustrates the effect of the time-dependent tracer concentration.
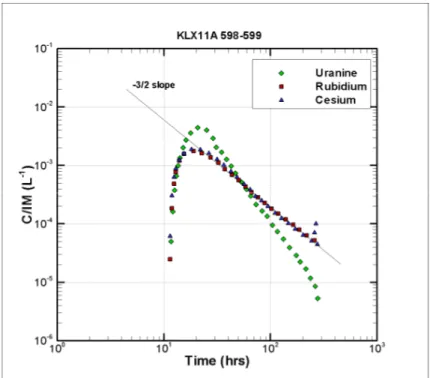
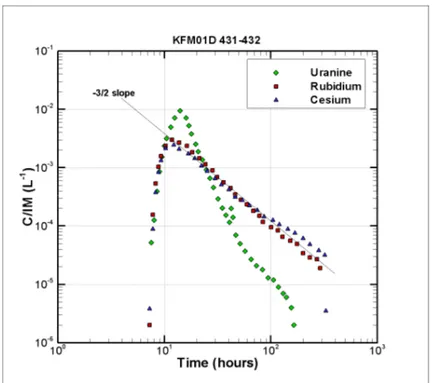
Figures 4-6 show the tracer BTC field data for the three SWIW tests, having included any necessary background concentration corrections. In the BTC plots, concentration C (in mg/L) is normalized by the injected mass IM (in mg).
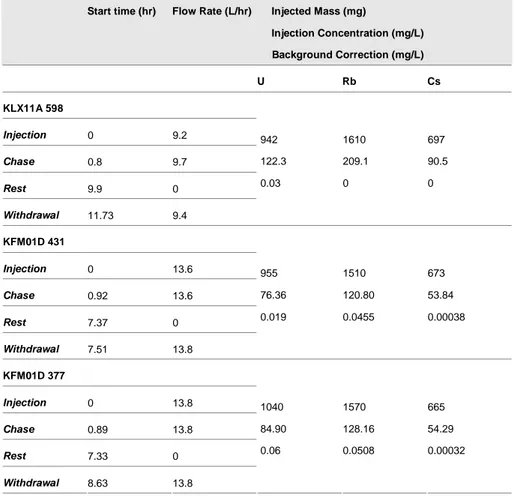
Table 3. Test schedules for the three SWIW tests modelled.
Start time (hr) Flow Rate (L/hr) Injected Mass (mg)
Injection Concentration (mg/L) Background Correction (mg/L) U Rb Cs KLX11A 598 Injection 0 9.2 Chase 0.8 9.7 Rest 9.9 0 Withdrawal 11.73 9.4 942 122.3 0.03 1610 209.1 0 697 90.5 0 KFM01D 431 Injection 0 13.6 Chase 0.92 13.6 Rest 7.37 0 Withdrawal 7.51 13.8 955 76.36 0.019 1510 120.80 0.0455 673 53.84 0.00038 KFM01D 377 Injection 0 13.8 Chase 0.89 13.8 Rest 7.33 0 Withdrawal 8.63 13.8 1040 84.90 0.06 1570 128.16 0.0508 665 54.29 0.00032
Input pulses for KFM01D, interval 431-432 m 0 0.2 0.4 0.6 0.8 1 0 1 2 3 Time (hr) C /C in Uranine Cesium, Rubidium End Inj
Figure 3. Example of time-dependent tracer concentration entering the fracture.
Figure 4. Tracer BTC for Test KLX11A, interval 598-599 m. Uranine has been corrected for background concentration. The line with -3/2 slope is added for reference.
Figure 5. Tracer BTC for Test KFM01D, interval 431-432 m. All tracers have been corrected for background concentration. The line with -3/2 slope is added for reference.
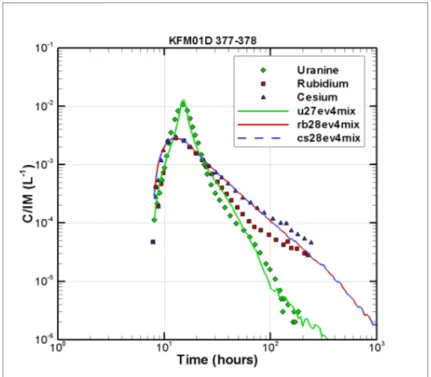
Figure 6. Tracer BTC for Test KFM01D, interval 377-378 m. All tracers have been corrected for background concentration. The line with -3/2 slope is added for reference.
4. Model Results
For each SWIW test, the uranine BTC was considered first, with matrix po-rosity m for the finite and infinite populations, and characteristic length
scale 2rm for the finite population varied until a reasonable match was
ob-tained. Then these same parameter values were used for the Rb and Cs BTC, with their respective sorption coefficient Kdp varied until a reasonable
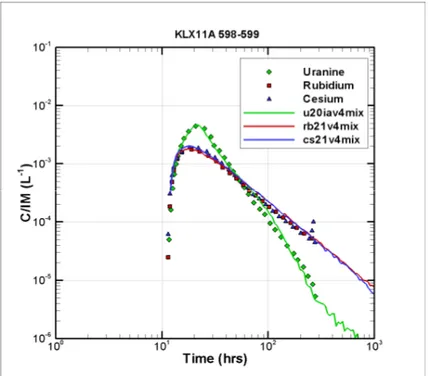
match was obtained. BTC results are shown in Figures 7-9 and the corre-sponding property values are shown in Table 4. The matches for KLX11A and KFM01D 431 are very good. The match for KFM01D 377 is relatively less good for U and Rb, and further considerations of variability within our conceptual model may be worthwhile.
Figure 8. Model and field BTC for Test KFM01D, interval 431-432 m.
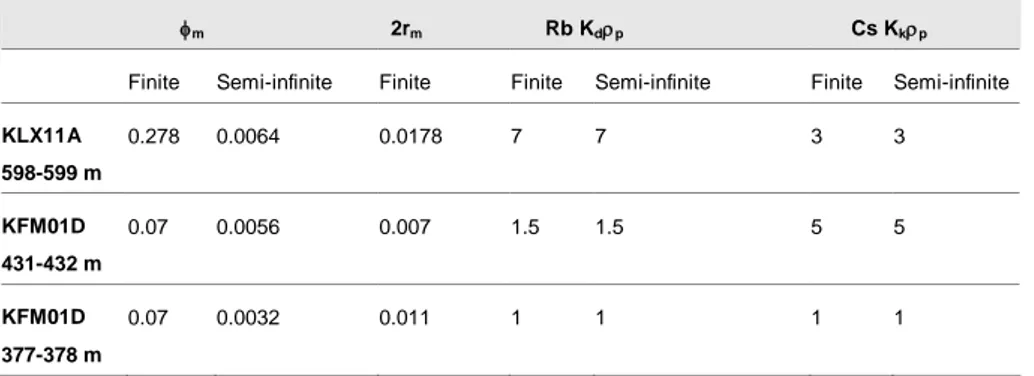
Table 4. Inferred diffusion and sorption parameters for the three SWIW tests.
m 2rm Rb Kdp Cs Kkp
Finite Semi-infinite Finite Finite Semi-infinite Finite Semi-infinite
KLX11A 598-599 m 0.278 0.0064 0.0178 7 7 3 3 KFM01D 431-432 m 0.07 0.0056 0.007 1.5 1.5 5 5 KFM01D 377-378 m 0.07 0.0032 0.011 1 1 1 1
5. Discussion
Background Concentration
Having to subtract a background concentration to obtain BTC means that the lowest values in the BTC (very early and very late times) are rather inaccu-rate, because they are the result of subtracting two very small numbers from one another. This is illustrated in Figures 10, which show that two alterna-tive uranine background values of 0.019 and 0.048 mg/L yield very different BTC profiles (noting that the vertical scale is in logarithm to the base 10). The former background value is that used in the data which have been ana-lyzed and the latter is an increased value to illustrate its sensitivity. Hence, when calibrating model parameters, little weight is attached to the very end of the uranine BTC. On the other hand, this observation also implies the need of measuring background concentration levels with a high degree of accuracy.
Use of Semi-infinite Only Model for
Analy-sis
In general, the tails of the BTC for uranine show more variability than do those for Rb and Cs. This reflects the distinct way the semi-infinite and finite populations respond to SWIW tracer migration. Generally, matrix porosity is much bigger for the finite population than for the semi-infinite population. Because matrix porosity is one of the components of the effec-tive diffusion coefficient, small matrix porosity corresponds to a weak diffu-sion coefficient. Thus, diffudiffu-sion is primarily controlled by the finite popula-tion, with a weak contribution from the semi-infinite population. In particu-lar, the finite population provides more initial opportunity for diffusion, but once it saturates, diffusion into the semi-infinite population becomes the dominant factor.
Figure 10. Field data of KFM01D section 431-432 m; (a) with uranine background correction of 0.019 mg/L corresponding to C/IM = 2.10-5 L-1; (b) with uranine background correction of 0.048 mg/L corresponding to
C/IM = 5.10-5 L-1.
(a)
Table 5. Inferred diffusion and sorption parameters for the semi-infinite population for Test KFM01D 431. Neither single-population model provides a good fit to the uranine BTC.
Case m Rb Kdp Cs Kkp Two-population model: u20v4mix, rb21v4mix, cs21v4mix 0.0056 1.5 5 Single-population model: u30v4mix, rb31av4mix, cs31cv4mix 0.0056 2 20 Single-population model: u32v4mix 0.020
A supplementary study is made to fit the KFM01D-431 data with a semi-infinite matrix only model. Figure 11 shows the fitted BTC, and Table 5 shows the corresponding diffusion properties. The curve labelled “u32 v4mix” uses the parameter value from Table 4 (m = 0.0056) and does an
adequate job of matching the late-time portion of the BTC tail, but signifi-cantly over-predicts peak height. The curve labelled “u30 v4mix” is ob-tained by adjusting the parameter to obtain a better fit to the peak height, which results in a poor fit to the BTC tail. Note that for non-sorbing uranine, neither single- population model successfully matches the entire uranine BTC, whereas for sorbing Rb and Cs, single-population models yield just as good a match as do two-population models (see Figure 8).
For all three SWIW tests considered, the Cs BTC show a linear tail with a slope (on a log-log plot) of -3/2, which is a characteristic of diffusion into a semi-infinite medium. It turns out that all the Cs BTC can be equally well matched using only a single population for diffusion and sorption (as shown in Figure 11 for KFM01D 431). Furthermore, that population can be either finite or semi-infinite. This is because Cs sorption is so large that even the finite population has a large capacity for uptaking Cs, and thus acts essen-tially semi-infinite.
The one Rb BTC that does not show a linear tail with a -3/2 slope is that for KFM01D 377. Taken alone, this tail suggests that just as in the uranine case, both finite and semi-infinite populations play a role in controlling the Rb BTC. However, the other two Rb BTC:s are quite similar to the Cs BTC and hence the inferred sorption coefficients for Rb are comparable to those of Cs, implying that Rb uptake is comparably large to that of Cs. We have limited our discussion of BTC behaviour within the framework of the complex frac-ture model, but there may be some other feafrac-tures impacting this BTC that have not yet been accounted for.
Figure 11. Model and field BTC for Test KFM01D, interval 431-432 m, using models with only a single semi-infinite population.
6. Concluding Remarks
Three representative SWIW tracer tests recently conducted by SKB have been analyzed with a complex fracture model employing two populations for diffusion and sorption, one population being the semi-infinite rock matrix and the other, finite blocks. The results show that by adjusting diffusion and sorption parameters of the model, a good match with field data is obtained for BTC of both conservative and non-conservative tracers simultaneously. For non-sorbing tracer uranine, both the finite and the semi-infinite popula-tions play a distinct role in controlling BTC. At early times (the tracer peak) the finite-block population is most important, but at later times (the tracer tail), the finite-block population becomes saturated and the semi-infinite population controls the BTC. In contrast, for sorbing tracers Rb and Cs, the finite population does not saturate so a single-population model can be used to match these BTC. Hence, to match the behaviour of both non-sorbing and sorbing tracers, two populations, one finite and the other semi-infinite, are required to capture all the features of the BTC.
The conclusion of this study using the three representative sets of SWIW data sets shows that the two-population complex fracture model may be use-ful to analyze SWIW tracer test data in general. One of the two populations should be the semi-infinite rock matrix and the other finite block that can saturate. The latter can be representing either rock blocks within the fracture, a fracture skin zone or stagnation zones.
Acknowledgements
The authors thank Joel Geier and Kenzi Karasaki for their reviews of this report, and are grateful to Joel Geier and Peter Andersson for providing in-sights into the field data. The second author has benefitted greatly through discussions with the members of the INSITE Core Group. This work was supported by the Swedish Radiation Safety Authority (SSM) and by the Ja-pan Atomic Energy Agency (JAEA) under the Bi-national Research Coop-eration Program between JAEA and the U.S. Department of Energy. The work was performed under the auspices of the U.S. Department of Energy through Contract No. DE-AC02-05CH11231.
Bibliography
Cvetkovic, V., H. Chen, and J.-O. Selroos, First TRUE Stage: Evaluation of tracer retention understanding experiments (first stage) at Äspö, Rep. ICR-00-01, Swedish Nuclear Fuel and Waste Management Co. (SKB), Stockholm, Sweden, 2000.
Deutsch, C.V. and A.G. Journel, GSLIB: Geostatistical software library and user’s guide, 2nd ed., Oxford Univ. Press, New York 1998.
Doughty, C. and M. Uchida, PA calculations for feature A with third-dimension structure based on tracer test calibration, Rep. IPR-04-33, Swedish Nuclear Fuel and Waste Management Co. (SKB), Stockholm, 2003.
Haggerty, R., M.H. Schroth, and J.D. Istok, Simplified method of “push-pull” test data analysis for determining in situ reaction rate coefficients. Ground Water 36(2), 314-324, 1998.
Mazurek, M., P. Bossart and J. Hermanson, Classification and characteriza-tion of water-conducting features at Äspö., Proc. Intern. Seminar First TRUE Stage, Äspö Hard Rock Laboratory, Sweden, September 9-11, 2000, pp. 203-208; published as Rep. TR-01-24, Swedish Nuclear Fuel and Waste Management Co. (SKB), Stockholm, Sweden, 2001. Thur, P., R. Nordqvist, and E. Gustafsson, Forsmark site investigation:
Groundwater flow measurements and SWIW tests in borehole KFM01D, Rep. P-07-52, Swedish Nuclear Fuel and Waste Management Co. (SKB), Stockholm, Sweden, 2007a.
Thur, P., R. Nordqvist, E. Gustafsson, Oskarshamn site investigation: Groundwater flow measurements and SWIW tests in borehole KLX11A, Rep. P-07-180, Swedish Nuclear Fuel and Waste Management Co. (SKB), Stockholm, Sweden, 2007b.
Tsang, Y.W. and C.F. Tsang, A particle-tracking method for advective transport in fractures with diffusion into finite matrix blocks, Water Re-sources Research, 37(3), 831-835, 2001.
Tsang, C.-F. and C. Doughty, A particle-tracking approach to simulating transport in a complex fracture, Water Resources Research, 39(7), 1174, doi:10.1029/2002WR001614, 2003.
Tsang, C.-F. and C. Doughty, Some insights from simulation of SWIW tests on a complex fracture, Rep. SKI INSITE TRD-07-06, Swedish Nuclear Power Inspectorate, Stockholm, Sweden, 2007; Rep. LBNL-63564, Law-rence Berkeley National Laboratory, Berkeley, Calif., 2007.
Tsang, C.-F. and C. Doughty, Some insights from simulation of single-well injection-withdrawal (SWIW) tracer tests on a complex fracture, to be submitted to Water Resources Research, 2009.
Tsang, C.-F., C. Doughty, and M. Uchida, Simple model representations of transport in a complex fracture and their effects on long-term predic-tions, Water Resources Research, 44, W08445,
Tsang, Y. W. Study of alternative tracer tests in characterizing transport in fractured rocks, Geophysical Research Letters, 22(11), 1421–1424, 1995.