Mälardalen University
This is an accepted version of a paper published in Cognitive Psychology. This paper has been peer-reviewed but does not include the final publisher proof-corrections or journal pagination.
Citation for the published paper: Eriksson, K., Simpson, B. (2011)
"Perceptions of unfairness in allocations between multiple recipients" Cognitive Psychology, 62(3): 225-244
URL: http://dx.doi.org/10.1016/j.cogpsych.2011.01.001
Access to the published version may require subscription.
Permanent link to this version:
http://urn.kb.se/resolve?urn=urn:nbn:se:mdh:diva-13330
Perceptions of Unfairness in Allocations between Multiple Recipients*
Kimmo Eriksson
Mälardalen University and Stockholm University Brent Simpson
University of South Carolina
Contact:
Kimmo Eriksson, School of Education, Culture and Communication, Mälardalen University, Box 883, SE-72123 Västerås, Sweden, and Centre for the Study of Cultural Evolution, Stockholm University, SE-106 91, Stockholm. email: kimmo.eriksson@mdh.se. Phone: +46 703767451. Fax: +46 21101330.
* Eriksson acknowledges support by the CULTAPTATION project (European Commission contract FP6-2004-NEST-PATH-043434) and the Swedish Research Council. Simpson acknowledges support from the National Science Foundation (grants SES-0551895 and SES-0647169). The authors are grateful to Johan Karlander and Kjell Törnblom for helpful advice.
Abstract
This paper introduces a new model to explain perceptions of unfairness in resource allocations between multiple recipients. The model yields several novel predictions, all confirmed in a series of new empirical tests. For instance, while much prior research focuses on the differences between the judge's share and others' shares, we argue that people also care about differences between others' shares. In particular, the presence of a single loser increases perceptions of unfairness. We also study individual variation in sensitivity to the single-loser dimension. Most centrally, we offer empirical support for the existence – indeed the prevalence – of ostraphobics, individuals with an acute sensitivity to being "ostracized" as a sole loser. We show that ostraphobics perceive unfairness more strongly than other types, are higher in need to belong and fear of negative evaluation, and are more prone to a heretofore unrecognized type of preference reversal with respect to fairness.
1. Introduction
Questions about perceptions of fairness in the allocation of resources engage behaviorally oriented scholars across disciplinary boundaries. Indeed, biologists have documented that even monkeys have a sense of fairness, in that they respond negatively to unequal rewards for equal efforts (Brosnan and de Waal 2003). Perceptions of fairness among humans is the basis for several well-known research programs, e.g., the sociological "factorial survey" method to measure views of fair pay (Alves and Rossi 1978; Jasso 2006), or the influential theory of "inequity aversion" in economics (Fehr and Schmidt 1999). Both these theories assume that perceived unfairness, just as exhibited in monkeys, is a monotonously increasing function of the difference between two compared rewards.
However, in allocations with multiple recipients there are many other issues to consider. Here we will study what factors are the most important determinants of perceptions of unfairness. We address situations in which (1) the size of the resource to be allocated is fixed and (2) the recipients are indistinguishable in terms of merit. The first of these assumptions is somewhat unusual in the fairness literature where the focus in both political
philosophy (Rawls 1999; Binmore 2005) and key empirical work (Frohlich, Oppenheimer and Eavey 1987;
Bazerman, Blount White and Loewenstein 1995; Hsee, Loewenstein, Blount, Bazerman 1999; Charness and Rabin 2002) has been how people strike a balance between equality and efficiency. Thus, rather than the amount of available resources being fixed, existing research typically assumes it depends on the system that determines the allocation. Our interest instead lies in the concrete situation in which one or more people decide how to allocate a given resource among members of a group. Our second assumption, on the other hand, is common to previous models, several of which are discussed in detail below (e.g., Varian 1976; Fehr and Schmidt 1999). This
assumption provides an intuitive starting point: as explained later, absence of distinction between recipients is the natural baseline from which future extensions can be developed that take into account how fairness perceptions might depend on differences between recipients in terms of needs, tastes, beliefs, endowments, efforts or rights
(Bar-Hillel and Yaari 1993; Deutsch 1985; Törnblom 1992; Mitchell et al. 2003; Conlon, Porter, and McLean Parks 2004; DeVoe and Iyengar 2010).
Interestingly, although several existing models make implicit assumptions about what kinds of differences are more important in perceptions of unfairness (Varian 1976; Fehr and Schmidt 1999; Charness and Rabin 2002), no prior work has explicitly examined this very basic question. With previous models as a starting point, we will address which differences in rewards are most important for perceived unfairness. This endeavor will turn up a range of previously unrecognized phenomena.
Our agenda can very briefly be summarized as follows. First, we will consider the role of the judge, i.e., the person who makes the fairness judgment. The judge may be either an outside observer of the allocation or one of the recipients. This distinction has important consequences for fairness judgments, both in terms of main effects and via its interactions with other key variables. Specifically, both self-serving and egocentric biases come into play only when the judge is also one of the recipients and we shall see that the balance between these two types of bias will determine how perceived unfairness depends on the size of the judge's share relative others.
The most important contribution of this paper lies in our conceptualization and investigation of how the size of the smallest share – the "loser" share – plays a key role in perceptions of unfairness. First, we propose that differences between the smallest share and other shares are perceived as more unfair than other inequalities. Second, we propose that perceptions are influenced by a single-loser effect, such that some judges tend to hold a specific aversion to finding one recipient much worse off than everyone else. Third, such a single-loser aversion may be particularly pronounced when it is the judge himself who is the single loser; we introduce the concept ostraphobia to denote individuals who exhibit a dispositional hypersensitivity to being ostracized in a resource allocation. We show how this hypersensitivity is related to other well-known dispositions, including differences in "need to belong" and "fear of negative evaluation," and how it manifests in a heretofore unrecognized type of preference reversal.
In the sections to follow, we address each of the above aspects in relation to prior models. We begin with the case where the judge is a disinterested observer of the allocation. For this case we first present a model of fairness
perceptions and then discuss the potential for a single-loser effect. We then extend our model to the case when the judge is involved in the allocation as a recipient. For this case we discuss the effects of the judge’s position in the allocation. Finally, we introduce the concept of ostraphobia, relate it to previously studied variables, and outline how it impacts fairness perceptions. We derive a number of predictions that we test in a series of studies where participants from various countries make fairness judgments. We conclude with a discussion of implications, limitations and suggestions for future work.
1.1 The Observer-Judge Model
Here we will describe a new mathematical model, and its relation to prior models. The model predicts the unfairness U perceived by a judge who observes (but is not involved in) some resource X being allocated between multiple recipients. First we introduce some notation. We will use the symbol D to refer to an allocation, and represent allocations via a bracketed list of shares in increasing order: D=[x1 :x2 :] where x1 ≤x2 ≤and the sum of shares is x X
i
i =
∑
. We will always assume that the source of perceptions of unfairness is differences between shares. Hence the relevant parameters are the differences between shares, normalized by their proportion to the total resource:∆i,j(D)=(
xj −xi)
/X . For example, for the allocation D=[1:3:6] of the total resource X=10 the normalized differences are ∆1,2(D) =0.2, ∆1,3(D)=0.5 and ∆2,3(D)=0.3.We propose that a judge's fairness perceptions are based primarily on two factors: a general attention to all pairwise differences, and more focused attention on those differences that involve the worst-off recipient.
Expressed as a mathematical formula this model is as follows:
(Observer-Judge Model) ( ) ( ) ( ) 1 , 1 , D B D A D U j j i j i j i
∑
∑∑
> > ∆ + ∆ = .For example, for the allocation D=[1:3:6] we
obtainU(D)= A(∆1,2 +∆1,3 +∆2,3)+B(∆1,2 +∆1,3)=1.0A+0.7B. In this formula A and B are nonnegative scaling constants that indicate the weighting between general attention to pairwise differences and special attention to differences involving the worst-off recipient, respectively. We now motivate the two terms.
The rationale for the first term is that, given that there are no distinctions in merit between recipients, all differences in outcome between them are unfair. The notion of simply summing all differences comes from the social welfare function of Varian (1976, p. 257). Varian defines fairness as the absence of envy and models the social welfare from an allocation as a (weighted) sum of individuals' utilities minus their envy; an individual’s envy is given as the sum of all differences between the outcome for that individual and the outcome of better-off
individuals. Although fairness perceptions are not explicitly mentioned by Varian, we can equate them with his notion of envy.
The second term states that the relative outcome of the worst-off recipient, the "loser", plays a special role in perceptions of unfairness. This basic contention is most strongly associated with Rawls’ (1999) theory of justice. In an empirical test of Rawls's theory, Frohlich and Oppenheimer (1992) found that most participants preferred
income distributions with the highest total payoff given a floor constraint; that is, a key consideration was to minimize the distance between the loser and others. Similarly, the size of the loser's share is a key component of Charness and Rabin’s (2002) social welfare function. For ease of comparison, we can express their model in terms of differences between shares instead of absolute share sizes. Thus, the social disutility stemming from unfairness is proportional to the sum of all differences between the payoffs to the worst-off recipient and all other recipients. Equating this disutility with the unfairness perceived by a disinterested observer gives the second term of our observer-judge model.
To summarize, the model we propose takes into account both the general envy-based sense of unfairness of Varian (197699) and the loser-based sense of unfairness of Rawls (1999) and Charness and Rabin (2002).
1.2 Single Losers vs. Single Winners and the Maximally Unfair Allocation
The observer-judge model assumes that judges pay special attention to the outcome of the loser recipient (Rawls 1999; Frohlich and Oppenheimer 1992; Charness and Rabin 2002). Here we point to another important condition under which observers devote special attention to the loser. We propose that the unfairness of the loser's bad outcome may be perceived by one category of judges as especially bad if the loser is the only recipient to suffer
a bad outcome. In other words, we claim that some people are particularly sensitive to the presence of a single loser. We dub this sensitivity single-loser aversion and its effect on fairness judgments is the single-loser effect.
To present our arguments on the single-loser effect, we will introduce three special allocations. First, the extreme single-winner allocation is characterized by one recipient receiving the entire resource and the others being left out. For simplicity, assume that there are three recipients altogether, in which case the extreme single-winner allocation of a resource X takes the following form:
(Extreme Single-Winner) [0 : 0 : X]
The extreme single-winner allocation has the greatest possible inequality between winners and losers. On this basis, Perry (2005) claimed that it is maximally unfair, i.e., the most unfair allocation possible. With the exception of Perry's paper, the question of what is the maximally unfair allocation seems to have been completely ignored in prior fairness research. We shall now discuss why it is not necessarily so that judges will find the extreme single-winner allocation as maximally unfair. Consider the extreme single-loser allocation characterized by just one recipient being left out while the others share the resource equally:
(Extreme Single-Loser) [0 : X/2 : X/2]
We can obtain the extreme single-loser allocation from the extreme single-winner allocation by having the single winner share his resource equally with one of the losers. Therefore, total inequality in terms of pairwise differences is lower, and the remaining loser is not any worse off than before. Hence the observer-judge model will rate the extreme single-loser allocation thus obtained as less unfair than the extreme single-winner allocation. Based on the factors discussed thus far, we should therefore expect individuals to prefer the extreme single-loser allocation. However, this preference may be reversed for a judge who holds an additional single-loser aversion, by which we mean a specific aversion to finding one recipient being much worse off than everyone else. The existence of such an aversion is plausible in light of the “identified victim effect” (Small and Loewenstein 2003; Kogut and Ritov 2005) where one individual in a bad state evokes a disproportionately high emotional response.
As noted by an anonymous reviewer, by symmetry it is also possible for a judge to hold an aversion to single winners. In order to outline what such an aversion would entail, we introduce the moderate single-winner
allocation. We obtain the moderate single-winner allocation by having a winner share his resource equally with a loser giving:
(Moderate Single-Winner) [X/4 : X/4 : X/2]
Again this redistribution of resources from a winner to the loser decreases total inequality. Hence the observer-judge model will rate the moderate single-winner allocation as less unfair than the extreme single-loser allocation, and reversing this preference therefore requires an additional single-winner aversion.
Winners are not victims, however. Consistent with the identified victim theory, we predict single-loser aversion to be more common than single-winner aversion.
1.3 The Recipient-Judge Model
Next we consider the case of a recipient-judge, i.e., a judge involved as one of multiple recipients. To indicate that the judge receives the Jth smallest share of an allocation D, we use the notation DJ.
First, we propose that a recipient-judge’s fairness perceptions will be impacted by the same factors discussed above for the disinterested observer-judge. Therefore, we include the two terms of the observer-judge model in the recipient-judge model. In addition, we assume that the recipient-judge will pay special attention to how his own share stands in relation to others. Such special attention can reflect either a self-serving bias (Messick and Sentis 1979; Babcock and Loewenstein 1997) or an egocentric bias. An egocentric bias entails greater attention to matters in which one is directly involved, which may or may not lead to self-serving judgments (Zhaeng and Epley 2009). If a judge's special attention to his own share is driven by a self-serving bias, his fairness perceptions will stem from envy of those who are better off, as in Varian's (1976) model. An egocentric judge, in contrast, would focus on differences in which he is directly involved, regardless of whether he is advantaged by the difference. Assuming that both self-serving and egocentric biases are present, we expect special attention to be given to all differences that involve the judge, but relatively more attention to those differences that create envy. The model can thus be expressed as follows: (Recipient-Judge Model) ( ) ( ) ( ) , ( ) , ( ) 1 , 1 , D b D D D a D U J j j J J j j J j j i j i j i J
∑∑
∑
∑
∑
< > > > ∆ + ∆ + ∆ + ∆ = α β ,with a, b, α and β nonnegative scaling constants satisfying β ≤ α.
This recipient-judge model generalizes several models of unfairness in the literature. As noted earlier, the first two terms are the Varian and Charness-Rabin terms from our observer-judge model. The third term is the sum of differences with respect to those who are better off than the judge. This term corresponds to the envy of an individual recipient in Varian's social welfare model. The fourth term is the sum of differences with respect to those who are worse off than the judge. When coupled with the assumption β ≤ α (or, equivalently, β/α ≤1) the third and fourth terms together correspond directly to the inequity aversion model of Fehr and Schmidt (1999). More specifically, their model incorporated fairness concerns into the utility function itself, such that the utility to an individual of obtaining a certain payoff is decreased by a weighted sum of absolute differences between own and others' payoffs. By equating perceived unfairness with this assumed utility decrease, we obtain the third and fourth terms of our recipient-judge model.
For a concrete example of the recipient-judge model, consider again the allocation D=[1:3:6]. From our previous example, we know that the first two terms must be 1.0a+0.7b as they are the same as in the observer-judge model and independent of the position of the observer-judge. The remaining two terms depend on the position of the judge as follows:U(D1)−(1.0a+0.7b)=α
(
∆1,2 +∆1,3)
=0.7α, β α β α 0.2 0.3 ) 7 . 0 0 . 1 ( ) (D2 − a+ b = ∆2,3 + ∆1,2 = + U , andU(D3)−(1.0a+0.7b)= β(
∆1,3 +∆2,3)
=0.8β . To summarize, our recipient-judge model generalizes features of three previous models. It assumes that unfairness perceptions stem from a weighted sum of overall inequalities (Varian 1976), inequalities involving the loser (Charness and Rabin 2002), and inequalities involving the judge himself, either as relatively worse off or better off (Fehr and Schmidt 1999). Charness and Rabin (2002) and Fehr and Schmidt (1999) each offer empirical data in support of their respective models. But the terms of the models have not been considered in an integrated model, or empirically. We propose that each of these prior models contributes complementary insights about unfairness perceptions. The elaborated model outlined above was developed to capture these insights.In our recipient-judge model, the ratio between parameters β and α defines the balance between self-serving and egocentric biases. If this ratio is 0 (i.e., if β =0) then bias is purely self-serving. If, on the other hand, the ratio is 1 (i.e., if β = α) bias is purely egocentric. The balance between the two kinds of bias has implications for how the perceived unfairness of a given allocation varies with the position of the judge. For convenience we will henceforth use the terms loser and winner for the positions of being worst-off and best-off, respectively. In contrast to what a pure self-serving bias would predict, we will show that the winner does not necessarily perceive the least
unfairness.
First consider a purely self-serving judge. Self-serving bias leads to decreased perceptions of unfairness when the judge is better positioned, culminating in minimal unfairness when the judge is in a winner position. Now instead consider a purely egocentric judge. Egocentric bias leads to increased perceptions of unfairness as
differences to others increase, culminating in maximal unfairness when the judge is in an extreme position, either winner or loser.
Thus, whether the least unfairness is perceived in the winner position depends on the balance between self-serving and egocentric bias. For example, for allocation D=[1:3:6] it follows from our previous formulas that whenever the model parameters satisfy β/α > 0.4 we have U(D3)>U(D2), i.e., a judge in our model will perceive greater unfairness in the winner position than in the middle position.
1.5 Ostraphobic Fairness Perceptions, Fear of Negative Evaluation, and Preference Reversal
As discussed earlier, when everyone except a single loser shares the same benefits, the single loser can be regarded as ostracized from the group. Prior work shows strong differences in aversion to ostracism (Baumeister and Leary 1995). Social psychologists have developed a number of scales that tap into ostracism, and have demonstrated implications of individual differences in ostracism (Watson and Friend 1969; Leary 1983; Kim and Markman 2006; Leary et al. 2007). We propose that differences in aversion to ostracism may be expressed as differences in dispositional hypersensitivity to being ostracized in the allocation of resources. In other words, we expect some individuals (“ostraphobics”) to be particularly sensitive to the unfairness of being a single loser in an
allocation. To operationalize ostraphobia, we measure whether a judge perceives maximal unfairness, among all possible allocations, as a loser in an extreme single-loser allocation.
Table 1 about here
As shown in Table 1, taking the judge's position as either winner or loser into account, we obtain 2x2 possibilities for the maximally unfair outcome. We have coined terms for these four attitudes towards unfair allocations. A normally envious individual thinks the greatest unfairness occurs when someone else is a single winner. This category is most consistent with the models presented earlier. In contrast, an ostraphobic individual thinks the most unfair outcome is to be the single loser. The benevolent possibilities are individuals who perceive maximal unfairness as single winner (monophobic) or when someone else is the single loser (allosostraphobic).1
We expect ostraphobia to be linked to stronger emotional reactions to adverse outcomes, as measured by need to belong (NTB; Leary et al. 2007) and fear of negative evaluation (FNE; Leary 1983) scales. Note that while we expect ostraphobics to exhibit especially strong reactions to single-loser allocations, we also assess whether they exhibit greater sensitivity to unfairness in general.
In one experiment outlined below we will classify participants according to this complete scheme; otherwise, we will simply categorize participants as ostraphobic or not.
Our conceptualization of ostraphobia leads us to expect a previously unexplored type of preference reversal (cf. Bazerman, Blount White, Loewenstein 1995; Hsee et al. 1999). To illustrate, compare the allocations E (for equal) and U (for unequal) defined by:
E = [A gets 500 : B gets 500] and U = [A gets 1000 : B gets 0].
1
It is logically possible to be more averse to being a winner than being a loser. This phenomenon has been documented in the “equity sensitivity” literature, where individuals classified as benevolents prefer their outcome/input ratio to be less than that of a comparison other (Huseman, Hatfield and Miles 1987; King, Miles and Day 1993; Blakely, Andrews and Moorman 2005). In our recipient-judge model this
We expect that most individuals, including ostraphobics, will perceive allocation E as fairer than U. But now add the judge as a zero recipient to both allocations, so that the choice is instead between:
E' = [A gets 500 : B gets 500 : judge gets 0] and U' = [A gets 1000 : B gets 0 : judge gets 0].
The difference between the two choice situations is very slight indeed; either both alternatives have the judge not involved at all (and hence getting nothing), or both alternatives have the judge involved but still getting nothing. Thus, a change in perception of what is the fairer outcome from E to U' constitutes a preference reversal. Given that allocations E' and U' are instances of the extreme single-loser and extreme single-winner outcomes, this preference reversal is precisely what we would expect from ostraphobics.
1. 6 Models, Predictions, and Overview of Studies
The ideas developed in previous sections can be summarized as a set of key predictions.
Prediction 1 – "Observer-Judge Model". A judge who is not involved as a recipient in an allocation will perceive unfairness both from attending to pairwise differences in general and from paying special attention to differences involving the loser. See section 1.1 for details.
Prediction 2 – "Single-Loser Effect". Judges will exhibit stronger single-loser aversion than single-winner aversion. See section 1.2 for details.
Prediction 3a – "Recipient-Judge Model". In addition to the pairwise differences an uninvolved judge takes into account (Prediction 1), a judge who is involved as a recipient will pay special attention to differences between himself and others. Because of a combination of self-serving and egocentric biases, differences to better-off recipients will weigh heavier than differences to worse-better-off recipients. Given sufficiently strong egocentric bias, the least unfairness will be perceived not by the winner, but by a recipient in a less extreme position. See sections 1.3 and 1.4 for details.
Prediction 3b – "Recipient-Judge Model for Ostraphobics". Ostraphobic individuals will be more sensitive to unfairness in general, and particularly sensitive to being in a single-loser position. See section 1.5.
Prediction 4 – "Ostraphobic Preference Reversal". Starting from an allocation between two others, inclusion of an ostraphobic judge as a loser in the allocation will elicit a preference reversal, from a preference for equality between the two others to a preference for inequality between them. See section 1.5.
Prediction 5 – "Ostraphobia and Need to Belong/Fear of Negative Evaluation". Ostraphobic individuals will tend to score higher on measures of need to belong and fear of negative evaluation. See section 1.5.
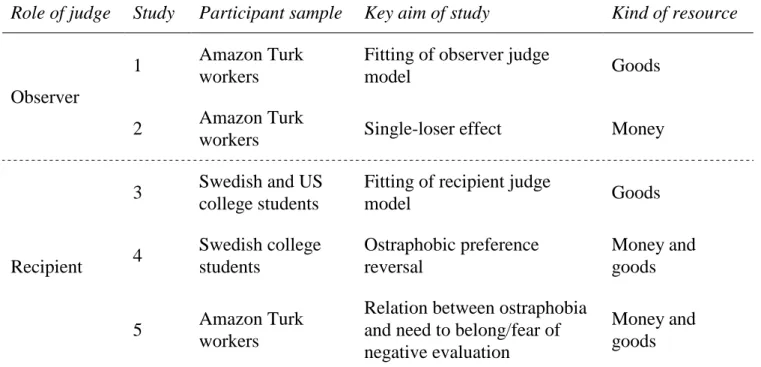
Table 2 about here
We will now report five experimental studies of fairness judgments to test the forgoing predictions. As shown in the outline of the studies given in Table 2, the first two deal with the case of an observer-judge. The remaining studies deal with a recipient-judge.
Empirical research on fairness of allocations typically employs one of two research methodologies: vignettes in which respondents judge the unfairness of allocations (cf. Alves and Rossi 1978; Rossi 1979; Bar-Hillel and Yaari 1993; Conlon, Porter, and McLean Parks 2004; Jasso 2006; DeVoe and Iyengar 2010) or economic
experiments where participants actually divide resources, either by individual decisions in dictator- and ultimatum-games (cf. Kagel and Wolfe 2001; Andreoni, Brown and Vesterlund 2002; Charness and Rabin 2002; Jong, Tuyls and Verbeeck 2008), or by collective decisions on division principles (Frohlich, Oppenheimer and Eavey 1987; Frohlich and Oppenheimer 1992). In these economic experiments, fairness is of course only one of several factors that influence decisions (with maximizing one’s own outcomes, and reciprocity as other very important factors). Thus, the vignette method allows the most direct measure of unfairness perceptions. Although future research might extend the experiments outlined below to address fairness judgments of actual allocations, our studies use hypothetical allocations for a number of reasons. First, the vignette method of fairness judgments is established in the field (e.g., DeVoe and Iyengar 2010). Second, the fairness literature indicates that hypothetical and real
scenarios do not give qualitatively different results (e.g., Bazerman, Blount White, Loewenstein 1995; Konow 2005). Finally, at a practical level, hypothetical allocations allow for more data and can therefore increase statistical power.
Formaterat: Engelska (USA) Formaterat: Engelska (USA)
Previous research shows that there are certain conditions under which resource type influences fairness judgments (Törnblom 1992). In particular, several recent studies show that allocation inequalities based on
individual differences in performance are judged as fairer when money versus goods are allocated (Conlon, Porter, and McLean Parks 2004; DeVoe and Iyengar 2010). In our studies the resource to be allocated is sometimes goods (precious vases) and sometimes money. While we might observe some variation by resource type, we expect the same basic effects for allocations involving goods and money. Studying both resource types allows a demonstration of the robustness of our model with respect to the resource dimension.
Two experiments were conducted with University students in Sweden and the US. For the remaining three experiments we employed Amazon’s Mechanical Turk, an online labor market where requesters can list tasks with associated monetary rewards. Individual workers choose tasks to complete, for which they are then paid. Workers can be located anywhere, but the US and India dominate (Eriksson and Simpson 2010). Because of the large
number of individuals available to work on tasks and the low compensation levels (we paid 15 cents per task which is above average), the Amazon Mechanical Turk offers an attractive participant pool for behavioral research. As others have noted (Mason & Watts, 2009; Paolacci, Chandler, & Ipeirotis, 2010; Buhrmester et al. in press), Mechanical Turk provides a convenient and reliable data source for conducting certain types of behavioral experiments.
2. Experiment 1
The aim of this experiment was to assess the predictive power of the various models of unfairness perceptions of an observer-judge (see Prediction 1). We used the Amazon Mechanical Turk to collect data on fairness judgments of different allocations of goods between four recipients.
2.1 Method and Procedures
97 participants (59 females; median age 30 years) were recruited from the pool of workers of the Amazon Mechanical Turk to complete a vignette on fairness of allocations. Participants came predominantly from the US
(61%) and India (30%) and had mixed educational backgrounds (15% high school degrees, 12% current students, 6% associate degrees, 39% bachelors degrees, 28% graduate degrees). Following introductory instructions, participants read the following text:
"Imagine that your elderly neighbor, Mrs. Johnson, has just died. She had no children but there were four other neighbors (here called A, B, C and D) who used to take turns caring for her. Mrs. Johnson used to say that these four would get to share the inheritance. Mrs. Johnson’s attorney now says that the only things of value that Mrs. Johnson owned are 36 identical precious vases. For each of seven different distributions of vases we will now ask you to imagine that Mrs. Johnson has stated this distribution in her will and then tell us how you would feel about that in terms of fairness/unfairness on a scale from 0 to 100. The extreme rating of 0 would mean 'the fairest distribution possible'; at the other extreme, 100 would mean 'the most unfair distribution possible'.”
The allocations, presented in random order, were systematically chosen to cover a wide range of cases as follows. Three allocations of low inequality (difference between largest and smallest share is 8) with shares of two sizes and the number of shares of the smallest size varying between one and three: [3:11:11:11], [5:5:13:13] and [7:7:7:15]; three allocations of larger inequality (difference 12) with shares of three or four sizes and the number of shares of the smallest size between one and two: [1:9:13:13], [5:5:9:17], [3:7:11:15]; finally, one allocation with very large inequality: [3:3:3:27].
2.2 Analysis
There are 7 allocations to be judged by each of 97 judges, giving 7×97 datapoints. We employ a multi-level model to account for non-independence of responses and individual idiosyncrasies of judges in their levels of unfairness judgments. Thus our observer-judge model takes the following form as a statistical model for each datapoint, i.e., each combination of an allocation (D) and a judge (r):
r r D j j i j i j i r D A D B D e e U =
∑∑
∆ +∑
∆ + + > > 1 , , 1 , ( ) ( ) ) ( ,Here eD,ris the error term for this particular rating, and e is the judge-specific random error term. By dropping the r first or second term from the above model we obtain the Charness-Rabin and Varian models, respectively. We compare models using the Akaike information criterion (AIC); the model with the lower AIC value is preferred (Akaike 1978). Following Wright and London (2009), we compute a pseudo-R2 of a multi-level model as follows. Let V be the variance in the estimated error terms of the model, and let V' be the corresponding variance for the baseline model obtained by stripping away the predictor terms. Then (V'-V)/V' is a measure of the proportion of variance explained by the predictor terms.
2.3 Results
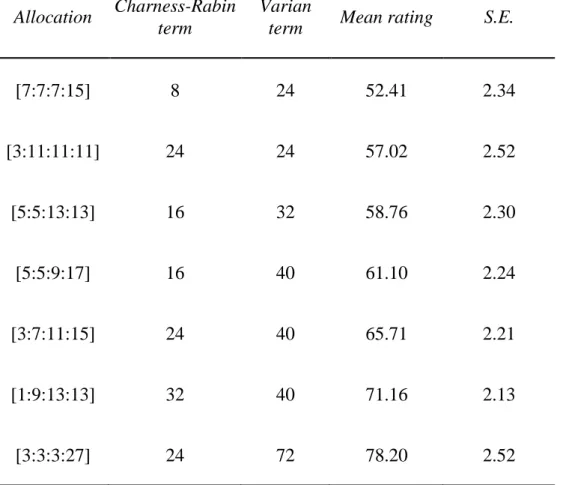
Table 3 about here
Table 3 shows the mean ratings for each of the seven allocations, varying from 52.4 for the fairest allocation to 78.2 for the most unfair one. For each allocation, Table 3 also shows the values of the Charness-Rabin term (i.e., the sum of the differences between the smallest share and all other shares) and the Varian term (i.e., the sum of all pairwise differences). As can be seen in the table, allocations with a higher value of the Varian term always
received a higher mean unfairness rating. Further, when two allocations have the same value of the Varian term the one with higher value of the Charness-Rabin term was always judged as more unfair.
Maximum likelihood fitting the model gives parameter estimates (standard errors) A = 17.6 (1.3) and B = 24.0 (2.8); both values are significantly larger than zero (p<.0001), and the model explains 68% of the baseline variance, compared to 53% and 50% for the simple Varian model and simple Charness-Rabin model, respectively. According to AIC the combined model is preferred to both simpler models. Separate analyses of the US and Indian data give the same qualitative results, with statistically insignificant or marginally significant differences in
parameter estimates (A = 16.8 in US data, 20.5 in Indian data, p=.2; B = 28.4 in US data, 17.1 in Indian data, p=.07).
Experiment 1 addressed unfairness perceptions in the observer-judge case, testing Prediction 1 on a selected set of allocations. In accordance with this prediction, we found that perceived unfairness stems both from pairwise differences in general and from differences involving the loser in particular. Thus, both the Varian model and the Charness-Rabin model contributed independent insights, but both missed a key determinant of unfairness
perceptions. The combined model was preferred to both simpler models. Although we observed a marginally significant tendency for US participants to pay greater relative attention to the loser outcome than did the Indian participants, participants from both countries tended to factor both general pairwise inequalities and the loser outcome into their fairness judgments. This provides cross-cultural support for Prediction 1.
3. Experiment 2
The aim of this experiment was to test Prediction 2 by measuring single-loser aversion and single-winner aversion among observer judges. We collected fairness judgments of various allocations of money between three recipients using the Amazon Mechanical Turk.
3.1 Method and Procedures
178 participants (93 females; median age 30 years) were recruited from the pool of workers of the Amazon Mechanical Turk to complete a vignette on fairness of allocations. As in Experiment 1, participants came
predominantly from US (53%) and India (42%) and had a similar mix of educational backgrounds. Participants read the following text:
"Imagine that three persons (Adam, Bert and Cal) help someone move a heavy box of precious vases. They are not equally strong, of course, but all three are needed to carry the box. The owner then rewards them
individually, distributing a total sum of $120. Please rate the sense of fairness you would perceive in observing this situation. Rate fairness on a scale from 0 = greatest possible fairness to 100 = greatest possible unfairness."
Fairness ratings were then collected for each of five allocations. Three of these are needed to test our hypotheses: the extreme single-loser allocation [0:60:60], the extreme single-winner allocation [0:0:120], and the
moderate single-winner allocation [30:30:60]. As a control we also included the perfectly equal allocation [40:40:40] and what we might call a moderate single-loser allocation [20:50:50]. We will henceforth refer to the ratings of these allocations as parallel ratings. We then presented participants with a second scenario:
"Now imagine that three persons (Danielle, Elizabeth and Fiona) work a full day at helping someone set up a room for a large party: setting up chairs, tables, decorations, etc. They are not equally strong, of course, but all three are needed to do the work. The person responsible for the party then rewards them individually, distributing a total sum of $240. Please compare the following allocations with respect to fairness."
Three pairs of allocations were then presented (see Table 4). For each pair, participants indicated which allocation they found fairer, or if they were indifferent. We will henceforth refer to these data as direct
comparisons.
3.2 Analysis
Recall that, according to Prediction 1, judges will attend to the sum of all pairwise differences in an
allocation when making fairness judgments, and therefore – unless they have a specific aversion to single losers – ought to rate the extreme single-loser allocation as less unfair than the extreme single-winner allocation. Thus, we first fit the observer-judge model to our data to show that Prediction 1 holds also in this dataset. We then examine the prevalence of single-loser aversion and single-winner aversion, as discussed in section 1.2. The design of the questionnaire allows us to examine such preferences in two different kinds of data: parallel ratings and direct comparisons. For both kinds of data we use the McNemar test to examine the prevalence of single-loser aversion over single-winner aversion (Prediction 2).
3.3. Results
As expected, the large majority of the respondents gave the perfectly egalitarian [40:40:40] allocation ratings of zero or nearly zero, representing "greatest possible fairness." However, 14 participants (7.8%) gave the perfectly equal allocation a rating of 100 or almost 100, strongly suggesting a misunderstanding of the response scale. (This confusion likely resulted from a slight change in the phrasing of the task, compared to Experiment 1. In the former
study, we asked for a rating of "fairness/unfairness;" in this study, we only asked about "fairness." We fix this issue in subsequent studies). These 14 participants were removed from further analysis. Table 4 shows the remaining 164 participants’ mean ratings for the five allocations and mean preferences for the three comparison tasks.
Table 4 about here
First, note in Table 4 that relative levels of mean unfairness in the parallel ratings task are perfectly consistent with the preferences in the corresponding direct comparison tasks (where dollar amounts are just doubled). Second, note that the unfairness ratings are in line with the observer-judge model that we tested in Experiment 1. Indeed, fitting the same model to this dataset again results in positive parameter estimates, A = 6.99 (S.E. = 2.65,
t(648)=2.64, p<.01) and B = 82.04 (S.E. = 4.21, t(648)=19.47, p<.0001), with 85% of the baseline variance explained, and again the model is preferred to simpler models according to AIC. This lends further support to Prediction 1.
We now analyze aversion to the presence of a single loser or a single winner in each of the two settings, by comparing preferences for various allocations as described in section 1.2. In the parallel ratings task, 57.9% exhibited single-loser aversion compared to just 25.0% for single-winner aversion (p < .001, McNemar). In the direct comparison task, 32.3% exhibited single-loser aversion compared to just 17.7% for single-winner aversion (p = .001, McNemar). Separate analyses of the US and Indian data give the same qualitative results with frequencies of single-loser aversion vs. single-winner aversion as follows: 67% vs. 33% (US, parallel ratings), 35% vs. 19% (US, direct comparisons), 53% vs. 25% (India, parallel ratings). 28% vs. 20% (India, parallel ratings).
3.4 Discussion
Results support Prediction 2. Specifically, we found that substantial proportions of participants (30-60%) exhibited loser aversion both in direct comparison between the extreme loser and extreme winner allocations and in parallel ratings. As predicted, loser aversion was much more common than single-winner aversion.
Although model parameter estimates differed considerably between Experiments 1 and 2, the basic finding that judges attend both to pairwise differences in general and the outcome of the loser in particular (Prediction 1) proved robust to change of both number of recipients (four in Experiment 1 vs. three in Experiment 2) and the type of resource (goods in Experiment 1 vs. money in Experiment 2).
4. Experiment 3
In Experiment 3 we turn our focus to recipient-judges. We directly measure where participants fall in the typology of Table 1 (normally envious, monophobic, ostraphobic, or allosostraphobic). To obtain data for model fitting we use the same set of allocations of goods as in Experiment 1, with additional information on the judge's position in the allocation. Study 3 participants must process more information than those in prior studies, namely the judge’s own position in the allocations. Thus, to avoid fatigue, each participant judged only a subset of three allocations from the full set of allocations.
4.1 Method and Procedures
A total of 183 participants (46 females, median age 21 years) were recruited in Sweden and the US. 118 Swedish respondents were recruited from a course in computer science, and 65 American students were recruited from an introductory sociology course, comprised mostly of non-majors. Participants in both samples completed the vignette prior to a lecture on an unrelated topic. As in Experiment 1, the vignette measured perceived fairness of a scenario where the inheritance – 36 identical precious vases – from an elderly neighbor is shared between four neighbors (including the respondent) who all used to care for her but never met. Participants were asked which allocation of 36 vases would be fairest and which would be most unfair; they were then asked to rate the unfairness of three given allocations on the usual scale from 0 to 100.
Each participant was randomly assigned one of eight versions of the questionnaire. Versions differed only in which three allocations were presented for judgment. In total, we collected data on a total of 18 combinations of an allocation and judge’s position (see Table 5).
4.2 Analysis
Recall the schema outlined in Table 1 about which allocation is the most unfair (normally envious, monophobic, ostraphobic, and allosostraphobic). With 36 vases and four recipients, the schema yields the
following most unfair allocations: [0:0:0:36], with judge's share either 0 (normally envious) or 36 (monophobic), and [0:12:12:12], with judge's share either 0 (ostraphobic) or 12 (allosostraphobic). Responses to the question about the most unfair allocation of 36 vases were accordingly classified as normally envious, monophobic, ostraphobic or allosostraphobic if they differed by no more than 3 in any component from any of these ideal allocations.
Each of 183 participants was asked to judge a subset of three allocations. 25 judgments were blank, giving 3×183–25 = 524 usable datapoints. Following the method used in Experiment 1, we treat the recipient-judge model as a multi-level statistical model by including both rating-specific and judge-specific random error terms for each datapoint, i.e., each combination of an allocation (DJ) and a judge (r):
r r D J j j J J j j J j j i j i j i J r D a D b D D D e e U =
∑∑
∆ +∑
∆ +∑
∆ +∑
∆ + J + < > > > 1 , , , , 1 , ( ) ( ) ( ) ( ) ) ( α β .By dropping the first two terms from the above model we obtain the Fehr-Schmidt model; also dropping the fourth term gives the Varian model. Similarly, dropping the first, third and fourth term yields the Charness-Rabin model. Finally, to account for the predicted effects of ostraphobia we extend the above model with two additional terms:
) ( ) ( 'I , D I I 1 1,2 D a Os J i j i j i Os ∆ + × = ×∆ >
∑∑
γ ,where IOs and IJ=1 are indicator variables of whether the judge is ostraphobic and in the loser position, respectively,
and a' and γ are coefficients to be estimated. The first of these coefficients measures the extent to which
ostraphobes are extra sensitive to pairwise differences in general. The second coefficient measures ostraphobes’ acute sensitivity to being single losers.
168 out of 183 participants gave responses to the question about the most unfair allocation that could be classified as either normally envious (72), monophobic (31), ostraphobic (63), or allosostraphobic (2). Thus, 34.4% of all participants were classified as ostraphobic. For the following analysis, the remaining 63.6% of the
participants were all classified as non-ostraphobic.
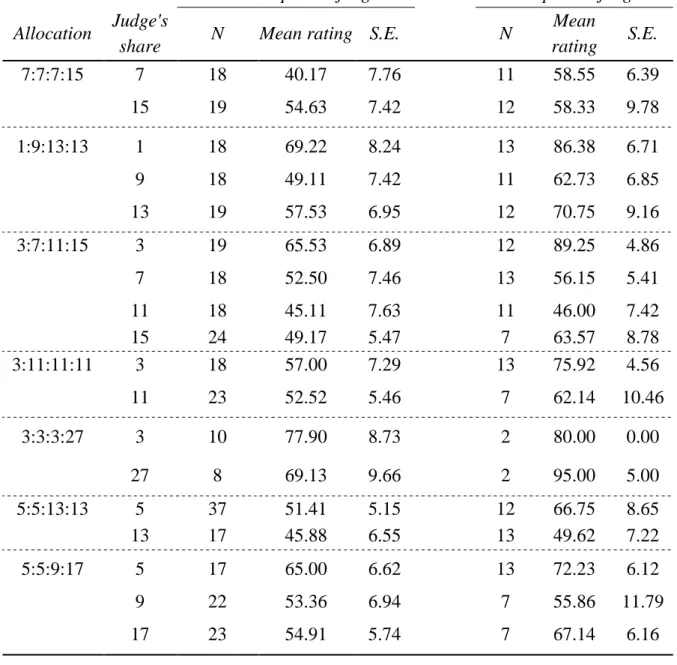
Table 5 about here
A total of 524 fairness ratings were collected. Table 5 shows the mean ratings of non-ostraphobic and ostraphobic participants for each of the eighteen combinations of an allocation and a judge position. Two features of the table are noteworthy. First, for each allocation and every position of the judge, ostraphobes perceive higher unfairness than non-ostraphobes. Second, for each allocation with more than two values the least unfairness is always perceived by judges in a position between loser and winner. As discussed earlier, this implies that the egocentric bias in fairness judgments is relatively large compared to a self-serving bias (Prediction 3a).
Maximum likelihood fitting our recipient-judge model gives parameter estimates (standard errors) a = 20.1 (4.2), b = 23.5 (5.1), α = 39.9 (5.7), and β = 15.6 (4.3); all values are significantly larger than zero (p<.001). The model explains 78% of the baseline variance and is preferable to any simpler model according to AIC. Separate analyses of the US and Swedish data yield qualitatively similar results, with only insignificant differences in parameter estimates (all p>.1).
Finally, we extend the recipient-judge model with the two ostraphobia-specific terms. Maximum likelihood fitting of this model yields positive estimates of all parameters: a = 22.8 (4.8), b = 18.5 (5.3), α = 31.0 (6.7), β = 11.8 (4.6), a' = 9.1 (3.7) and γ = 70.3 (28.7); all values are significantly larger than zero (p<.02). This model explains 79% of the baseline variance and is preferred to the previous model according to AIC. Again there are no significant differences between countries.
4.4 Discussion
Study 3 showed a substantial proportion (more than one third) of ostraphobics in both Swedish and American samples. Of the non-ostraphobics, the large majority could be classified as normally envious. In the studies to
follow we will therefore simplify identification of ostraphobics by just asking whether the respondent finds the extreme single-loser or extreme single-winner allocations most unfair, given that he or she is in the loser position.
Both our predictions were supported in this experiment: The least unfairness was perceived by judges in a position between loser and winner, and the recipient-judge model was found to be superior to all prior models (Prediction 3a), each of which misses some important part of the problem. The results also support ostraphobic participants' greater sensitivity to inequality in general and the single-loser effect in particular (Prediction 3b). As in Experiments 1 and 2, results were robust across countries.
5. Experiment 4
The aim of this experiment is to explicitly demonstrate ostraphobic preference reversal as well as its independence of the kind of resource. We classify ostraphobics on the basis of allocations of money, and study preference reversal in the allocations of goods.
5.1 Method and Procedures
A total of 121 participants (28 females, median age 22 years) were recruited from pools of volunteering students at a Swedish university. Participants came to a laboratory and were shown to separate cubicles where they completed a questionnaire and then took part in an unrelated experiment. The questionnaire had two parts. Each part presented a scenario about allocations of the inheritance (an unspecified amount of money and 28 vases) from an elderly neighbor. One scenario was about allocations between two others. Respondents were first asked whether an equal split or a very unequal split of money between the two others would be more unfair. They were then asked to make ratings, again on a scale from 0=perfectly fair to 100=maximally unfair, of the unfairness of (1) an equal split [14:14] of the 28 vases, and (2) the very unequal split [2:26]. The other scenario was similar, except for the inclusion of the judge as a loser in every allocation, thus transforming equal splits to single-loser allocations and very unequal splits to single-winner allocations. In the judge-as-loser scenario the total number of vases was 30, and the splits considered were [2:14:14] and [2:2:26]. The order of presentation of scenarios (whether the judge was included or not) was randomized.
5.2 Results
Three respondents rated the unfairness as zero in all four rating tasks, and were therefore excluded. In the scenario with no judge involvement, five of the remaining respondents either chose the equal split of money as more unfair than the unequal split or rated the equal split of vases as more unfair than the unequal split; they too were excluded from further analysis. The remaining 113 respondents were classified as ostraphobic (35%) if they preferred the single-winner allocation of money in the judge-as-loser scenario, and non-ostraphobic (65%)
otherwise. Because all these respondents chose the equal split of money as fairer, all respondents classified as ostraphobic exhibited preference reversal with respect to money allocations.
Table 6 about here
Table 6 shows mean ratings of the unfairness of the single-winner and single-loser allocations of vases. As expected, ostraphobics gave much higher ratings (indicating greater perceived unfairness) of the single-loser allocations than did non-ostraphobics (t(100.06) = 2.74, p= .004). On the other hand, there was no difference between ostraphobics and non-ostraphobics in their ratings of the single-winner allocation (p = 0.21).
Preference reversal (for vases) occurred if the judge rated the single-loser allocation as more unfair than the single-winner allocation. Table 6 shows that 59.0% of ostraphobics, compared to only 9.5% of non-ostraphobics, exhibited preference reversal for vases (p = .000, Fisher's exact test).
5.3 Discussion
This study tested Prediction 4 about the prevalence of ostraphobic preference reversal. Consistent with the proportion of participants classified as ostraphobic in Experiment 3, we found 35% of respondents explicitly showing ostraphobic preference reversal with respect to choices between allocations of money. We also found that a majority of these ostraphobic participants (but only a very small minority of the others) showed preference reversal with respect to fairness judgments of allocations of goods. This suggests that the phenomenon of ostraphobia is neither dependent on a certain kind of resource, nor on whether judges are asked for a direct
comparison or parallel fairness judgments. The latter result is consistent with Experiment 2 findings on the single-loser effect for observer-judges.
6. Experiment 5
The main aim of this last experiment was to assess the relationship between ostraphobia and two well-established social psychological constructs: need to belong (NTB) and fear of negative evaluation (FNE). We measured ostraphobia with respect to money, material goods, and social status. Data were collected using Amazon Mechanical Turk.
6.1 Method and Procedures
202 participants (103 females; median age 27 years) were recruited from the pool of workers of the Amazon Mechanical Turk to complete an on-line vignette. As in Experiments 1 and 2, participants came predominantly from the US (58%) and India (28%) and had a similar mix of educational backgrounds.
Participants first answered three ostraphobia questions in the form of choices between a single-winner and single-loser allocation when the judge is a loser (Table 7). Thereafter, they completed the ten-item NTB scale (Leary et al. 2007) and the brief (12 item) version of the FNE scale (Leary 1983).
Table 7 about here 6.2 Results
Based on responses to the questions in Table 7, we found the following frequencies of ostraphobia: 32% for Money, 45% for Goods, and 54% for Status. All three kinds of ostraphobia were positively correlated with each other (all r > .2, all p < .01), so we summed them into a single ostraphobia index (Cronbach's α = .58) counting the number of ostraphobic responses between 0 and 3.
Responses to the NTB and FNE items were coded on a scale from one to five and summed to two indices with good internal consistency (Cronbach's α = .76 and .90 respectively). The NTB and FNE indices were highly correlated (r = .75). Indeed, together they form a 22-item scale with very high internal consistency (Cronbach's α = .92). Accordingly, we compute a summed NTB-FNE index. We also conducted a separate set of analyses for the
single item that is most explicitly about sensitivity to social exclusion: "My feelings are easily hurt when I feel that others do not accept me" (from the NTB scale).
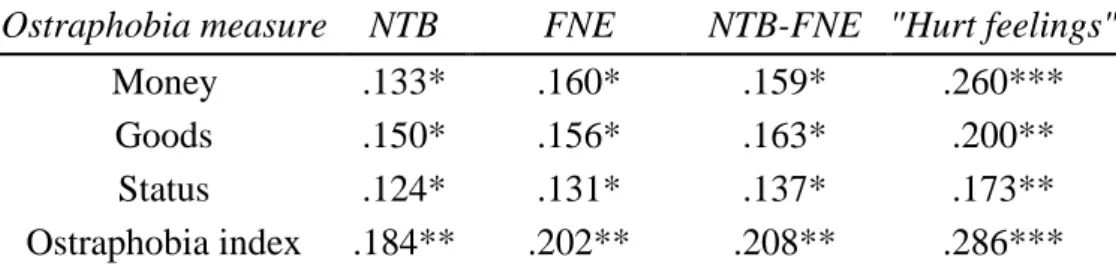
Table 8 about here
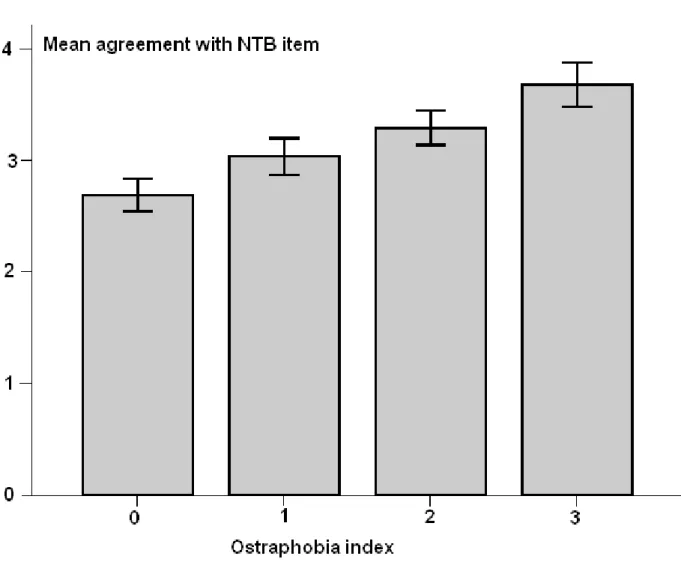
As shown in Table 8, all correlations are positive between each kind of ostraphobia on the one hand and each of the various NTB and FNE measures (Prediction 5). It is noteworthy that the "Hurt feelings" item consistently correlates even more strongly with ostraphobia than either of the full NTB or FNE indices. Figure 1 illustrates the strong correlation between that item and the ostraphobia index.
Figure 1 about here
Separate analyses of the US and Indian data give the same qualitative results. However, correlations between ostraphobia and NTB-FNE are much stronger within the US sample. For instance, the correlation between the "Hurt feelings" item and the ostraphobia index is r = .374 (p < .001) in the US sample, compared to r = .145 (p = .14) in the Indian sample.
6.3 Discussion
Study 5 replicated the finding from Experiment 4 that ostraphobia extends to different kinds of resources, from money to goods and even to status. Regardless of kinds of resource, our prediction that ostraphobia is related to need to belong and fear of negative evaluation was confirmed. Indeed, we found that these two scales were so strongly related that it made sense not to distinguish between NTB and FNE. (Surprisingly, we found no prior research comparing NTB and FNE.)
In support of our argument that ostraphobia is related to high sensitivity to unfair outcomes, we found that – regardless of kinds of resource – ostraphobia was particularly strongly related to the NTB item about one's feelings being easily hurt when one is not accepted by others.
7. General discussion
This paper extends prior work to make a number of key contributions to our understanding of fairness perceptions. At the most general level, we showed that while each of several existing models accounts for
important determinants of perceived unfairness, each model leaves out critical predictors. The integrated model outlined in this paper shows that fairness perceptions of observers with no vested interest in an allocation are based on both general pairwise differences between group members and special attention to differences involving the loser (Prediction 1). Indeed, we found particularly strong aversion to allocations involving a single loser; in
contrast, we found no similar aversion to the presence of a single winner (Prediction 2). As a result, the presence of a single loser leads to greater perceptions of unfairness than allocations with multiple losers. Thus, models that focus solely on spread and do not account for the special role of the relative outcome of the loser will
underestimate perceptions of unfairness and dissatisfaction with outcomes.
We found that judges with a vested interest in an allocation also give special weight to differences in which they are directly involved. Importantly, this is not solely due to self-serving biases. Our model shows that it is critical to distinguish between self-serving and egocentric effects, because they both play different roles in fairness perceptions (Prediction 3a). This has a number of important implications, including the prediction that a recipient-judge will not necessarily view allocations in which he or she benefits most as the fairest. Models that do not distinguish differences involving a recipient-judge, or those that make this distinction but assume that they are driven solely by a self-serving bias will therefore generate misleading predictions. While we predicted this effect based on egocentric biases, a non-competing motivational approach may (partially) account for our findings. For instance, while being at the losing end of a distribution can lead to envy (and perhaps redistributive efforts)
occupying the winning end can lead one to feel like the target of others’ envy. Being well-off, but not the best-off, may decrease the chances that one becomes a target of others’ envy. As a result, one may be able to enjoy absolute advantages without bearing the (actual or perceived) costs of relative advantages.
We believe findings relevant to Prediction 3a have a wide range of implications and should therefore be explored more fully in future research. For instance, research on happiness and subjective well-being show that, while those who are higher in rank tend to be happier, the correlation between rank and happiness is much weaker than would be expected by existing models, as well as casual intuition (see, e.g., Diener et al. 1993). One possible explanation for the weak relationship between hierarchy position and subjective well-being is that unfairness
concerns may temper the higher levels of happiness those at the top would otherwise experience. Our findings suggest that perceiving oneself as being near the top, but not at the top, may lead to lesser concern with unfairness and, by extension, higher levels of happiness. To our knowledge, this prediction has not been investigated, but it could be straightforwardly tested using existing approaches to the study of social rank and happiness (see, e.g., Boyce et al. 2010; Easterlin 1974; Veenhoven 1991).
Our model also accounts for a heretofore unrecognized phenomenon that we have labeled ostraphobia. Ostraphobics exhibit an acute sensitivity to being ostracized as “single losers” and therefore perceive substantially greater unfairness as single losers than do the normally envious (Prediction 3b). In fact, as detailed in Prediction 4, this sensitivity leads ostraphobics to exhibit a previously undocumented form of preference reversal, preferring to be in the company of fellow losers than to lose alone, even if having fellow losers results in increased inequality. Importantly, we predicted and found that ostraphobia is linked to several well-established dispositions (Prediction 5). In particular, ostraphobes tended to be higher in need to belong (Baumeister and Leary 1995) and fear of negative evaluation (Leary 1983).
Because prior work does not model ostraphobia, it misses an important basis for divergent perceptions of unfairness within groups. That is, previous work has rightly focused on how group members’ divergent perceptions of inputs lead to interpersonal conflicts about what constitutes a proper or improper distribution. Such conflicts are undoubtedly commonplace, given the well known motivational and judgment-based tendency for people to place greater weight on their own contributions to a group than others’ contributions (e.g., Ross and Sicoly 1979). Yet our work suggests that, even when group members agree on the inputs or member-contributions, they can still disagree – in predictable ways – on the relative unfairness of unequal distributions, with ostraphobes showing greater sensitivity to being singled out than the normally envious. These differences should have important implications for a wide range of group processes.
Although we think the consistency of results across studies provides some evidence for robust effects, all these experiments drew on a single method: fairness ratings in vignette experiments. Thus, besides testing additional implications of our arguments in new empirical domains, an important task for future research is
replicating the above findings using a wider array of methods from prior work on unfairness, such as skin conductance (Civai et al. 2010) and fMRI techniques (Sanfey et al. 2003).
In addition to these methodological extensions, future work should be directed at addressing a number of questions left unanswered in this research. For instance, how is the single-loser dimension perceived in larger groups, such as nations? Conceivably, even if there are many losers, individuals may feel singled out if there are sufficiently few compared to the entire group. In addition, here we only addressed cases where there recipients do not differ in effort or need. Future research may therefore address how the single-loser effect and ostraphobic preference reversal interact with differences in efforts or needs among recipients (Bar-Hillel and Yaari 1993). These methodological limitations and unanswered questions notwithstanding, we feel that the research outlined here provides a foundation for an array of new investigations into fairness processes in groups.
References
Akaike, H. (1974). A new look at the statistical model identification. IEEE Transactions on Automatic Control, 19(6), 716–723.
Alves, W.M., Rossi, P.H. (1978). Who should get what? Fairness judgments of the allocation of earnings. American Journal
of Sociology , 84(3), 541-564.
Andreoni J., Brown P.M., Vesterlund L. (2002). What makes an allocation fair? Some experimental evidence . Games and
Economic Behavior, 40(1), 1-24.
Babcock, L., Loewenstein, G. (1997). Explaining bargaining impasse: The role of self-serving biases. Journal of Economic
Perspectives, 11(1), 109-126.
Bar-Hillel, M., Yaari, M. (1993). Judgments of distributive justice. In B. A. Mellers and J. Baron (eds.), Psychological
perspectives on justice: Theory and applications, pp. 56–84. New York: Cambridge University Press.
Baumeister, R.F., Leary, M.R. (1995). The need to belong: Desire for interpersonal attachments as a fundamental human
motivation. Psychological Bulletin, 117(3), 497-529.
Bazerman, M.H., Blount White, S., Loewenstein, G.F. (1995). Perceptions of fairness in interpersonal and individual choice
situations. Current Directions in Psychological Science, 4, 39–43.
Binmore, K. (2005). Natural justice. Oxford: Oxford University Press.
Blakely, G.L., Andrews, M.C., Moorman, R.H. (2005). The moderating effects of equity sensitivity on the relationship
between organizational justice and organizational citizenship behaviors. Journal of Business and Psychology, 20(2),
259-273.
Boyce, C.J., Brown, G.D.A., Moore, S.C. (2010). Money and happiness: rank of income, not income, affects life satisfaction.
Psychological Science, 21(4), 471-475.
Brosnan, S.F., de Waal, F.B.M. (2003). Monkeys reject unequal pay. Nature 425, 297-299.
Buhrmester, M. D., Kwang, T., Gosling, S. D. (in press). Amazon’s Mechanical Turk: A new source of inexpensive, yet high-quality, data?. Perspectives on Psychological Science.
Charness, G., Rabin, M. (2002). Understanding social preferences with simple tests, Quarterly Journal of Economics,
117(3), 817-869.
Civai, C., Corradi-Dell'Acqua, C., Gamer, M., and Rumiati, R. (2010). Are irrational reactions to unfairness truly
emotionally-driven? Dissociated behavioural and emotional responses in the Ultimatum Game task. Cognition, 114,
89-95.
Conlon, D.E., Porter, C.O.L.H., McLean Parks, J. (2004). The fairness of decision rules. Journal of Management, 30(3),
329–349.
De Jong, S., Tuyls, K., Verbeeck, K. (2008). Fairness in multi-agent systems. The Knowledge Engineering Review, 23(2), 153–180.
DeVoe, S.E., Iyengar, S.S. (2010). Medium of exchange matters: What’s fair for goods is unfair for money. Psychological
Science, 21(2), 159-162.
Diener, E., Sandvik, E., Seidlitz, L., and Diener, M. (1993).The relationship between income and subjective well-being: Relative or Absolute? Social Indicators Research 28:195-223.
Deutsch, M. (1985). Distributive justice: A social psychological perspective. New Haven, CT: Yale University Press.
Easterlin, R. A. (1974). Does economic growth improve the human lot? Some empirical evidence. In P. A. David and W. R.
Melvin (eds) Nations and Households in Economic Growth. Stanford University Press, CA. Pp 98-125.
Formaterat: Engelska (USA) Formaterat: Engelska (USA)
Formaterat: Engelska (USA)
Eriksson, K., Simpson, B. (2010). Emotional reactions to losing explain gender differences in entering a risky lottery. Judgment and Decision Making, 5, 159-163.
Fehr, E., Schmidt, K.M. (1999). A theory of fairness, competition, and cooperation. Quarterly Journal of Economics, 114,
817–868.
Finkel, N.J. (2000). But it's not fair! Commonsense notions of unfairness. Psychology, Public Policy, and Law, 6(4),
898-952.
Frohlich, N., Oppenheimer, J.A., Eavey, C.L. (1987). Choices of principles of distributive justice in experimental groups.
American Journal of Political Science, 31(3), 606-636.
Frohlich, N., Oppenheimer, J.A. (1992). Choosing Justice . Berkeley: University of California Press.
Hsee, C.K., Loewenstein, G.F., Blount, S., Bazerman, M.H. (1999). Preference reversals between joint and separate
evaluations of options: A review and theoretical analysis. Psychological Bulletin 125(5), 576-590.
Huseman, R.C., Hatfield, J.D., Miles, E.W. (1987). A new perspective on equity theory: The equity sensitivity construct. The
Academy of Management Review 12(2), 222-234.
Jasso, G. (2006). Factorial survey methods for studying beliefs and judgments. Sociological Methods and Research 34:334–
423.
Kagel, J.H., Wolfe, K.W. (2001). Tests of fairness models based on equity considerations in a three-person ultimatum game.
Experimental Economics, 4, 203-219.
Kim, K., Markman, A.B. (2006). Differences in Fear of Isolation as an explanation of cultural differences: Evidence from
memory and reasoning. Journal of Experimental Social Psychology, 42 (3), 350-364.
King, W.C., Miles, E.W., Day, D.D. (1993). A test and refinement of the equity sensitivity construct. Journal of
Organizational Behavior, 14(4), 301-317.
Kogut, T., Ritov, I. (2005). The “identified victim” effect: an identified group, or just a single individual?, Journal of
Behavioral Decision Making, 18, 157–167.
Konow, J. (2005). Blind spots: The effects of information and stakes on fairness bias and dispersion. Social Justice
Research, 18(4), 349-390.
Formaterat: Engelska (USA)