Clustering of Facial Action Units
in Horses with Pain
Degree Project 30 credits within the Veterinary Medicine Programme
Faculty of Veterinary Medicine and Animal Science
Alina Silventoinen
Uppsala
2019
Clustering of Facial Action Units
in Horses with Pain
Supervisor: Pia Haubro Andersen, Department of Clinical Sciences
Examiner: Marie Rhodin, Department of Anatomy, Physiology and Biochemistry
Degree Project in Veterinary Medicine
Credits: 30
Level: Second cycle, A2E Course code: EX0869 Place of publication: Uppsala Year of publication: 2019
Online publication: https://stud.epsilon.slu.se
Cover illustration Screenshot of film 11, filmed by Karina Bech Gleerup. Screenshot by Alina Silventoinen Key words: pain assessment, equine pain face, EquiFACS
Nyckelord: smärtbedömning, smärtansikte, EquiFACS, häst
Sveriges lantbruksuniversitet
Swedish University of Agricultural Sciences
Faculty of Veterinary Medicine and Animal Science Department of Clinical Sciences
SUMMARY
Pain assessment in horses is a relatively new topic in veterinary medicine and there is no universally accepted pain scale for assessing pain in horses. Assessing and managing pain is essential for the welfare of the animal.
Several different pain scale systems have been made for both humans and animals. An example of this is Composite Pain Scale (CPS), where several parameters, such as behaviour and physiological parameters, are being assessed at the same time. Studies of pain assessment through facial expressions are several in human medicine but only a few studies have been made on horses. The Horse Grimace Scale and Equine Pain Scale are examples of studies on facial expressions and pain in horses.
Equine Facial Action Coding System (EquiFACS) is a method of identifying and coding facial expressions on horses on the basis of underlying facial musculature and muscle movement. The system is based on Action Units and Action Descriptors which each represent a separate movement.
Facial actions have been used together with artificial intelligence in order to evaluate pain in humans. This is probably possible to do with horses as well, but more training data is needed. This study included 28 films of horses with and without pain, both in experimental and clinical setting. The films were coded using Equine Facial Action Coding System in order to analyse how the different facial action units cluster in horses with and without pain. Relevant facial actions for the equine pain face were selected in order to visualise changes in duration, frequency and occurrence between painful and non-painful horses, as well as upper and lower facial actions. According to the two-sample t test, only one facial action unit (AD38, nostril dilator) had statistical significance. However, the linear discriminant analysis showed a 92% correct classification in duration in pain/no pain.
Stress may have influenced pain behaviour due to stress-induced analgesia or hyperalgesia. A larger sample size is needed in order to investigate this further, but there is potential for EquiFACS to be used as a tool for objective pain scoring.
CONTENT
INTRODUCTION ... 1
LITERATURE REVIEW ... 2
Definition and meaning of pain ... 2
Pain assessment in animals... 2
Visual analogue scales ... 2
Time budget/activity budget analysis ... 3
Composite pain scales ... 3
Behavioural and physiological indicators of pain ... 3
Pain assessment through facial expressions ... 5
Advantages and limitations of pain assessment ... 5
Pain assessment in horses ... 5
EquiFACS ... 6
Artificial intelligence and pain evaluation ... 7
MATERIAL AND METHODS ... 9
Aim and hypothesis ... 9
Study design ... 9
Analysis of data ... 9
RESULTS ...11
Differences in individual facial actions between horses in pain and not in pain ...13
Cluster analysis ...17
Linear discriminant and principal component analysis ...17
Visualising Action Units and their occurrences together...18
Head and ear movement ...19
Keys to scorings ...21
DISCUSSION ...23
Painful vs. Non-painful horses ...23
Trained horses vs. clinical cases ...23
Comparing pain scoring results made by people and artificial intelligence...24
Limitations and advantages ...24
Future uses of EquiFACS in pain scoring ...24
CONCLUSION ...24
ACKNOWLEDGEMENTS ...25
POPULAR SCIENCE SUMMARY ...26
Pain assessment ...26
EquiFACS ...26
Aim and study design ...27
Results ...27
Discussion ...27
REFERENCES ...29
APPENDIX A: Boxplots ... 1
APPENDIX C: Pie charts, duration ... 6 APPENDIX D: Histograms, occurrence ...11
INTRODUCTION
Pain assessment in veterinary practice is essential but challenging. The five freedoms of animal welfare state that the animal should have “freedom from pain, injury and disease – by prevention or rapid diagnosis and treatment” (Webster, 2001). Diagnosing an animal in pain can be challenging, and therefore reliable pain assessment tools are essential. The ultimate goal of pain assessment is alleviating pain and discomfort.
No pain evaluating system is perfect, because animals can’t talk nor explain how they feel. Therefore there are no pain scales that reflect “ground truth” for evaluating pain in animals. Veterinary medicine uses different approaches to assess pain in horses, such as behavioural and physiological changes as well as facial expressions. Physiological measurements, such as heart rate are being used in daily practice but are considered unreliable on their own due to physiological factors such as dehydration or endotoxemia that might give false results. Therefore, they should be combined with behavioural evaluation. The consensus amongst veterinarians is that behavioural assessments are the most reliable and useful (Gleerup & Lindegaard, 2016). Evaluating pain in horses is among the most difficult to score due to horses being prey animals that may alter (Ashley et al., 2010) or hide (Coles et al. 2018, n.d.) pain behaviour as this makes them easy targets for predators.
Facial expressions of pain in horses have only recently been investigated systematically (Dalla Costa et al., 2014; Gleerup et al., 2015). Horses in pain may show unusual high frequencies of certain facial expressions such as low and/or asymmetrical ears, an angled appearance of the eyes, and tension of the lips (Gleerup et al., 2015). For a more objective pain evaluation, machine learning could be used to recognize painful facial expressions in horses. This has already been used in humans with good results (Rodriguez et al., 2017).
The Equine Facial Action Coding System (EquiFACS) is a system used to record facial expressions based on facial musculature and its activity in horses (Wathan et al., 2015). EquiFACS has never before been used to code facial expressions in painful horses. The aim of this thesis was to investigate if EquiFACS could discriminate horses with and without pain and if this could be applied to clinical cases of supposedly painful and non-painful conditions. The objective was to score films of clinical cases of supposedly painful and non-painful conditions as well as horses with known experimental pain and investigate their frequencies and durations which were of importance for the pain classification. The hypothesis was that there are specific facial actions that define the facial expressions of horses in pain and their timing.
LITERATURE REVIEW
Definition and meaning of pain
Human pain is often defined as “an unpleasant sensory and emotional experience associated with actual or potential tissue damage, or described in terms of such damage.” There is also an addition that “the inability to communicate verbally does not negate the possibility that an individual is experiencing pain and is in need of appropriate pain-relieving treatment.” By this, IASP refers to adults unable to communicate, neonates and infants (IASP, 2017). This definition can be applied to animals as well, due to the fact that they cannot communicate about their pain (Sneddon et al., 2014).
Pain, as unpleasant as it is, is needed in order to prevent tissue damage (Robertson, 2002). This is seen as a reflex withdrawal, when the body moves away from the pain inducer, or physiologic pain, where the brain registers it as something that hurts but no damage is done and normal sensation returns. Animals are capable to correlate pain with injury and learn to avoid the cause in the future.
Pain assessment in animals
Pain assessment differs remarkably between humans and animals, due to the fact that humans can vocalize when they are in pain. In animals, the responses to pain are behavioural and physiological (Bufalari et al., 2007).
The experience and expression of pain are influenced by many factors such as species, breed and individual variations, environmental characteristics and drugs and therefore a good pain scale should contain many different types of data – so called multimodal pain scoring (Bussières
et al., 2008; de Grauw & van Loon, 2016).
The ideal pain scoring system must be easy to use, include parameters giving repeatable interpretation from one evaluator to another, and provide constancy in the results. Parameters are also required to evaluate the presence or absence of pain and allow the observer to differentiate as precisely as possible the degree of pain encountered by the patient despite the absence of verbal communication with the animal (Bussières et al., 2008). There are several different types of scales with different focus made for pain assessment, here are examples of some of them.
Visual analogue scales
Visual analogue scale (VAS) is a horizontal 10 cm line, representing pain intensity that increases from none to the worst imaginable (de Grauw & van Loon, 2016). An observer puts a mark along the line that corresponds to the perceived amount of pain an animal is experiencing. The pain score is read off as the number of mm from the zero end of the scale. It is easy to use, but it is uncertain how it reflects a pain continuum rather than discrete classes (in humans). The scale is influenced by the amount of time taken to observe the animal.
It has been shown that VAS is the most reliable in the hands of experienced observers, because it expresses a summary of the observer’s accumulated interpretations rather than a series of scores for predefined categorized behaviours (Cambridge et al., 2000). The effectiveness of
VAS can be enhanced by complementing the standard visual perceptions of appearance and behavioural responses with physical interactions.
Time budget/activity budget analysis
The principle of a budget/activity budget analysis is that alterations in behaviour affect behavioural or activity patterns (Grauw & van Loon, 2016). The animals are observed with continuous videotaping. Later the tapes are used to determine activity budgets, which constitute the times animals spend on each pre-specified behaviour, for example eating. Another approach is to obtain long film clips at separate time points, noting the time an animal spends on each pre-defined observable behaviour. This time is expressed as a percentage of the total duration of the video segment to calculate a time budget for each behaviour. The latter method reduces the time needed for monitoring and video analysis. It seems that continuous monitoring may have greater sensitivity for picking up pain-related behaviours than intermittent observations. The system is sensitive for detection of mild pain, but requires time and equipment.
Composite pain scales
In composite pain scales (CPS), several pain parameters are being assessed at the same time (Grauw & van Loon, 2016). Multiple variables are scored individually using well-defined classes, which are then combined to provide an overall CPS score. CPS is considered to have better inter-observer reliability than VAS. Its drawbacks are need for experienced and/or trained observers and the time needed for repeated evaluation, although the latter may be reduced by step-wise elimination of the least sensitive variables. The maximum amplitude of CPS scores in clinical cases tends to be limited and it has limited utility in identifying mild pain states.
A composite multifactorial pain scale in horses has been used in scoring acute orthopaedic pain (made by chemically induced synovitis) with good inter- and intra-observer reproducibility (Bussières et al., 2008). The most important behavioural indices were response to palpation of the painful area, posture, pawing on the floor, kicking at abdomen and head movement. The study showed that physiological parameters are not valid to evaluate orthopaedic pain in horses, even if heart rate could be indicative in some circumstances.
van Loon et al. (2010) used the composite pain scale described by Bussières et al. (2008) to investigate the clinical applicability and inter-observer reliability in different equine patients with acute or chronic somatic or visceral pain caused by surgical and nonsurgical conditions. The pain scale included physiologic data, responses to stimuli, and spontaneous behavioural data. The inter-observer reliability was very high. The use of CPS worked especially in horses that respond well to treatment and have low levels of pain. The CPS created by Bussières not only works in horses with orthopaedic pain as originally intended, but also in horses with non-orthopaedic surgical and nonsurgical acute visceral and somatic pain.
Behavioural and physiological indicators of pain
Measuring pain is often done by monitoring behaviour (Anil et al., 2002). It is more direct because changes in behaviour often happen immediately when the pain is felt. It is also faster than measuring physiological changes. Pain-specific behaviour has been identified in several species (Sneddon et al., 2014).
Behavioural signs of pain in animals are well known but do not give definite evidence of pain, since there is no gold standard for pain, such as for temperature or heart rate (Gleerup & Lindegaard, 2016). Acute pain often induces withdrawal to reduce injury. There are general and pain specific changes in behaviour. Some general signs are for example absence of normal behaviour, changes in behavioural patterns, appearance, posture, gait, appetite, response to handling, and weight (Anil et al., 2002; Gleerup & Lindegaard, 2016). Animals undergoing severe acute pain may have signs of anxiety, changes in eye expression, restlessness, lameness, changes in appetite and personality, increased or decreased physical activity, self-mutilation, and vocalization. Others include excessive salivation, mydriasis, tachypnoea, and tachycardia. There are also pain-specific behaviours. In horses for example, colic pain will show in pawing, rolling and flank watching (Gleerup & Lindegaard, 2016). Chronic pain causes guarding behaviour in movement and posture, avoidance of aggravating influences, seeking of pain-relieving factors and environments, self-care of a painful region, and signs of stress. Sometimes even hirsutism, weight loss, inappetence and an “unhappy eye expression” may be seen. (Anil
et al., 2002; McDonnell, 2008)
Factors that might affect measuring behaviour, such as the social context, make assessing pain behaviour difficult. Luckily, the presence of more than one behavioural indicator of pain helps to confirm it. Behavioural indicators can also be related to physiologic changes, e.g. when the animal is in distress. This has been measured in farm animals (Mellor et al., 1991). Another thing that makes behaviour itself an unreliable indicator is that it’s species- and injury-specific (Anil et al., 2002). Breed, temperament, sex, age, and environment may also influence behaviour (de Grauw & van Loon, 2016).
Demeanour and heart rate are the variables most commonly used by vets in practice to assess pain in horses (Price et al. 2002), although physiological measures such as heart and respiratory rate and hormonal concentrations are poorly correlated with subjective assessments of pain and may also be influenced by extraneous factors such as drug administration (Love, 2009). Nevertheless, they can be incorporated into a composite pain assessment system that also includes behavioural components (de Grauw & van Loon, 2016).
Hormone and mediator concentrations, such as cortisol, beta-endorphins, and catecholamines have a complex relation between physiological stress, behavioural distress and pain, because they may be triggered by stress responses that are not pain induced (de Grauw & van Loon, 2016). The magnitude of change may also not be related to the extent or severity of pain. Cortisol is not a sensitive index of low-grade pain (Anil et al., 2002). According to several studies, the use of catecholamines and corticosteroids to measure pain has proven unreliable and cannot be solely relied upon to validate behavioural indicators of pain (Ashley et al., 2010; Raekallio et al., 1997).
Both behavioural and physiological pain parameters lack sensitivity and specificity when used individually, but combining them in a pain assessment will lead to increased validity (van Dijk
Pain assessment through facial expressions
In comparison to pain behaviour, facial expressions have a tendency to be congenital, reacting to activity in nociceptive pathways (Kunz et al., 2011). They have been used in pain assessment in humans, both in infants (Craig et al., 1988) and adults (Craig & Patrick, 1985). Similar studies have been done in animals, such as horses (Dalla Costa et al., 2014; Gleerup et al., 2015) and cats (Holden et al., 2014). In humans, facial expressions are usually scored using the Facial Action Coding System (FACS) (Ashraf et al., 2009; Jordan et al., 2011). There have been studies about pain action units in rodents and rabbits as well, which have been made into species specific grimace scales (Langford et al., 2010; Sotocinal et al., 2011). The advantages with grimace scales are several; they save time, they are easy to use and can be used to effectively assess several painful conditions, from mild to severe pain (Langford et al., 2010). Facial expressions of pain are difficult to suppress (Prkachin & Mercer, 1989). This makes it a reliable and objective measure of pain in humans. It can also be applied with other behaviour-based methods to enhance the assessment of pain (Dalla Costa et al., 2014). However, it is important to differentiate changes in facial expressions due to stress (Love, 2009), pharmacological treatment (Ashley et al., 2010), and the influence of humans (Gleerup et al., 2015).
Advantages and limitations of pain assessment
Advantages of a defined pain scoring system or pain scale are for example increasing the observer’s ability to recognize and quantify pain, increasing interobserver agreement on the degree of pain and so improving patient care and pain relief, and ability to follow progress or deterioration of the patient (Wagner, 2010).
There are many different limitations to pain assessment in animals (Anil et al., 2002). It is impossible to compare pain reactions between different species or breeds. Extreme pain can also activate body’s own analgesic opioid peptides, which will mask the animals’ pain and give false results. Subjective measures do not always correlate with objective indicators such as heart rate and respiratory rate. There is also an ethic side: how much can an animal tolerate without suffering?
Pain assessment in horses
In order to understand pain related behaviour in horses, normal behaviour should be studied. Horses are herbivores that graze in herds in the wild. Flight is their primary defence, which makes them highly alert and easily adaptable to new environments (Miller, 1995). In the wild the horses are eating almost constantly throughout the day (Sweeting et al., 1985). If food is present at all times, domesticated horses use 50-70% of the day to eat. When the horse is not eating, they are resting or alert and moving (Feist & McCullough, 1976; Mayes & Duncan, 1986).
Pain related behaviour in horses can be divided in general pain behaviour and pain-specific behaviours. Examples of general pain behaviour include restlessness, depression with decreased physical activity, decreased appetite (Price et al., 2003) and standing with head lowered (Pritchett et al., 2003). Self-mutilation is a common response to intense or chronic pain (McDonnell, 2008). This is seen for example with limb pain and gastric ulcers. An example of
pain-specific behaviour is pawing, flank-watching and rolling during colic pain (Graubner et
al., 2011).
New advances in equine pain assessment are facial expressions of pain. The Horse Grimace Scale (HGS) is built on six different facial action units: stiffly backwards ears, orbital tightening, tension above the eye area, prominent strained chewing muscles, mouth straining and pronounced chin, strained nostrils and flattening of the profile (Dalla Costa et al., 2014). The HGS has been studied on post-castration pain. Gleerup et al. (2015) defines an equine pain face with “low and/or asymmetrical ears, an angled appearance of the eyes, a withdrawn and/or tense stare, mediolaterally dilated nostrils and tension of the lips, chin and certain facial muscles”. The study was performed with induced pain (a tourniquet on the antebrachium and topical application of capsaicin).
Physiological parameters are also used in pain evaluation in horses. Heart rate has believed to have almost linear correlation to general and colic pain (Gleerup & Lindegaard, 2016). In different pain studies, heart rate increased in some horses (Bussières et al., 2008; Pritchett et
al., 2003). Respiratory rate increased in horses with induced synovitis (Bussières et al., 2008).
Non-invasive blood pressure increased in horses with induced synovitis and in horses with induced somatic pain (Gleerup et al., 2015). Serum cortisol and beta endorphins have shown to have correlation to pain (Raekallio et al., 1997). However, pathological changes such as endotoxemia, cardiovascular compromise and dehydration may affect heart and respiratory rate as well as blood pressure (Gleerup & Lindegaard, 2016).
Several different pain assessment tools have been investigated on horses (Gleerup & Lindegaard, 2016). Analgesic, systemic, and mechanical nociceptive testing are examples of simple ways to test if the horse is in pain. In analgesic testing, local anaesthetics are injected as regional or local or intrasynovial infiltration. In systemic analgesic testing, the horse is treated with pain killers in order to determine whether an altered behaviour is due to pain. This is often used in horses with poor performance and without a specific diagnosis. Mechanic nociceptive threshold testing is simply touching or pressing an area in order to determine whether it is painful or not.
Pain scoring scales in equine pain evaluation use behavioural and/or physiological changes. An example of a pain scale that uses both is Post abdominal surgery pain assessment scale (PASPAS). It was tested in horses after laparotomy (Graubner et al., 2011). A suitable pain scale in a clinical environment should be based on specific and defined indicators of pain (Gleerup & Lindegaard, 2016). The consensus is that behavioural parameters are the most useful pain indicators.
EquiFACS
Facial Action Coding System (FACS) is a systematic method of identifying and coding facial expressions on the basis of underlying facial musculature and muscle movement (Wathan et
al., 2015). It is anatomically based and documents all facial movements rather than a
The system is based on designated codes (Action Units) that represent the contraction of a particular facial muscle and the facial movements. (Table 1.) There are also Action Descriptors that represent more general facial movements. The system can be used in a standardised, objective way. Wathan et al. (2015) dissected a head of one horse in order to inspect the facial muscles to see which muscle is being used in certain facial movements. There are also FACS developed for humans (Ekman, 1997) and other animals such as dogs (Waller et al., 2013), and orangutans (Caeiro et al., 2013).
Grimace Scale is based on six facial action units (Dalla Costa et al., 2014). They are still pictures, whereas EquiFACS facial actions are movements. There are possibly more pain related action units than what the Grimace Scale suggests. Grimace Scale shows variation in intensity, which EquiFACS does not. Grimace scale is often composed on many facial action units.
Artificial intelligence and pain evaluation
Computer Vision Science has been used in humans in order to recognize basic human emotions through facial expressions. This method has also been used in pain identification with high accuracy (Rodriguez et al., 2017). This is possible through teaching the systems to identify patterns of facial features based on a collection of examples (Andersen et al., 2018). There are yet no similar systems made for horses, because the facial images need to be registered before the expressions can be recognized. One way to do this is to use facial key points in order to registrate facial images. The limitation with facial key points is that training data (i.e. still images and films) is needed in order to train a Machine Learning method.
Facial action units can be used in machine learning and pain evaluation (Huang et al., 2014). An automated facial action coding system has been used in humans to measure facial expressions in a postoperative setting, where a combination of computer vision, pattern recognition and machine learning was used. The results showed that an automated facial expression analysis may be used to evaluate pain in humans. There is also evidence that not only does computer vision system identify facial action units (based on FACS), it differentiates faked facial expressions from genuine pain expressions in humans and detects distinctive dynamic features of expression, which were missed by human evaluators (Bartlett et al., 2014).
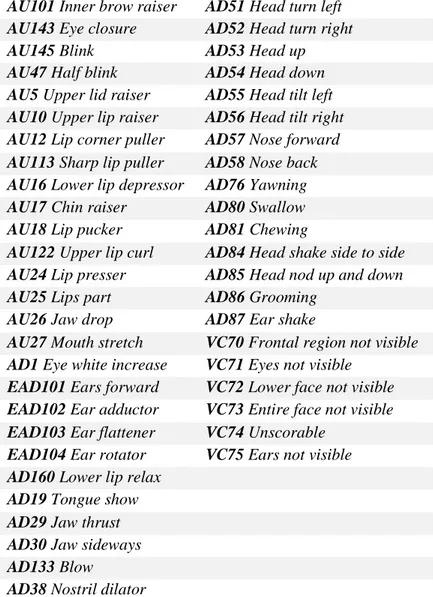
Table 1. Action units, action descriptors and visibility codes used for EquiFACS (Wathan et al., 2015)
AU101 Inner brow raiser AD51 Head turn left AU143 Eye closure AD52 Head turn right AU145 Blink AD53 Head up
AU47 Half blink AD54 Head down AU5 Upper lid raiser AD55 Head tilt left AU10 Upper lip raiser AD56 Head tilt right AU12 Lip corner puller AD57 Nose forward AU113 Sharp lip puller AD58 Nose back AU16 Lower lip depressor AD76 Yawning AU17 Chin raiser AD80 Swallow AU18 Lip pucker AD81 Chewing
AU122 Upper lip curl AD84 Head shake side to side AU24 Lip presser AD85 Head nod up and down AU25 Lips part AD86 Grooming
AU26 Jaw drop AD87 Ear shake
AU27 Mouth stretch VC70 Frontal region not visible AD1 Eye white increase VC71 Eyes not visible
EAD101 Ears forward VC72 Lower face not visible EAD102 Ear adductor VC73 Entire face not visible EAD103 Ear flattener VC74 Unscorable
EAD104 Ear rotator VC75 Ears not visible AD160 Lower lip relax
AD19 Tongue show AD29 Jaw thrust AD30 Jaw sideways AD133 Blow
MATERIAL AND METHODS Aim and hypothesis
The aim of this study is to describe how the different facial action units may cluster in horses with and without pain in order to describe the features of the equine pain face more objectively. The facial action units will be marked and compared in healthy horses and horses in pain to analyse how the different facial action units cluster in horses with and without pain.
The hypothesis is that certain facial action units are shown and cluster in a certain way when the horse is in pain.
Study design
Short videos of 28 horses with and without pain were used in this study. The first 12 recordings were previously filmed and used in a study by (Gleerup et al., 2015), where six horses, five mares and one gelding, aged 3-14 years were included. The last 16 films were clinical cases with different sources of pain, obtained of hospitalized horses. Owner consent was obtained by Dr Karina Bech Gleerup, Copenhagen University, Denmark. Filming occurred on a con-venience basis, where horses were filmed either before surgery for elective surgery of non-painful conditions or when admitted with supposedly non-painful conditions or after surgery. The first 12 films are an example of peracute nociceptive pain while the clinical cases show a more heterogeneous pain.
The films were blinded during coding and the keys to scorings were given afterwards. The last 16 films were rated by 42-45 participants consisting of veterinarians, nurses or lay persons, using an anonymous Mentometer equipment, after a teaching session on the equine pain face. Participants could choose between “no pain” or graduate pain response. Data were transferred to an Excel sheet. The no pain percentage was used to define the chance of no pain, while the reciprocal value was assigned as pain.
With the help of an ethogram according to EquiFACS, all videos were analysed by a certified EquiFACS reader, with 70% intra rating agreement, to secure the validity of the scoring. The annotation programme ELAN was used to mark the number of times as well as duration of Action Units (AU) or Action Descriptors (AD) could be seen in the videos. Visibility codes were also added to clarify how much of the horses face is seen at all times.
Analysis of data
The ADs, AUs, visibility codes as well as duration of the codes were exported to Microsoft Excel. Occurrence of each facial action was calculated and added to the file as well as illustrated in a bar graph (one graph for each video) and the duration of each code were shown on a circle chart (one chart for each video). The facial actions for each film as well as their occurrences and durations were plotted in a table and an appendix. Boxplots and dendrograms were made with Minitab, to illustrate the variation and similarities in frequency, duration and occurrence in different codes.
For this study, all of the facial expressions were analysed with a cluster analysis. The clusters were tested on films on horses with supposed spontaneous pain. In order to analyse the
clustering and importance of the scores, the 12 experimental films was performed. Principle component analysis (PCA) and linear discriminant analysis (LDA) were performed on each of four sets (frequency, total duration and normalized duration of each AU, both frequency and duration, and both frequency and normalized duration). For this, start-stop times of all actions were recorded and collected into one Excel sheet.
Linear regression on AU and AD was performed, using “leave on out”, to investigate the best set of scores for pain/no pain. This latter work was performed by Maheen Rashid, UC Davis, Ca, US.
RESULTS
A total of 28 films were coded. Visibility codes were excluded from the calculations and graphs for clarity. Film 27 was discarded due to lack of key to scorings.
Table 2. All occurrences, films 1-12
1 2 3 4 5 6 7 8 9 10 11 12 EAD101 1 4 10 9 6 5 0 9 6 5 6 2 EAD102 0 0 0 0 0 0 1 0 0 0 0 0 EAD103 0 0 0 1 0 0 0 0 0 0 0 0 EAD104 5 6 7 15 8 4 0 7 7 5 7 5 AU10 0 1 0 0 0 0 0 0 0 0 0 0 AU101 3 6 2 13 6 4 5 17 10 5 10 6 AU113 0 2 1 2 2 2 3 0 2 0 0 3 AU12 0 0 0 0 0 0 0 0 0 0 0 0 AU143 0 0 0 0 0 0 0 0 0 0 0 0 AU145 1 7 3 3 7 3 3 7 9 5 5 3 AU16 0 0 0 0 0 0 0 0 2 0 0 0 AU17 0 10 0 6 7 1 0 2 3 3 0 1 AU18 0 5 0 1 0 0 0 0 2 1 0 0 AU24 0 5 0 7 0 0 1 0 7 2 0 1 AU25 0 0 0 0 0 0 0 0 0 0 0 0 AU26 0 0 0 0 0 0 0 0 0 0 0 0 AU47 4 3 5 15 7 2 1 11 3 1 7 5 AU5 2 4 1 3 1 3 0 9 2 0 0 4 AUH13 0 0 1 1 1 0 1 2 0 0 3 2 AD1 4 5 4 3 3 3 0 7 2 0 0 4 AD133 1 0 0 0 0 0 0 0 0 0 0 0 AD160 0 0 0 0 1 0 0 0 0 0 0 0 AD19 1 2 0 0 0 0 0 1 0 0 4 0 AD29 0 0 0 0 0 0 0 0 0 0 0 0 AD30 0 0 0 0 0 0 0 0 0 0 0 0 AD38 0 8 1 10 3 3 3 5 5 0 7 8 AD51 4 3 4 4 2 3 0 4 2 1 3 0 AD52 0 3 2 4 2 2 2 7 4 3 2 1 AD53 0 2 1 3 1 0 0 1 3 0 3 2 AD54 0 2 1 3 3 0 1 0 5 0 1 2 AD55 0 0 0 0 0 0 0 0 0 0 0 0 AD56 0 0 0 0 0 0 0 0 0 0 0 0 AD57 1 1 0 1 1 0 0 0 3 1 0 4 AD58 0 0 0 1 0 0 0 0 3 0 1 2 AD76 0 0 0 0 0 0 0 0 0 0 0 0 AD81 1 2 0 0 0 0 0 1 0 0 4 0 AD84 0 0 0 0 0 0 0 0 0 0 0 0 AD85 0 0 0 0 0 0 0 0 0 0 0 0
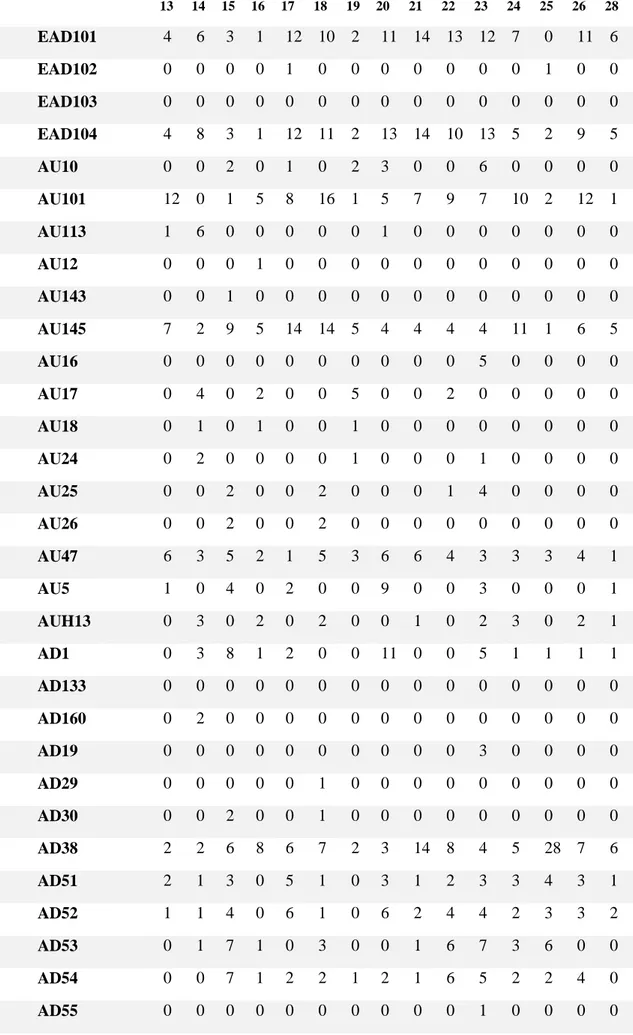
Table 3. All occurrences, films 13-28 13 14 15 16 17 18 19 20 21 22 23 24 25 26 28 EAD101 4 6 3 1 12 10 2 11 14 13 12 7 0 11 6 EAD102 0 0 0 0 1 0 0 0 0 0 0 0 1 0 0 EAD103 0 0 0 0 0 0 0 0 0 0 0 0 0 0 0 EAD104 4 8 3 1 12 11 2 13 14 10 13 5 2 9 5 AU10 0 0 2 0 1 0 2 3 0 0 6 0 0 0 0 AU101 12 0 1 5 8 16 1 5 7 9 7 10 2 12 1 AU113 1 6 0 0 0 0 0 1 0 0 0 0 0 0 0 AU12 0 0 0 1 0 0 0 0 0 0 0 0 0 0 0 AU143 0 0 1 0 0 0 0 0 0 0 0 0 0 0 0 AU145 7 2 9 5 14 14 5 4 4 4 4 11 1 6 5 AU16 0 0 0 0 0 0 0 0 0 0 5 0 0 0 0 AU17 0 4 0 2 0 0 5 0 0 2 0 0 0 0 0 AU18 0 1 0 1 0 0 1 0 0 0 0 0 0 0 0 AU24 0 2 0 0 0 0 1 0 0 0 1 0 0 0 0 AU25 0 0 2 0 0 2 0 0 0 1 4 0 0 0 0 AU26 0 0 2 0 0 2 0 0 0 0 0 0 0 0 0 AU47 6 3 5 2 1 5 3 6 6 4 3 3 3 4 1 AU5 1 0 4 0 2 0 0 9 0 0 3 0 0 0 1 AUH13 0 3 0 2 0 2 0 0 1 0 2 3 0 2 1 AD1 0 3 8 1 2 0 0 11 0 0 5 1 1 1 1 AD133 0 0 0 0 0 0 0 0 0 0 0 0 0 0 0 AD160 0 2 0 0 0 0 0 0 0 0 0 0 0 0 0 AD19 0 0 0 0 0 0 0 0 0 0 3 0 0 0 0 AD29 0 0 0 0 0 1 0 0 0 0 0 0 0 0 0 AD30 0 0 2 0 0 1 0 0 0 0 0 0 0 0 0 AD38 2 2 6 8 6 7 2 3 14 8 4 5 28 7 6 AD51 2 1 3 0 5 1 0 3 1 2 3 3 4 3 1 AD52 1 1 4 0 6 1 0 6 2 4 4 2 3 3 2 AD53 0 1 7 1 0 3 0 0 1 6 7 3 6 0 0 AD54 0 0 7 1 2 2 1 2 1 6 5 2 2 4 0 AD55 0 0 0 0 0 0 0 0 0 0 1 0 0 0 0
AD56 0 0 1 0 0 1 0 0 0 1 3 0 1 0 0 AD57 0 0 3 0 3 4 0 4 2 3 0 0 1 3 0 AD58 0 0 2 0 0 0 0 1 0 1 1 0 0 0 0 AD76 0 0 1 0 0 0 0 0 0 0 0 0 0 0 0 AD81 0 0 1 0 0 3 1 0 0 2 4 0 0 0 0 AD84 0 1 0 0 0 0 0 0 0 0 0 0 0 0 0 AD85 0 0 1 1 0 0 0 0 0 0 0 0 0 0 0
Differences in individual facial actions between horses in pain and not in pain
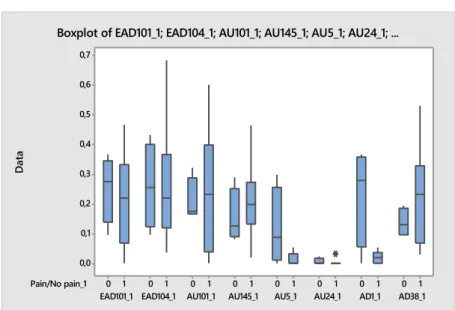
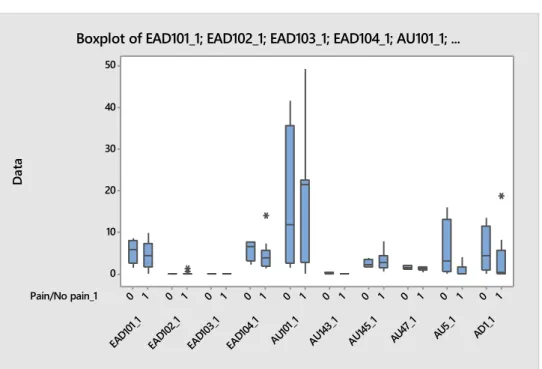
Boxplots were made of selected facial actions (AU101, EAD101, EAD104, AU145, AU24, AU5, AD1 and AD38), upper and lower facial actions as well as ear movements. The facial actions were selected on the basis of Gleerups and Dalla Costas pain scales. These boxplots include frequency (how often), duration (how long) and occurrences (how many times) of each facial action. The results were also divided in “pain”(1) and “no pain”(0) categories. The boxplots were made to illustrate distribution in frequency, duration and occurrence.
When investigating boxplots for selected facial actions and their frequency (Figure 1 and 2), there was quite a lot of variability between codes and pain groups. Biggest differences in frequency were seen in AU101 (Inner brow raiser) in clinical cases (Figure 2), where painful horses had a lot of variation compared to non-painful horses. There were also higher frequencies of AU101 in the pain group.
Figure 1. Boxplot of relevant facial actions, frequency, trained horses. Data: occurrence/s. Pain/No pain_1 AD38_1 AD1_1 AU24_1 AU5_1 AU145_1 AU101_1 EAD104_1 EAD101_1 1 0 1 0 1 0 1 0 1 0 1 0 1 0 1 0 0,6 0,5 0,4 0,3 0,2 0,1 0,0 D at a
Figure 2. Boxplot of relevant facial actions, frequency, clinical cases.
Duration of selected facial actions showed biggest variation in AU101 in both film groups but only the painful group of trained horses had longer durations (Figure 3). Biggest variations were between pain/no pain in AD1 (Eye White Increase) and AD38 (Nostril Dilator).
Upper facial actions showed a lot of general variation in occurrence. Frequencies were much shorter in clinical cases. In duration, AU101 spiked in both film groups. Bigger variation in AU5 (Upper Lid Raiser) was seen in the no pain group in clinical cases as well as AD1, where the no pain group had longer durations.
Figure 3. Boxplot of upper facial actions, duration, trained horses. Pain/No pain_1 AD38_1 AD1_1 AU24_1 AU5_1 AU145_1 AU101_1 EAD104_1 EAD101_1 1 0 1 0 1 0 1 0 1 0 1 0 1 0 1 0 0,7 0,6 0,5 0,4 0,3 0,2 0,1 0,0 D at a
Boxplot of EAD101_1; EAD104_1; AU101_1; AU145_1; AU5_1; AU24_1; ...
Pain/No pain AD1 AU5 AU47 AU145 AU101 EAD104 EAD103 EAD102 EAD101 1 0 1 0 1 0 1 0 1 0 1 0 1 0 1 0 1 0 30 25 20 15 10 5 0 D at a
Figure 4. Boxplot of upper facial actions, duration, clinical cases .
There were big differences in lower facial actions between the two different film groups. The occurrence of lower facial actions in clinical cases was smaller than in trained horses. The frequencies and occurrences had the same trend. Trained horses had more differences between pain groups than clinical cases. Most noticeable differences were between pain and no pain in AU17 (Chin raiser), AU24 (Lip presser), AD38 (Nostril dilator) and AD81 (Chewing), which can be seen in boxplots for duration (Figure 5 and 6), frequency and occurrence.
Figure 5. Lower facial actions, duration, clinical cases. Pain/No pain_1 AD1_1 AU5_ 1 AU47 _1 AU145 _1 AU143 _1 AU10 1_1 EAD1 04_1 EAD1 03_1 EAD1 02_1 EAD1 01_1 1 0 1 0 1 0 1 0 1 0 1 0 1 0 1 0 1 0 1 0 50 40 30 20 10 0 D at a
Boxplot of EAD101_1; EAD102_1; EAD103_1; EAD104_1; AU101_1; ...
Pain/No pain AD81 AD38 AD19 AUH13 AU24 AU18 AU17 AU113 1 0 1 0 1 0 1 0 1 0 1 0 1 0 1 0 40 30 20 10 0 D at a
Figure 6. Lower facial actions, duration, trained horses.
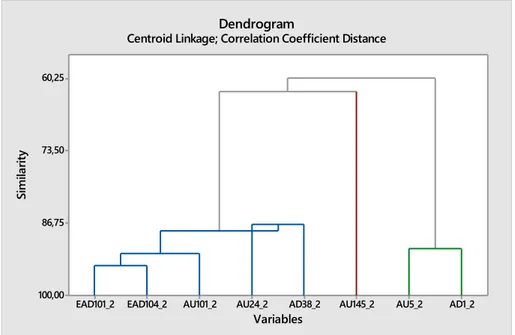
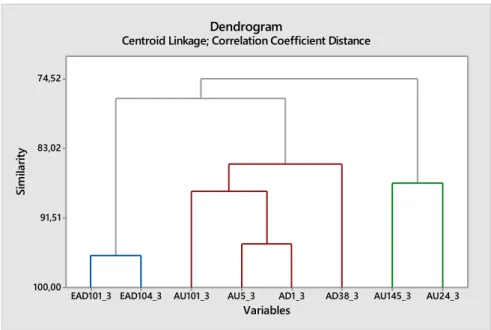
Dendrograms were made to illustrate clustering of the codes and their similarity levels (Figure 7 and 8). The dendrograms were divided according to film group, duration and frequency. The facial actions were divided to “pain” and “no pain”. The facial actions chosen to be illustrated were upper and lower facial actions and the selected codes used in boxplots. Three clusters were used in each dendrogram instead of 2 to get more homogenous groups. EAD101 (Ears forward) and EAD104 (Ear rotator) were usually close together in most of the dendrograms. AU17 and AU24 had also similarities in many dendrograms. For duration of selected facial actions in clinical cases, AU101 and AD38 paired in painful horses. There were not really any pairings in frequency for painful horses in clinical cases. For lower facial codes and their duration, the trained horses had pairing in AU113 (Sharp lip puller) and AU17. For frequency, AU24 and AD38 were close in painful horses.
Figure 7. Relevant facial actions, frequency, PAIN, trained horses.
Pain/No pain_1 AD81_1 AD38_1 AD19_1 AUH13_1 AU24_1 AU18_1 AU17_1 AU113_1 1 0 1 0 1 0 1 0 1 0 1 0 1 0 1 0 14 12 10 8 6 4 2 0 D at a
Boxplot of AU113_1; AU17_1; AU18_1; AU24_1; AUH13_1; AD19_1; ...
AD1_2 AU5_2 AU145_2 AD38_2 AU24_2 AU101_2 EAD104_2 EAD101_2 60,25 73,50 86,75 100,00 Variables Si m ila rit y Dendrogram
Figure 8. Relevant facial actions, frequency, NO PAIN, trained horses.
Cluster analysis
In order to determine whether there was a difference in frequency between horses with pain and no pain, a two sample t test was calculated for codes EAD101, EAD104, AU101, AU145, AU24, AU5, AD1 and AD38 in all 27 films (Table 4). The chosen codes were frequently seen in almost all films. The only statistically significant (P<0,05) code was AD38.
Table 4. P-values for relevant codes
EAD101 EAD104 AU101 AU145 AU24 AU5 AD1 AD38
P-value
0,999 0,103 0,835 0,651 0,682 0,487 0,265 0,027
Linear discriminant and principal component analysis
The duration of a feature was the best classification. The linear discriminant analysis showed a 92% correct classification in pain/no pain. The duration of each parameter showed better classification than the frequency. (Figures 9 and 10)
The principal component analysis showed no variability between the codes.
AU24_3 AU145_3 AD38_3 AD1_3 AU5_3 AU101_3 EAD104_3 EAD101_3 74,52 83,02 91,51 100,00 Variables Si m ila rit y Dendrogram
Figure 9. The parameters least correlated to pain.
Figure 10. The parameters most correlated to pain.
Visualising Action Units and their occurrences together
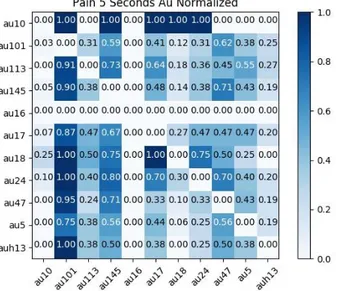
In order to visualize and identify Action Units that occur together, heatmaps were made (Figures 11 and 12). Every video was broken up in 2, 5, 10, 15, and 30 second pieces to see if an Action Unit was present during that time slot. The co-occurrence was counted (i.e. how many times a unit was present, and if another unit was present as well).
Figure 11. Heatmap of the 5-second-slot. Horses in pain. By M. Rashid (2018).
An example of these occurrence similarities can be seen in Figure 11, where AU10 (Upper lip raiser) occurs once with AU101 (Inner brow raiser) in a five second interval.
The total number of times an Action Unit occurred was normalized. AU10 only occurs once in videos with painful horses, which means that it has a 100% co-occurrence rate with all of the mentioned Action Units, shown in Figure 12.
Figure 12. Heatmap of normalized Action Units in the 5-second-slot. Horses in pain. By M. Rashid
(2018).
Action Units that were pain discriminative were AU10, AU18 (Lip pucker), AU24 (Lip presser) and AU17 (Chin raiser). Possible Action Units that were pain discriminative were AU101 and AU145 (Blink).
Head and ear movement
According to the pain scales, the painful horse tends to pull its ears back, rotate and sometimes flatten them, which would, in these films, show itself as a decrease in occurrence of EAD101. Differences between painful and non-painful horses were small. EAD104 had slightly higher
mean frequency and duration than EAD101 (Table 5). In non-painful horses, this was vice versa.
Table 5. Mean frequencies and durations of ear movements
EAD101 (pain) EAD104 (pain) EAD101 (no pain)
EAD104 (no pain)
Mean frequency 0,202 0,265 0,202 0,1792
Mean duration 3,74 4,33 4,33 4,07
The difference in occurrence between film groups was noticeable (Figures 13 and 14).
Figure 13. Ear movements, occurrence, films 1-12.
Figure 14. Ear movements, occurrence, films 13-28.
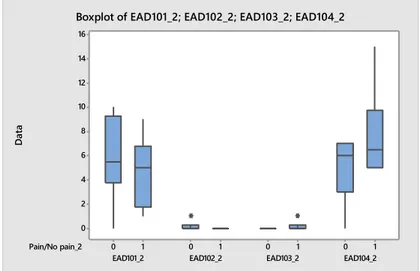
There were no bigger differences in duration or frequency of head movements between painful and non-painful horses (Figures 15 and 16). AD51-54 had longer durations than the rest of the codes. Frequencies were quite short, the longest ones being around 0,15 seconds.
Pain/No pain_2 EAD104_2 EAD103_2 EAD102_2 EAD101_2 1 0 1 0 1 0 1 0 16 14 12 10 8 6 4 2 0 D at a
Boxplot of EAD101_2; EAD102_2; EAD103_2; EAD104_2
P/NP EAD104a EAD103a EAD102a EAD101a 1 0 1 0 1 0 1 0 14 12 10 8 6 4 2 0 D at a
Figure 15. Head movements, duration, all films.
Figure 16. Head movements, frequency, all films.
Keys to scorings
Table 6. Key to scorings of films 1-12 (trained horses). By Karina Bech Gleerup
Film Pain/No pain
1 Pain 2 Pain 3 No pain 4 Pain 5 Pain 6 No pain 7 No pain 8 No pain 9 No pain 10 No pain 11 Pain 12 Pain Pain/No pain AD58 AD57 AD56 AD55 AD54 AD53 AD52 AD51 1 0 1 0 1 0 1 0 1 0 1 0 1 0 1 0 9 8 7 6 5 4 3 2 1 0 D at a
Boxplot of AD51; AD52; AD53; AD54; AD55; AD56; AD57; AD58
Pain/No pain_1 AD58_1 AD57_1 AD56_1 AD55_1 AD54_1 AD53_1 AD52_1 AD51_1 1 0 1 0 1 0 1 0 1 0 1 0 1 0 1 0 0,5 0,4 0,3 0,2 0,1 0,0 D at a
Table 7. Key to scorings of clinical cases (Pia Haubro Andersen and Karina Bech Gleerup data). Pain
segment (2 sec film segments) percentage in each calculated by M. Rashid (2018). p: Pain, b: Borderline, n: No pain.
Film Pain No pain Pain segm., % Interpr. 13 84% 16% 46,67 14 65% 35% 66,67 p 15 26% 74% 53,33 b 16 96% 4% 53,33 b 17 75% 25% 20,00 18 100% 0% 60,00 p 19 90% 10% 53,33 b 20 49% 51% 6,67 n 21 90% 10% 66,67 p 22 48% 52% 33,33 23 35% 65% 60,00 p 24 70% 30% 46,67 b 25 98% 2% 13,33 26 80% 20% 40,00 28 82% 18% 60,00 p
In this case, anything over 50% is considered pain due to strong tendencies. The pain segments were calculated to get a more objective pain evaluation and to compare it to the scorings made by participants.
A probability plot was made to illustrate the difference in probability between positive pain rates in clinical cases and number of pain segments. (Figure 17).
Figure 17. Probability plot, positive pain rates vs. number of pain segments. By Pia Haubro Andersen
DISCUSSION
Painful vs. Non-painful horses
Dalla Costa and Gleerup describe the equine pain face with stiffly backwards or low and/or asymmetrical ears, orbital tightening, tension above the eye area with angled appearance, a withdrawn and/or tense stare, prominent strained chewing muscles, mouth straining and pronounced chin, strained or dilated nostrils and flattening of the profile as well as tension of the lips, chin and certain facial muscles. In this study, the frequency of AD38, or dilated nostrils, was the only statistically significant facial action. This strengthens the hypothesis that the relevant codes have connection to equine pain face and that they could be used in pain scoring.
Many of the relevant codes lacked statistical difference when comparing frequency and duration. The sample size was very small in this study. It is also known that there are individual differences how the horses show pain (de Grauw & van Loon, 2016).
In order to make a pain face, several AUs and ADs needs to be shown at the same time. This means that there will be a lot of extra facial actions, and that a more complicated statistical approach is needed that identifies when certain units are grouped together or whether it actually is possible to use the parameters to classify horses in pain/no pain. The linear discriminant analysis showed that EquiFACS can discriminate almost correctly, while the frequency and duration analysis of single parameters cannot provide classification.
The scorings in films are better than still images, as used in the Horse Grimace Scale. This is due to duration of individual features that showed a better discrimination between pain and no pain. Complex and multivariate statistical analysis are necessary to determine pain from video. Clipping the film in shorter segments could increase probability of catching the moment where the horse displays all features of the pain face at the same time. The first two features did not catch much of the variation in the data for PCA.
Trained horses vs. clinical cases
The films in this study were filmed in two different settings. The first twelve films are filmed in an experimental setting, where the horses were trained to stand still in front of the camera. The rest of the films were filmed in a clinical setting, i.e. animal hospital. Stress-induced analgesia is a response in mammals in which stressful or fearful stimuli cause analgesia. It is believed to be caused by endogenous opioids through descending inhibitory pain pathways as well as the amygdala, periaqueductal grey, and rostral ventromedial medulla. There is also stress-induced hyperalgesia, in which stressful stimuli increases pain perception. It is believed to be due to activation of pain-facilitating neurons in medulla and stimulation of the dorsomedial nucleus of the hypothalamus. (Wagner, 2010) In this study, horses in films 1-12 were trained to stand in a familiar environment. Films 13-28 were clinical cases, where the individuals were in an unfamiliar environment surrounded by other horses. When comparing mean occurrences between film groups, higher facial codes were seen more often in group 13-28. However, in lower facial actions, the films 1-12 had higher means. The higher means of upper facial actions may be due to unfamiliar surroundings and movement from other horses and humans, which makes the horses look around and hence move their eyes and ears. There has also been evidence that horses in pain seek human contact (Gleerup et al., 2015).
Comparing pain scoring results made by people and artificial intelligence
When comparing human-made scorings with the computer calculated pain segments, one has to remember that pain evaluation is subjective. What is more, the people scoring these videos had only had a short introduction to equine pain face, which makes the results even more unreliable. Computer calculated pain evaluation is considered to be a more objective way compared to human-made pain evaluation.
Limitations and advantages
Limitations in this study were small sample size and just one person coding, which makes the results very subjective and possibly biased. However, in order to be certified in EquiFACS an intraobserver reliability of at least 70% is required. There are also no intensity scales in coding with EquiFACS, which makes recognizing the pain very black and white and might increase the risk of missing painful facial actions in mild pain. However, this could minimize the confusion of “grey zones”. In order to increase accuracy in the clinical setting, multimodal pain assessment might be needed.
Further advantages with this method is increased objectivity. It can also take away the risk of the horse changing its behaviour due to human contact because the pain face can be filmed with a stationary camera. There is also a possibility for real-time analysis.
Future uses of EquiFACS in pain scoring
More studies and bigger sample sizes are needed to get statistical significance, but the EquiFACS has potential to be used as a tool for objective pain scoring. The goal is to teach a data system to recognize facial action descriptors during pain face, preferably on moving images instead of still pictures that are prone to selection bias (Andersen et al., 2018). There has already been promising results in computerized facial recognition in humans and 100% accuracy has been found on emotion classification in real-time (Littlewort et al., 2007). In order to use facial action units in pain assessment, facial keypoints need to be registered to help machine learning in recognition of painful facial expressions. Keypoints can also be used to extract features around parts that visually change when facial action units activate, hence making the actions more distinct (Andersen et al., 2018). More training data is needed in order to perfect machine learning.
CONCLUSION
According to the results, neither frequency nor the duration of single facial expressions can discriminate between pain and no pain in horses. However, according to the linear discriminant analysis of EquiFACS parameters of only 6 horses classifies pain and no pain with a probability of 92%. The duration of painful or non-painful facial actions were classified as better than the frequency. Further studies with larger sample sizes are needed in order to confirm significance of EquiFACS in pain assessment.
ACKNOWLEDGEMENTS
I would like to thank Pia Haubro Andersen for an exciting journey in the world of pain evaluation and also for the huge amount of support and kind words which helped me through the jungle of pain scales, facial action codes and complicated statistical approaches. I want to also express my gratitude to Maheen Rashid for the statistical analysis and Katrina Ask for helping me with some tricky facial actions.
Lastly I want to thank Frida Johnsson for the support and motivation during these dark autumn months. Without you (and the gallons of tea) this dissertation would not have been possible.
POPULAR SCIENCE SUMMARY
Pain assessment/evaluation is extremely important in animals because they cannot verbalise how they are feeling. It is also needed because it is a welfare issue; animals should have freedom from pain, injury and disease. It is important in order for the veterinary personnel to see if the animal answers to treatment. There is no universally good pain assessment scale because horses have individual differences in pain behaviour and expressions, and therefore there is no baseline for comparison.
Pain assessment
The most common ways to measure pain are behavioural and physiological parameters. They are fast to measure and specific behaviour is seen in several species. Examples for pain-specific behaviour are changes in posture, appetite, changes in eye expression and restlessness. However, some things affect measuring behaviour, such as type of injury and stress. Physiological measures, such as heart and respiratory rate are being used in practice but do not always show how much pain the animal really feels. They are also easily influenced by stress and medication. They do not work on their own but can be added to a scale that includes behavioural components. Stress hormones are easily influenced by factors other than pain and are considered unreliable.
Pain assessment through facial expressions is being used in humans (infants) and several species, such as horses, rabbits and rodents.
Advantages of pain assessment are increasing observers ability to recognize and quantify pain and thus improving patient care and pain relief. Limitations include inability to compare pain reactions between species and breeds. The body has own pain relief peptides that might mask the pain results.
Physiological parameters and behaviour are being used in pain assessment in horses. In order to score correctly one must know normal horse behaviour. Facial expressions are used in grimace scales and other pain scales, such as Equine Pain Scale, where the equine pain face can be defined with low or asymmetrical ears, an angled appearance of the eyes, a withdrawn and/or tense stare, sideways dilated nostrils and tension of the lips, chin and certain facial muscles.
Artificial intelligence is being used in pain assessment in humans. The computer recognizes facial expressions and can identify patterns based on a collection of examples. Facial action units have been used to measure postoperative pain in humans. The results showed that facial action units and computers can be used in pain evaluation. This has not yet been done in horses but it is possible in theory.
EquiFACS
Equine Facial Action Coding System (EquiFACS) is a systematic method for identifying and coding facial expressions based on the underlying facial musculature and muscle movement. Each facial movement is divided to designated codes called Action Units (AU) and action descriptors (AD). For example, a blink is coded AU145.
Aim and study design
The aim of this study is to describe how the different facial action units occur closely together in horses with and without pain. The reason for this is to describe the equine pain face more objectively. The hypothesis is that certain facial action units are shown and that they group in a certain way when the horse is in pain.
Twenty eight short (30-180 s) videos of horses with and without pain were coded by a certified EquiFACS reader. Films 1-12 were of horses from an experiment where pain was induced, while films 13-28 were of clinical cases, i.e. horses that were admitted to the hospital due to illness. The coder was blinded and did not know which horse was in pain during coding to minimize bias.
All Action Units (AU) and Descriptors (AD) were exported to Microsoft Excel. Frequency (how often the action is seen) and duration (how long the action is seen) of each AU and AD were calculated. The results were shown in different figures (boxplots and dendrograms) in order to illustrate distribution in frequency, duration and occurrence in painful and non-painful horses. Dendrograms are branching diagrams that represent the relationship of similarity among a group. In this case, it shows if the facial action units have any similarities in horses with and without pain. A two-sample t test was done on selected facial action units that resemble the equine pain face in order to see if there was any scientific evidence that the facial actions actually are shown more often in painful horses.
Results
The only facial action unit that was statistically significant, and thus confirmed that there was difference in pain and no pain, was AD38 (dilated nostrils). Common similarities in dendrograms were EAD101 and EAD104 (ears rotating forward and back) and AU5 and AD1 (Upper lid raiser and Eye white increase).
Linear discriminant analysis (LDA) and Principal component analysis (PCA) were conducted. LDA was used in order to find a linear combination of features that characterizes the equine pain face. PCA converts variables (in this case the facial actions) into a set principal components (a set of linearly uncorrelated variables) and was used to visualize relatedness between facial actions. The LDA showed a 92% correct classification in duration of pain and no pain.
Computer calculated pain segments were made of the clinical cases to compare man-made versus computer made keys to scorings. Pain assessment made by a computer is considered more objective compared to human-made, because pain assessment is so subjective.
Discussion
The equine pain face consists of several different facial expressions. However, no single facial action can determine whether a horse is in pain or not. The lack of significance between painful and non-painful horses was believed to be due to a small sample size. It is also known that horses show pain differently depending on individual and the cause of pain and do not show the same facial actions. Stress is a factor that might alter how horses show pain. Stress-induced analgesia is a response in which stress causes the body to release the body’s own opioids which
works as a pain killer. There is also a opposite reaction to stress, called stress-induced allodynia, where stress causes increased pain sensitivity.
The limitations in this study were small sample size and possible bias due to one person coding. The advantage is that using EquiFACS in pain assessment gives more objective results. Further research is needed but there is a possibility that Facial Action Coding System can be used when teaching machines to recognise painful facial expressions in horses.
REFERENCES
Andersen, P.H., Gleerup, K.B., Wathan, J., Coles, B., Kjellström, H., Broomé, S., Lee, Y.J., Rashid, M., Sonder, C., Rosenberger, E., Forster, D. (2018). Can a machine learn to see horse pain? An interdisciplinary approach towards decoding of facial expressions of pain in the horse. Editors: Spink, A.J. et al. Proceedings of Measuring Behavior 2018. Manchester, UK, 6-8 June 2018 Anil, S.S., Anil, L., Deen, J. (2002). Challenges of pain assessment in domestic animals. Journal of
the American Veterinary Medical Association, 220, 313–319.
https://doi.org/10.2460/javma.2002.220.313
Ashley, F.H., Waterman-Pearson, A.E., Whay, H.R. (2010). Behavioural assessment of pain in horses and donkeys: application to clinical practice and future studies. Equine Veterinary Journal, 37, 565–575. https://doi.org/10.2746/042516405775314826
Ashraf, A.B., Lucey, S., Cohn, J.F., Chen, T., Ambadar, Z., Prkachin, K.M., Solomon, P.E. (2009). The painful face – Pain expression recognition using active appearance models. Image and Vision
Computing, Special issue: Visual and multimodal analysis of human spontaneous behaviour, 27,
1788–1796. https://doi.org/10.1016/j.imavis.2009.05.007
Bartlett, M.S., Littlewort, G.C., Frank, M.G., Lee, K. (2014). Automatic decoding of facial movements reveals deceptive pain expressions. Current Biology, 24, 738–743.
https://doi.org/10.1016/j.cub.2014.02.009
Bufalari, A., Adami, C., Angeli, G., Short, C.E. (2007). Pain assessment in animals. Veterinary
Research Communications, 31, 55–58. https://doi.org/10.1007/s11259-007-0084-6
Bussières, G., Jacques, C., Lainay, O., Beauchamp, G., Leblond, A., Cadoré, J.-L., Desmaizières, L.-M., Cuvelliez, S.G., Troncy, E. (2008). Development of a composite orthopaedic pain scale in horses. Research in Veterinary Science, 85, 294–306. https://doi.org/10.1016/j.rvsc.2007.10.011 Caeiro, C.C., Waller, B.M., Zimmermann, E., Burrows, A.M., Davila-Ross, M. (2013). OrangFACS:
A muscle-based facial movement coding system for Orangutans (Pongo spp.). International
Journal of Primatology, 34, 115–129. https://doi.org/10.1007/s10764-012-9652-x
Cambridge, A.J., Tobias, K.M., Newberry, R.C., Sarkar, D.K. (2000). Subjective and objective measurements of postoperative pain in cats. Journal of the American Veterinary Medical
Association, 217, 685–690. https://doi.org/10.2460/javma.2000.217.685
Coles, B.A. (2016). No pain, more gain? Evaluating pain alleviation post equine orthopedic surgery
using subjective and objective measurements. Swedish University of Agricultural Sciences. The
Veterinary Medicine Programme (Degree Project, 30 hp, 2016:41)
Craig, K.D., Grunau, R.V., Aquan-Assee, J. (1988). Judgment of pain in newborns: Facial activity and cry as determinants. Canadian Journal of Behavioural Science/Revue canadienne des sciences du
comportement, 20, 442–451. https://doi.org/10.1037/h0079934
Craig, K.D., Patrick, C.J. (1985). Facial expression during induced pain. Journal of Personality and
Social Psychology, 48, 1080–1091. https://doi.org/10.1037/0022-3514.48.4.1089
Dalla Costa, E., Minero, M., Lebelt, D., Stucke, D., Canali, E., Leach, M.C. (2014). Development of the horse grimace scale (HGS) as a pain assessment tool in horses undergoing routine castration.
PLoS ONE, 9, e92281. https://doi.org/10.1371/journal.pone.0092281
de Grauw, J.C., van Loon, J.P.A.M. (2016). Systematic pain assessment in horses. The Veterinary