J
Ö N K Ö P I N GI
N T E R N A T I O N A LB
U S I N E S SS
C H O O L JÖNKÖPING UNIVERSITYChinese Cross-listing
Corpora-tions Performance Study
f o c u s o n U . S . a n d M a i n l a n d C h i n a m a r k e t s
Master’s thesis within Finance
Author: Jing Chu Tutor: Johan Eklund Tina Wallin Jönköping [May 2013]
i
[Master’s] Thesis in [Finance]
Title: Chinese cross-listing corporations performance study: focus on U.S. and Mainland China market
Author: Jing Chu
Tutor: Johan Eklund
Tina Wallin
Date: [2013-05-17]
Subject terms: cross-listing, company performance, event study, ordinary least square
Abstract
The purpose of this paper is to investigate the impact of cross-listing on companies’ per-formance. It is divided into two aspects, one in short-term and the other in long-term. In short-run study, 6 companies’ each abnormal return from 10 days before and after list-ing date has a tendency. In pcross-listlist-ing period, the ARs are mostly positive and re-main stable around 0; but on the cross-listing day, some of the companies’ ARs decline however some do not; and after that day, the ARs still fluctuate around 0 while most of them are negative. In long-run study, By using multiple regression on 99 Chinese com-panies listed in U.S. market from 2007 to 2012, there is a significant positive relation-ship between TAT and CL at 5% significance level and the MV is significant negative with CL at 10% significance level; ROE and ROA are both positive with CL, but not significant.
ii
Table of Contents
1 INTRODUCTION ... 1
2 BACKGROUND ... 2
2.1 BACKGROUD OF CROSS-LISTING,A SHARES AND B SHARES ... 2
2.2 CHINESE STOCK EXCHANGES &UNITED STATES STOCK EXCHANGES... 3
2.2.1 Chinese Stock Exchanges ... 3
2.2.2 United States Stock Exchanges ... 4
2.3 CURRENT STATUS OF CROSS-LISTING ... 5
2.3.1 Current status of cross-listing all over the world ... 5
2.3.2 Current status of cross-listing in China ... 7
3 PREVIOUS STUDIES ... 9
3.1 EFFECT OF CROSS-LISTING ON CORPORATIONS’ ABNORMAL RETURN ... 9
3.2 EFFECT OF CROSS-LISTING ON CORPORATIONS’ MARKET VALUE ... 10
3.3 CORPORATIONS’ PERFORMANCE IN A LONG-TERM ... 11
3.3.1 Effect of cross-listing on firm’s performance in a long-term ... 11
3.3.2 The long-run performance of listed companies ... 11
3.4 OTHER RESEARCHES ABOUT CROSS-LISTING ... 12
3.4.1 Effects on stock system risk ... 12
3.4.2 Cross-listing effects on local capital markets... 12
4 CORPORATIONS’ PERFORMANCE STUDY IN SHORT-TERM ... 14
4.1 METHODOLOGY ... 14
4.2 SAMPLE AND DATA SELECTION ... 15
4.2.1 Event date determining ... 15
4.2.2 Sample selection ... 16
4.2.3 The abnormal returns calculation ... 16
4.3 EMPIRICAL RESULTS ... 17
4.4 ANALYSIS OF THE EMPIRICAL RESULTS ... 21
5 CORPORATIONS’ PERFORMANCE STUDY IN LONG-TERM ... 23
5.1 METHODOLOGY ... 23
5.1.1 Indicators selection ... 24
5.1.2 Sample and Data ... 25
5.1.3 Regression Functions ... 25
5.2 EMPIRICAL RESULTS AND ANALYSIS ... 26
6 CONCLUSIONON ... 29
7 REFERENCES ... 30
APPENDIX 1 ... 35
APPENDIX 2 ... 38
iii
THE LIST OF TABLES
Table 1: Chinese cross-listing companies statistic. ... 8
Table 2: Regression results ... 27
Table 3: List of the Chinese cross-listing companies in U.S. market ... 35
Table 4: Average abnormal return cumulative average abnormal return and their T-statistics table for the whole companies in the sample. ... 38
Table 5: Abnormal return and cumulative abnormal return and their T-statistics table for ACH ... 39
Table 6: Abnormal return and cumulative abnormal return and their T-statistics table for LFC ... 40
Table 7: Abnormal return and cumulative abnormal return and their T-statistics table for ZNH ... 41
Table 8: Abnormal return and cumulative abnormal return and their T-statistics table for GSH ... 42
Table 9: Abnormal return and cumulative abnormal return and their T-statistics table for NHP ... 43
Table 10: Abnormal return and cumulative abnormal return and their T-statistics table for PTR ... 44
Table 11: Regression Results ... 45
Table 12: Unit root test ... 46
Table 13: Cointegration test ... 47
THE LIST OF FIGURES
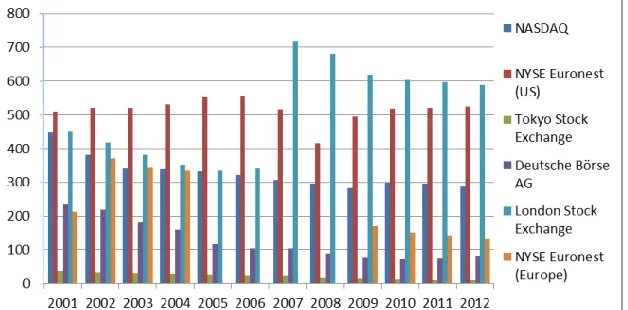
Figure 1: The number of overseas companies listed in main global stock exchanges. ... 5Figure 2: The ratio of values of share trading of overseas listed companies in the main global stock exchanges. ... 6
Figure 3: Average abnormal returns and cumulative average abnormal returns for whole sample ... 18
Figure 4: Abnormal returns and cumulative abnormal returns for ACH ... 18
Figure 5: Abnormal returns and cumulative abnormal returns for LFC ... 19
Figure 6: Abnormal returns and cumulative abnormal returns for ZNH ... 19
Figure 7: Abnormal returns and cumulative abnormal returns for GSH ... 20
Figure 8: Abnormal returns and cumulative abnormal returns for HNP ... 20
Figure 9: Abnormal returns and cumulative abnormal returns for PTR ... 21
1
1 Introduction
From 1970s, the global economy integration progresses increasingly, hence it also pro-motes capital market integration. It is more convenient for the International capital li-quidity; Corporations collect capital in global capital market. Simultaneously in order to contend for resource and investors, the main securities exchanges in the world decrease transaction costs and provide convenience, thus it is easy for firms to be listed in the domestic and overseas securities exchanges, which is cross listing. With the increasing number of cross-listing companies, the impact of cross-listing for companies’ perfor-mance becomes a significant research.
Based on 4 hypothesis about the reason why the companies choose cross-listing: Market Segmentation Hypothesis (Stapleton & Subrahmanyan, 1977); Liquidity Hypothesis (Amihud & Mendelsohn, 1986); Investor Recognition Hypothesis (Merton, 1987); Bond Hypothesis (Coffee, 1999), these scholars figure that cross-listing can improve the com-panies’ market values. But is this conclusion suitable for Chinese companies?
Therefore, the investigation focuses on the Chinese cross-listing companies listed in the U.S. market. The Mittoo (2003) research results figure out that the impact of cross-listing in short-term and long-term preference are significant different. Hence, the inves-tigation is divided into two parts, one is in short-term and the other is in long-term. In short-term study, I use event study which the event window is from 10 days before and 10 days after event date to observe 6 cross-listing companies’ abnormal return and cumulative abnormal return. In long-term study, I use an ordinary least square model to run panel data analysis on a total of 99 companies, where 24 are cross-listing companies and 75 are non-cross-listing companies in the years of 2007 to 2012. I observe the rela-tionship between cross-listing and company’s profitability factors which are return on equity, return on assets, total asset turnover and market value to interpret the impact of cross-listing on companies’ performance.
2
2 Background
2.1 Backgroud of cross-listing, A shares and B shares
Cross listing (also termed “secondary listing”) is a firm issued its initial shares on one exchange, and then issued them in another or multiple stock exchanges; namely it is a firm’s stock can be traded on two and more exchange markets located in different coun-tries (Onyuma, Mugo & Karuiya, 2012). There are still two correlative concepts: cross border listing and dual listing. Cross border listing is defined as an offering or listing of securities is directed to one or more countries other than the company's home country
(whether or not the offering or listing also is being made concurrently in the company's home country) (International Organization of Securities Commissions, 1998, p. 4). A
firm listed its security on more than one exchange; this phenomenon is termed “dual listing” (Scott, 2003).
Although “cross listing” and “dual listing” are usually used interchangeably, there is still a tiny distinction between them. A dual listing is similar to a merger. When two or more companies agree to combine their operations, but continue to have their own iden-tities, namely the companies do not convert respective shares into the other, but their shareholders profit by the combined companies; it belongs to “dual listing” (Vassallo & Christensen, 2010).
It can be known from description above that a firm that is cross border listing does not necessarily list its share on two or more stock exchanges located in different countries. If a firm listed on two or more stock exchanges located in domestic and foreign coun-tries or only foreign councoun-tries, it is termed “cross listing”.
The stocks issued in Chinese exchange market have special names, so it is necessary to explain them in the following.
Stocks in Chinese exchange market are divided into Class A Shares and Class B shares. A Shares can be invested by domestic investors as well as Qualified Foreign
Institution-3
al Investors (QFIIs)1, while both domestic and foreign investors can invest in B Shares (Shanghai Stock Exchange).
2.2 Chinese Stock Exchanges & United States Stock Exchanges
2.2.1 Chinese Stock Exchanges
In Mainland China capital market, there are two main stock exchanges, one is Shanghai Stock Exchange (SSE) and the other is Shenzhen Stock Exchange (SZSE).
SSE was founded on November 26th 1990 and in operation on December 19th the same year. After over 21 years’ operation, by April 10th
2013, there were 954 listed compa-nies on SSE with 944 Class A Shares and 54 Class B Shares. By the end of the year of 2012, there were 998 listed stocks on SSE with a total market capitalization of RMB 15,869.844 billion, increasing by 6.96% year-on-year, and free-float market capitaliza-tion of RMB 13,429.445 billion, up 9.31% from the previous year (Shanghai Stock Ex-change).
SZSE established on 1st December 1990. It includes the Small-Medium Enterprises (SME) board and the ChiNext2 market. By the April 11th 2013, there were total 1579 listed stocks on SZSE, in which there were 470 Class A Shares, 53 Class B Shares, 701 in SME board and 355 in ChiNext. The total market capitalization was Chinese curren-cy (RMB) 7,566.650 billion and the free-float market capitalization was RMB
5,128.253 billion. The total share capital of all the listed companies reached 734.004 billion shares, of which 542.475 billion shares or 73.91% were tradable (Shenzhen Stock Exchange).
1 It is a program launched in China in 2002. It allows licensed foreign investors to buy and sell A Shares in
China’s mainland stock exchanges.
2 ChiNext is a China’s NASDAQ-style exchange. It is to build a capital platform providing solid support for
the development of independently innovative enterprises and other growing venture enterprises, and a dis-tinctive character and international competitiveness.
4
2.2.2 United States Stock Exchanges
There are four national stock exchanges in the United States; they are New York Stock Exchange (NYSE), Nasdaq Stock Exchange (NASDAQ), American Stock Exchange (AMEX) and Over-the-Counter Bulletin Board (OTCBB). Except these, there are still other stock exchanges in the United States capital market, but only NYSE, NASDAQ, AMEX and OTCBB allow companies outside the United States to go public (Liu & Cheng, 2009).
NYSE was founded in the earliest on May 17th 1792 (New York Stock Exchange). In 2007, the NYSE Group and Euronext combined to the first truly global exchange group. Now there are approximately 8,000 listed issues (excluding European Structured Prod-ucts) from more than 55 countries (NYSE Euronest company overview).
NASDAQ is a global electronic marketplace for the buying and selling of stock and a market indicator that tells you how well the stock performed on a given day (NASDAQ OMX). By the end of June 2005, the number of companies listed on NASDAQ is 3241. The number of companies choosing IPO on NASDAQ reached 148 (financed amount reached $ 15 billion), accounting for 61% of the total number of IPO companies on the United States capital market (Nasdaq: growth enterprises markets model, 2009). AMEX, formerly known as the New York Curb Market, was established in 1908. The AMEX joined the NYSE Euronext group of exchanges improving the company’s posi-tion in U.S. opposi-tions, exchange traded funds and cash equities, and offering a leading ve-nue for list and trading closed-end funds and structured products (AMEX Historical Timeline).
OTCBB is a regulated quotation service that displays real-time quotes, last-sale prices, and volume information in over-the-counter (OTC) equity securities. It began operation in June 1990. An OTC equity security generally is any equity that is not listed or traded on NASDAQ or a national securities exchange (OTC Bulletin Board).
5
2.3 Current Status of Cross-listing
2.3.1 Current status of cross-listing all over the world
Globalization is enhanced in financial markets in recent years; the number of non-U.S. firms cross-listing shares on a U.S. exchange is dramatically increasing. A top priority of the U.S. stock exchanges is attracting non-U.S. firms listing (Eun & Sabherwal, 2003). Due to most of the cross-listing companies listed in domestic country, and then listed in foreign countries, the cross-listing’s current status all over the world will be presented indirectly by using the number of overseas companies listing in main stock exchanges in the world in the following.
Since the year of 2001, in the main global stock exchanges, which are NASDAQ Stock Exchange (NASDAQ), New York Stock Exchange (NYSE), Tokyo Stock Exchange (TSE), Deutsche Börse AG (DBAG), London Stock Exchange (LSE) and NYSE Euro-next (Europe), the number of the overseas companies listed in these stock markets is over 1600. The highest number of these overseas companies is 1945 in 2002, and then it decreased slowly since 2003. The number became 1658 in 2012. Although the number decayed year by year, the ratio of the overseas companies accounted in the all listed companies is stable around 14%.
6
Resource: World Federation of Exchanges.3
It can be seen easily that most of the overseas companies choose to list in NASDAQ, NYSE Euronext (US) and LSE. This proportion is more than 60% in the 6 stock ex-changes in Figure 1, especially in recent years; this ratio is up to over 80%, for example, 84.56% in 2012. Except for the TSE, the ratios of overseas listed companies accounted in the whole listed companies in other 5 stock exchanges are all more than 10%, some even up to 30%. Since 2007, because LSE merged with Bores Italiana, the number of overseas listed companies increased dramatically, approximately as twice as before. While the number of overseas listed companies in NASDAQ and NYSE Euronext (US) always fluctuated in a certain range these years.
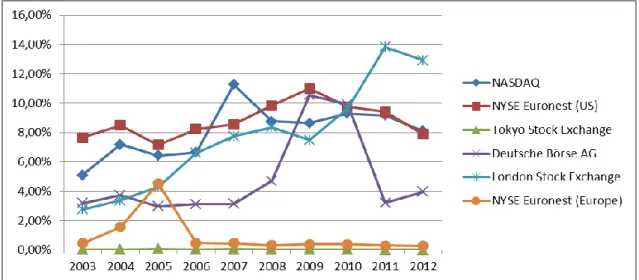
Figure 2: The ratio of values of share trading of overseas listed companies in the main global stock ex-changes.
Resource: World Federation of Exchanges.4
In the aspect of value of share trading, beside NYSE Euronext (Europe) and TSE, the ratios of values of share trading of overseas listed companies in other 4 stock exchanges range from 3% to 13% during the period from 2003 to 2012. And the ratios in NYSE Euronext (Europe) and TSE are very low in recent years, close to 0 from Figure 2. It
3 Since NYSE merged with AMEX, so the data of NYSE and AMEX is included in NYSE Euronext (US). In
October 2007, the LSE merged with Borse Italiana, creating Europe’s leading diversified exchange business, London Stock Exchange Group. Hence the data of LSE is changed to the data of LSE Group from 2007. The data of NYSE Euronext (Europe) from 2005 to 2008 missed.
7
presents that even if the number of overseas listed companies is very large in some stock exchanges, the trades are not active and investors still tend to invest in stocks of domestic listed companies.
2.3.2 Current status of cross-listing in China
Hong Kong, U.S. (NYSE and NASDAQ), Singapore and London are the primary choices for Chinese companies to list in overseas capital market.
Hong Kong is one of the main International financial centers. In addition, there are unique advantages in geography, economy and culture between Hong Kong and Main-land China, so Hong Kong is the first choice for Chinese companies to list in overseas capital market. By the end of 31st March 2013, there are 175 companies which issued H Shares5 in Hong Kong, in which 148 in Main Board (list of H Share companies (Main Board)) and 27 in Growth Enterprise Market (GEM) (list of H Share companies (GEM)).
NYSE is the centralized listed market for Chinese blue chip6. There are 80 Chinese companies listed there by the end of 1st August 2011 (list of Chinese companies in NYSE). And NASDAQ is the famous market for Chinese emerging technology compa-nies. So far, 99 Chinese companies listed there (Companies in China). Furthermore, due to the low requirement, the simple procedure and the cheap list fee, OTCBB is a good choice for many private companies.
At the present, Singapore Exchange has 144 Chinese companies; most of these are small-and –Medium private companies (Statistical Report March 2013). Moreover, LSE also attracted many Chinese companies, but the number of the companies is not very large comparing with other stock exchanges described above.
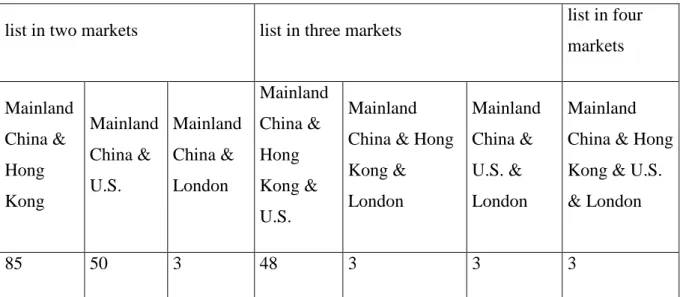
Most of the Chinese cross-listing companies choose Hong Kong and U.S. as their pri-mary cross-listing markets. Only 3 Chinese companies list in LSE, and in the same time
5 H Shares refers to the shares of companies incorporated in mainland China that are traded on the Hong
Kong Stock Exchange.
6 According to New York Stock Exchange, a blue chip is stock in a corporation with a national reputation for
8
these three companies list in Mainland China, Hong Kong and U.S. markets. In total, by now, there are 85 Chinese cross-listing companies in Hong Kong market and 50 in U.S. market, in which 48 companies list in Mainland China, Hong Kong and U.S.. The detailed data are shown in Table 1.
list in two markets list in three markets list in four
markets Mainland China & Hong Kong Mainland China & U.S. Mainland China & London Mainland China & Hong Kong & U.S. Mainland China & Hong Kong & London Mainland China & U.S. & London Mainland China & Hong Kong & U.S. & London
85 50 3 48 3 3 3
Table 1: Chinese cross-listing companies statistic.
9
3 Previous Studies
3.1
Effect of cross-listing on corporations’ abnormal return
Many scholars studied the effect of cross-lising on abnormal return and the changing of abnormal return during the period before and after listing date by using event study. Alexander, Eun and Janakiramanan (1988) use event study to test 34 overseas firms listed in U.S. markets. Their main results are the expected return on the firm’s stocks should decline after the firm listed in domestic and overseas markets. But the decline in expected returns of Canadian firms was statistically insignificant and smaller than non-Canadian firms’ decline.
Foerster and Karolyi (2000) investigate 333 global equity offerings with U.S. depositary receipt tranches from 35 countries all over the world during 1982 to 1996. They find there was a significant and positive relationship between post-issuance abnormal returns and the ability of the firm to capture a proportionately larger share of U.S. trading vo-lume.
Korczak and Bohl (2005) collecte cross-listing companies in the newly established capi-tal markets in Central and Eastern Europe. Average cumulative abnormal returns around the announcement and listing date increased in the 1995-2001 period. The increase in market value around international cross-listing is significant and very sharp.
Miller (1999) examines 181 firms from 35 countries that instituted their first Depositary Receipt program between 1985 and 1995. As a result of the cross-listing, share value increases, the cost of capital declines and cumulative abnormal return around the an-nouncement of a Depositary Receipt increases.
There are still many previous empirical researches investigating the returns of underly-ing stocks to cross-listunderly-ing around the date the stocks listed on the U.S. markets. Foerster and Karolyi (1996) find abnormal returns are positive in the per-listing period, while
10
become negative in the post-listing period. However, Eun, Claessens and Jun (1993) consider abnormal returns are insignificant around the DR listing.
3.2 Effect of cross-listing on corporations’ market value
King & Mittoo (2007) figure out that the reasons of cross-listings will change as time changing. In general, cross-listed corporations have higher market valuation than these companies just listed in native exchange market.
Cross-listing can be regarded as an efficient financing strategy for companies, because cross-listing can reduce even eliminate the barriers between the capital markets to some extent, hence it can decrease the cost of corporations’ capital and increase stock prices and enterprise value (Stapleton & Subrahmanyan, 1977). In order to attracting more in-vestors, firms choose cross listing. The more the number of investors is, the higher the investors’ firm cognitive degree is, the lower the corporations’ equity capital cost is and the larger the enterprise value is (Merton, 1987).
Shen’s (2007) empirical research result shows that cross listed companies can gain more profits than non-cross-listed companies and realize the goal that maximizing the enter-prise value. However, Guo and Tang (2006) examine on the cost of capital and liquidity of 29 companies which list in Mainland China and Hong Kong markets. Their result is against with the conclusion that cross-listing can lower companies’ cost of capital and enhance their market value.
After cross-listing, under the dual legal constraints and monitoring mechanism, not only corporation governance is improved, but also large amount of investors are attracted, thus corporation can raise more equity capital by a lower capital cost to improve enter-prise value (Coffee, 1999). King and Segal (2004) compared domestic listed Canadian companies and cross-listed both in United States and Canada companies from the year of 1990 to 2001. They find that although the cross-listing companies must obey the strict regulatory requirements in the U.S. and their governances are improved, not all Canadian cross-listing companies will benefit, even if under strict information
disclo-11
sure and supervision. That illustrates whether the corporation value can be increased by cross-listing depends on whether constraint mechanisms play a role or not.
3.3
Corporations’ performance in a long-term
3.3.1 Effect of cross-listing on firm’s performance in a long-term
Alexander et al (1988) find that the cumulative abnormal returns have a persistent de-cline, reaching -51.21% after 3 years of cross-listing.
The research of Foerster and Karolyi (1999) interprets that cumulative abnormal returns increase 19% during one year before listing, up to 1.2% during the listing week, but de-crease 14% during the year after the listing week. They think the unusual returns are as-sociated with an expansion of the shareholder base and the amount of capital rose at the time of listing.
Foerster, et al (2000) continue to study the cross-listing companies’ long-run perfor-mance deeply. Their conclusion is consistent with that described before. Simultaneous-ly, the study presents market segmentation and information disclosure are significant factors to affect the cross-listing companies’ long-run performance.
3.3.2 The long-run performance of listed companies
When Chen (2001) studies the cross-sectional between ownership structure and manu-facturing companies’ performance, he thinks age of firms listed on the exchanges, debt ratio, growth speed of the firm, firm size and profitability may also affect corporate per-formance except ownership structure.
Qi, Wu and Zhang (2000) choose return on equity as dependent variable and the propor-tion of tradable A-shares, the proporpropor-tion of shares available only to foreign investors, debt to equity ratio, the logarithm of average total assets, a dummy variable of year and a dummy variable of industry as independent variables to examine the relationship be-tween shareholding structure and corporate performance.
12
Gupta (2005) investigates whether there is a relationship between operating perfor-mance of firms and the share of equity sold. The indicators they take into account are lagged share of private ownership, firm-specific controls and year dummies, etc.
3.4 Other researches about cross-listing
3.4.1 Effects on stock system risk
Foerster and Karolyi (1993) identify 53 TSE-listed stocks that interlised on U.S. ex-changes over the period of 1981 to 1990. The standard deviations of returns, as well as betas, decrease slightly for the interlisted stocks in per- and post-listing periods. While the downward shift is not statistically significant.
Moreover, Jayaraman, Shastri and Tandon (1993) analyze 95 firms listed on a country other than the United States and had an American Depositary Receipt (ADR) initially issued on an U.S. exchanges. An increase in variance of returns on the underlying stocks is associated with the listing of ADRs. They think this situation is caused by the increasing trading time, information revelation and noise trading.
However, Lau, Diltz and Apilado’s (1994) study reveals there is not a definitive impact on stock return variances after the firm’s cross-listing.
3.4.2 Cross-listing effects on local capital markets
Cross-listing affects not only on cross-listing companies’ returns, system risk and per-formance, but also on the local capital market and the development of non-cross-listing companies.
Cross-listing is an approach to reduce agency costs of controlling shareholders and pro-vide more opportunities because the firm can have better access to external finance. Non-cross-listing firms left behind are seen at a relative disadvantage to the cross-listing firms. Listing in the USA should promote better disclosure and law enforcement in the home market, but the effects are not all advantageous for the home market of the listing firm (Melvin & Valero, 2009).
13
Levine and Schmukler (2006) focus on the relationship between internationalization and stock market liquidity. The result shows cross-listing reduces the trading of domestic firms in the home market and caused the migration of cross-listing firms’ trading out of the domestic market and into international market, and the migration of trading out of non-cross-listing firms and into cross-listing firms.
14
4 Corporations’ performance study in short-term
4.1 Methodology
An event study measures the impact of a specific event on the value of firm by using fi-nancial market data. It can be applied to a variety of firm specific and economy wide events including mergers and acquisitions, earnings announcements and issues of new debt or equity, etc. (Mackinlay, 1997).
Many researches (Alexander et al., 1988; Foerster et al., 2000; etc.) focusing on the im-pact of cross-listing adopt an event study. So I also choose an event study to measure the cross-listing companies’ performance in short-term.
In general, the procedure of an event study is as follow.
Event and period definition
Determining sample selection criteria
Measures of normal and abnormal returns selection
Estimating parameters for calculating abnormal returns
Testing framework for the abnormal returns
Empirical results interpretation and conclusion
The most important aspect is the measure of normal and abnormal returns selection. The
abnormal return is the actual ex-post return of the security over the event window mi-nus the normal return of the firm over the event window (Mackinlay, 1997, p15). There
are two common models for the normal return: the constant mean return model and the market model.
15
Rit = µi + ζit E(ζit) = 0 var(ζit) =
where µi is the mean return for asset i, Rit is the return of the asset i in period t and ζit is the disturbance term of the asset i in the period t with an expectation of zero and va-riance .
Although the constant mean return model is deemed to the simplest model, the results calculated by this model is similar to those sophisticated ones (Brown and Warner, 1980, 1985).
The market model is
Rit = αi + βi Rmt + εit E (εit) = 0 var (εit) =
where Rit is the return of asset i in the period t, Rmt is the return of the market portfolio in the period t, εit is the disturbance term with the mean of zero and αi and βi re the pa-rameters of this model.
The market model improves the constant mean return model and increases the ability to detect event effects. So the market model is used in this paper.
4.2 Sample and data selection
4.2.1 Event date determining
In general, listing date and announcement date are two basic choices for the event date determining, but it is controversial to choose listing date or announcement date as event date separately. Firstly, announcement does not mean that the company can go public successfully, while it disperses risk only after listing. Secondly, if choosing listing date as event date, investors have known the information about it and take action before the listing date, it will decay the effects of listing after the listing day. In this paper, the list-ing date is taken as event date, because the information about announcement date is
lit-16
tle; on the other hand, this paper focuses on the impacts of the abnormal returns after cross-listing, however, the final offering price is usually determined before listing. A classical event study is used with a three-day (-1, +1) and 21-day (-10, +10) event window (Brockett, Chen and Garven, 1999). Three-day event window is a little short. So in this paper, the event window is chosen 10 trading days before and after event date, that is (-10, 10), 21 trading days in all.
In order to estimate more accurate data, the estimation window is chosen 273 trading days to 10 trading days before listing date, 252 trading days in total which is the number of trading days in one year.
4.2.2 Sample selection
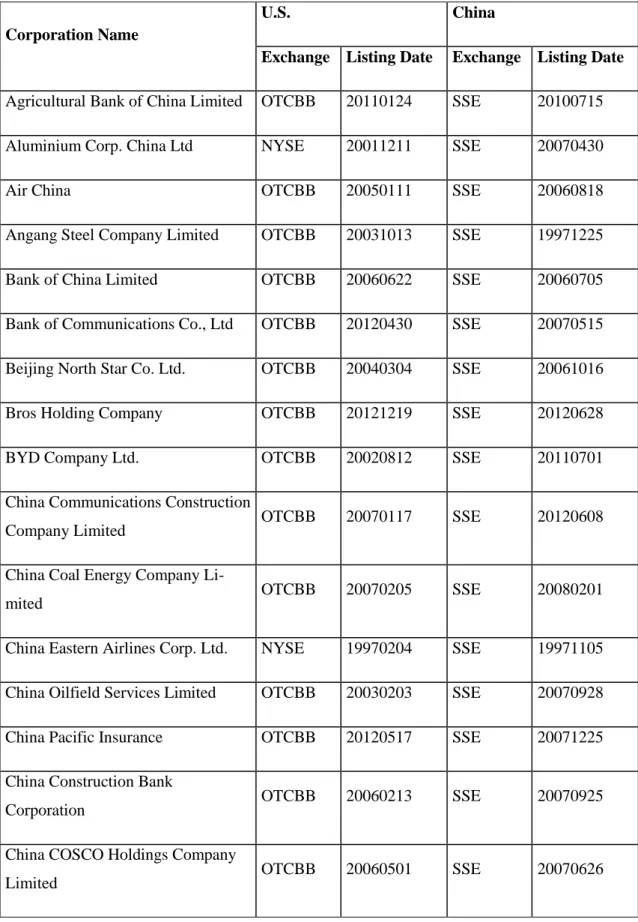
At the end of 31st March 2013, the number of Chinese companies listed both in Chinese stock exchanges and American stock exchanges is 50, in which 40 companies listed in OTCBB, only 10 companies listed in NYSE.
Due to using market index to estimated expected returns, the market index of OTCBB is difficult to find, so this paper emphasizes on the Chinese companies listed in NYSE. In the 10 companies listed in NYSE, there are four companies (China Eastern Airlines Corp. Ltd., China Petroleum & Chemical Corp., Sinopec Shanghai Petrochemical Com-pany Limited and Yanzhou Coal Mining Co. Ltd.) those interval times between listing dates in Chinese stock exchanges and American stock exchanges are very close (the pe-riod before cross-listing is less than 252 trading days). Finally, the sample is consisted of 6 companies.
All the data are taken from DataStream.
4.2.3 The abnormal returns calculation
The companies’ returns are taken logarithmic form, that is Rit = ln ( ). Normal re-turns calculate by using market model, then determining abnormal rere-turns.
17
= αi + βi Rmt
where αi and βi are parameters of the market model calculating by estimated window; Rmt is market return which calculating by the same formula of normal return and market index is taken from NYSE composite index; i = 1, 2, …, 6; t = -10, -9, …, 9, 10, that is the window period.
The formula of abnormal return (AR) is
ARit = Rit - The formula of average abnormal return (AAR) is
AARt = where N is the number of the sample and equals to 6.
The formula of cumulative average abnormal return (CAAR) is CAAR (t1, t2) = , t1, t2 The t-statistic is calculating by
T = ~ N (0, 1), t1, t2
4.3 Empirical Results
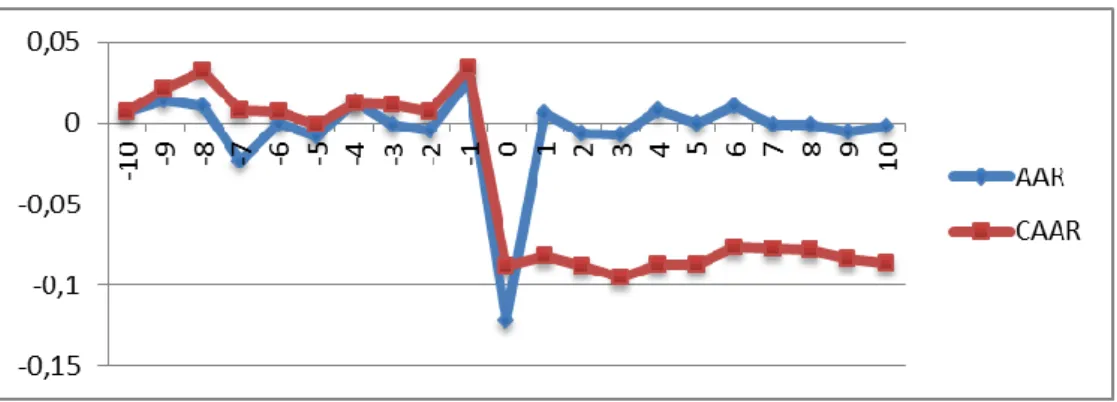
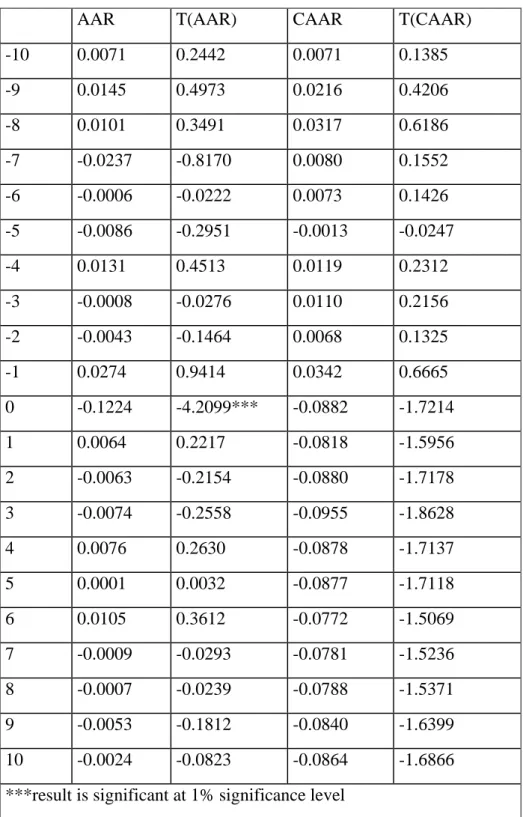
Figure 3 shows that the average abnormal returns and cumulative average abnormal re-turns for whole samples in the period over -10 days and 10 days after cross-listing. All T-statistics tables for AR, CAR, AAR and CAAR are presented in Appendix 2.
18
Figure 3: Average abnormal returns and cumulative average abnormal returns for whole sample
In the period over 10 days and 8 days before cross-listing, CAAR increases slowly and peaks to 0.034 in 1 days before cross-listing. Then it decreases dramatically in the list-ing day and fluctuates around -0.008 in the followlist-ing days. In sum, the CAARs are pos-itive in the pre-list period and negative in the post-period. And the AARs are close to 0 after cross-listing. Only in the listing day, the CAR drops dramatically and the result is significant. But most of the results are not significant; maybe the effect is eliminated by adding the cumulative abnormal returns (CAR) for each company together. Therefore, the CARs for each company will be analyzed in the following.
Figure 4: Abnormal returns and cumulative abnormal returns for ACH
For Aluminum Corp. of China Ltd. (ACH), after 3 days increasing, the CAR decreases to -0.062 in 5 days before cross-listing and then floats from -4 days to 3 days after listing. From then on, it increases sharply and up to 0.122 in 10 days after cross-listing and the result in that day is significant at 5% significance level.
19
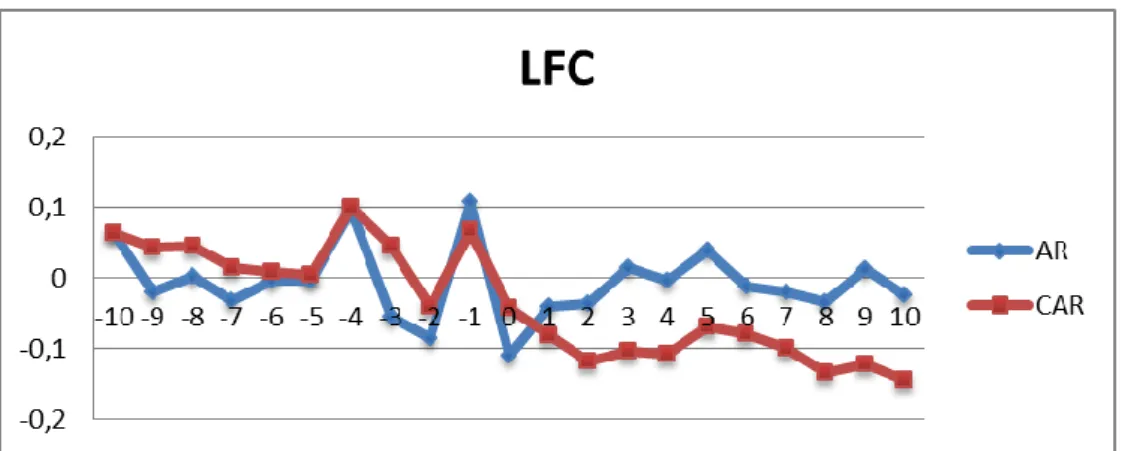
Figure 5: Abnormal returns and cumulative abnormal returns for LFC
For China Life Insurance Co. Ltd. (LFC), the CAR lessens in the period over 10 days and 5 days before cross-listing. After 7 days’ sharp fluctuation, it lowers gradually. The CARs are negative after cross-listing, while the ARs fluctuate around 0 in this period.
Figure 6: Abnormal returns and cumulative abnormal returns for ZNH
For China Southern Airlines Co. Ltd. (ZNH), the ARs don’t change obviously in the pe-riod over 10 days to 1 day before cross-listing and in the pepe-riod over 1 day to 10 days after cross-listing. Only in the listing day, the AR drops drastically, down to -0.444 that is the lowest in the whole event period. The only difference between the tendency of the AR and the CAR is the CARs are negative after cross-listing due to the sharp decrease in the listing day.
20
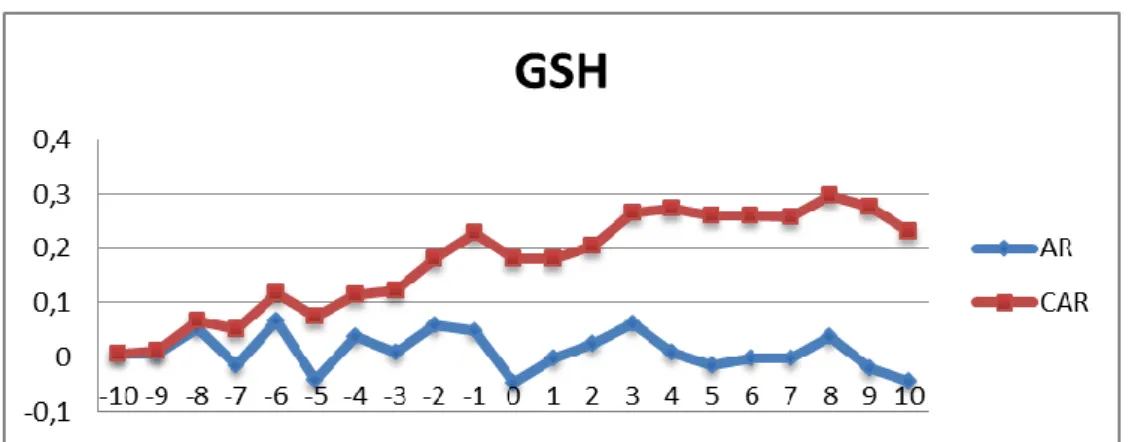
Figure 7: Abnormal returns and cumulative abnormal returns for GSH
For Guangshen Railway Co. Ltd. (GSH), the CAR rises continuously in sum and all above 0, in spite of increasing and decreasing during the whole time. And the results of the CAR are significant at 10% significance level from 2 days before listing day. How-ever, there is not a significant increase in the tendency of the AR and it always floats around 0 and most are above 0.
Figure 8: Abnormal returns and cumulative abnormal returns for HNP
For Huaneng Power International Inc. (HNP), the CAR is always negative and decreas-es sharply from 5 days before the listing day. The bottom occurs in the listing day and the CAR is down to -0.112. Then from the 2 days after the listing day, it decays slowly. In addition, the AR fluctuates dramatically during the period over -4 days and 3 days af-ter cross-listing.
21
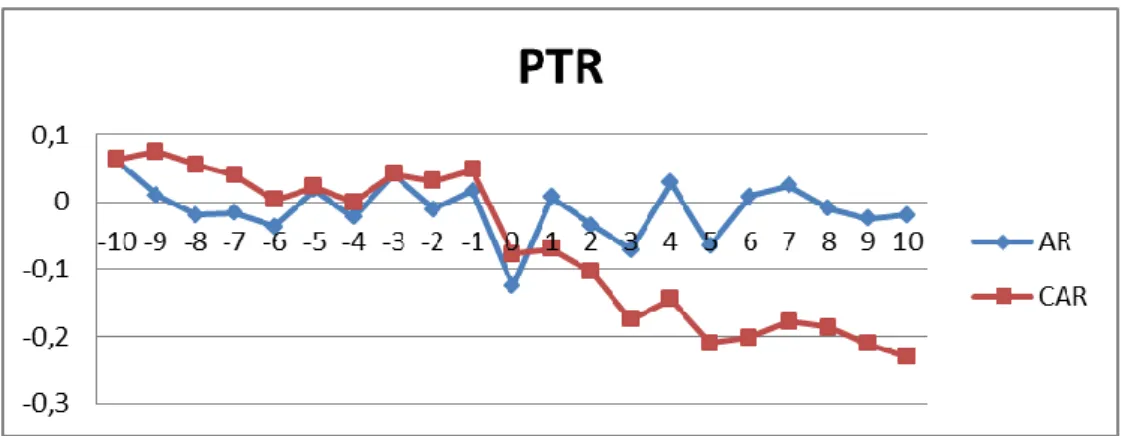
Figure 9: Abnormal returns and cumulative abnormal returns for PTR
For PetroChina Company Limited (PTR), the CAR decays during the whole period and is less than 0 from the listing day. Furthermore, there is not a significant change in AR before the listing day and after that the AR floats obviously till the 8 days after cross-listing.
4.4 Analysis of the empirical results
In general, most of Chinese companies choose to list in U.S. stock exchanges firstly and then go public in Chinese stock exchanges, especially in the sample, 6 companies are all in this situation.
22
From the figure 10, it can be seen easily that the companies’ ARs have the similar ten-dency except HNP. Although only 6 companies cannot reflect the whole market, the similar tendency is still representative.
Before the listing day, the ARs fluctuate stably and are close to 0 and most of them are positive. It shows although not many investors take actions on the stocks and the firms’ performances are not affected before cross-listing, the investors who take actions be-lieve cross-listing is benefit for companies. But on the listing day, the ARs of 3 compa-nies (LFC, ZNH and PTR) have a obvious decrease. It demonstrates that not all inves-tors think cross-listing is a bad news for the company, the stock price of this firm will decrease in the further and the firm’s performance will be weak. Additionally, the ARs continue to fluctuate around 0 again but most of them are negative after the listing day. It explains cross-listing affects the performance of the companies weakly, however this effect is not benefit for companies.
In short, the cross-listing companies’ market prices and performances do not change obviously in a short period. Only on the listing date, some companies’ abnormal return decresase significantly, but after that day, the decrease disappears and the ARs return to fluctuate around 0.
23
5 Corporations’ performance study in long-term
In general, one reason for companies list in developed capital markets is to collect more capitals; on the other hands, it is to improve companies’ management and operation. But do the cross-listing companies in U.S. and Mainland China markets improve their long-term performance? This is the key issue in this chapter.
The evaluation of a corporation’s performances in term should include its long-term market performance and business performance. But these are not independent with each other. In general, the corporation’s market performance depends on its business performance and whether the business performance is good or not determines the corpo-ration’s long-term market performance. Hence, the research of the corpocorpo-ration’s per-formance in long-term focuses on the business perper-formance in this paper.
5.1 Methodology
In order to find out the relationship between cross-listing and companies’ performance, multiple regression analysis is one approach to solve this problem. But it is hard to find former studies about the effect of cross-listing on corporations’ performance by regres-sion. Lang, Lins and Miller (2003) interpret the effect of cross-listing on analyst cover-age and performance by ordinary least squares (OLS) regression. They take cross-listing as dependent variable, which takes the value 1 if the firm cross-listing, otherwise 0. And they choose other factors those may affect information environment at the same time. There are still many scholars study the effect of cross-listing by using whether the firm cross-listing or not as independent variable when they run regression (Ke, 2011; Fer-nandes & Ferreira, 2008). Simultaneously, in terms of the literatures about listing com-panies’ performance, regression is used to discover the effect of independent variable, cross-listing, to dependent variable, companies’ performance, by considering the control variables: industry, firm size and debt. If the coefficient of cross-listing is significant positive, thus it can represent cross-listing improves a company’s performance; other-wise, it doesn’t.
24
5.1.1 Indicators selection
There are plenty of indicators measuring a corporation’s business performance, which include the company’s profitability, operation ability, debt paying ability and develop-ment ability. While the profitability is the key among these.
Return on equity (ROE) and return on asset (ROA) are financial indicators representing a company’s profitability. ROE measures a company’s efficiency at general profits from every unit of net assets. ROA demonstrates how profitable a company’s assets are in net income and is equal to a fiscal year’s net income divided by average total assets.
ROE =
ROA =
Total Asset Turnover (TAT) is a financial indicator measuring the efficiency of a com-pany’s use of total assets in net sales revenue and is equal to net sales revenue divided by average total assets.
TAT =
In this paper, ROE, ROA and TAT are all chosen to reflect a company’s business per-formance in different aspects, resulting from each of them just shows some part of the company’s business performance.
Market Value (MV) is the estimated amount for which a property should exchange on
the date of valuation between a willing buyer and a willing seller in an arm’s-length transaction after proper marketing wherein the parties had each acted knowledgeably, prudently and without compulsion (International Valuation Standards Committee, 2003,
p. 96). And it is based on firms’ future profitability (Konar & Cohen, 2001).
Firm size is measured by many ways. Gilson (1997) uses the nature logarithm of total assets as a proxy of firm size. So the nature logarithm of total assets of firms is taken in-to account in this paper.
25
5.1.2 Sample and Data
At the end of 31st March 2013, there are 117 companies listing in U.S. markets. Due to the sample period chosen from 2007 to 2012, so the companies listing before 2007 are chosen in the sample, 99 companies at all, which includes 24 cross-listing companies and 75 non-cross-listing companies. The total observations are 594.
Expected MV is from DataStream, other data is taken from each company’s annual re-ports from 2007 to 2012, but it is unbalanced. All financial indicators are calculated in term of the basic functions describing above. And TAT is calculated by the total assets at the end of the year if the total assets at the beginning of the year miss, it may influ-ence the results.
5.1.3 Regression Functions
The dependent variables are ROE, ROA, TAT and MV, the control variables are asset size (ln (total assets)), leverage ratio (debt-to-assets ratio) and industry factors and the independent variable is cross-listing.
The regression function is
ROEit = α + β1 ln(TAit) + β2 DTAit + β3 CLit + β4 BMit + β5 CGit + β6 CSit + β7 Fit + β8 HCit + β9 Iit +β10 OGit +β11 Tit +β12 Uit + εit
ROAit = α + β1 ln(TAit) + β2 DTAit + β3 CLit + β4 BMit + β5 CGit + β6 CSit + β7 Fit + β8 HCit + β9 Iit +β10 OGit +β11 Tit +β12 Uit + εit
TATit = α + β1 ln(TAit) + β2 DTAit + β3 CLit + β4 BMit + β5 CGit + β6 CSit + β7 Fit + β8 HCit + β9 Iit +β10 OGit +β11 Tit +β12 Uit + εit
MVit = α + β1 ln(TAit) + β2 DTAit + β3 CLit + β4 BMit + β5 CGit + β6 CSit + β7 Fit + β8 HCit + β9 Iit +β10 OGit +β11 Tit +β12 Uit + εit
where t = 2007, 2006,…, 2012; i = 1, 2, …, 98, 99; α is intercept and β is coefficient of independent variable.
26
CL is a dummy variable, if the company cross-lists in t year, then CL equals to 1, oth-erwise 0.
BM, CG, CS, F, HC, I, OG, T, U are industry factors. According to The Industry Classi-fication Benchmark (ICB), all companies are divided into 10 industries: basic materials (BM), consumer goods (CG), consumer services (CS), finance (F), health care (HC), in-dustrials (I), oil & gas (OG), technology (T), telecommunications and utilities (U). Be-cause all companies in the sample aren’t in telecommunications industry, it isn’t consi-dered in regressions.
ε is the error term.
5.2 Empirical results and analysis
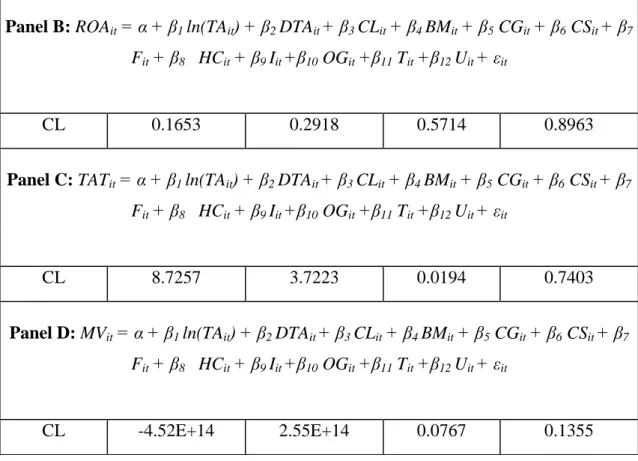
According to the empirical results in Table 2, there is a significant positive relationship between TAT and CL at 5% significance level and the MV is significant negative with CL at 10% significance level; ROE and ROA are both positive with CL, but not signifi-cant. The regression results, unit root test and cointegration test results are shown in Appendix 3.
First of all, TAT is significant positive correlation with CL, namely the TATs of cross-listing companies are obviously better than those of companies only cross-listing in U.S. mar-kets. There is low efficiency in using total assets for the non-cross-listing companies. The main reason maybe that cross-listing increases the investment opportunities and a program investing by the capital collecting in the secondary list market profits in a short time, hence the new capital has a low profitability and efficiency.
Regression Results
variable coefficient Std. Error P-value R-squared
Panel A: ROEit = α + β1 ln(TAit) + β2 DTAit + β3 CLit + β4 BMit + β5 CGit + β6 CSit + β7 Fit + β8 HCit + β9 Iit +β10 OGit +β11 Tit +β12 Uit + εit
27
Panel B: ROAit = α + β1 ln(TAit) + β2 DTAit + β3 CLit + β4 BMit + β5 CGit + β6 CSit + β7 Fit + β8 HCit + β9 Iit +β10 OGit +β11 Tit +β12 Uit + εit
CL 0.1653 0.2918 0.5714 0.8963
Panel C: TATit = α + β1 ln(TAit) + β2 DTAit + β3 CLit + β4 BMit + β5 CGit + β6 CSit + β7 Fit + β8 HCit + β9 Iit +β10 OGit +β11 Tit +β12 Uit + εit
CL 8.7257 3.7223 0.0194 0.7403
Panel D: MVit = α + β1 ln(TAit) + β2 DTAit + β3 CLit + β4 BMit + β5 CGit + β6 CSit + β7 Fit + β8 HCit + β9 Iit +β10 OGit +β11 Tit +β12 Uit + εit
CL -4.52E+14 2.55E+14 0.0767 0.1355
Table 2: Regression results
Next, the ROE and ROA are positive correlation with CL, but not significant. In spite of the requirements in information disclosure, governance structure and regulator in U.S. markets are stricter than those in Mainland China market; the companies improve their governance structures and should have a better performance. However, whether cross-listing improve firm’s business performance depends on whether the firm profits by us-ing the capital collectus-ing in the secondary list market, it still has many uncertainties. Furthermore, the reason for some companies choosing cross-listing is to provide con-venience to shareholders to trade their shares, rather than collect more assets. For in-stant, China Life Insurance Co. Ltd. issued 1.5 billion A shares and collected 27.8 bil-lion Chinese currency (RMB), while its total asset is over 600 bilbil-lion RMB. It shows China Life Insurance Co. Ltd. list in Mainland China and issued A shares not because it need assets. This situation also occurred in Industrial and Commercial Bank of China, Band of China and Air China, etc.
In addition, the MV is significant negative with the CL at 10% significance level. The result is against with many scholars’ researches (King & Mittoo, 2007; Shen, 2007).
28
This may because Chinese companies have their own specification. Most investors aren’t acquainted with them, so investors are cautious when investing (Boyd, 2012), which causes the low liquidity of Chinese companies and low investor cognition in U.S. market. For example, the number of trading stock of China HGS Real Estate (symbol: HGSH) is only 1568 shares on a given day and the average daily trading shares are 2636. The average daily trading volume is less than 10,000 U.S. dollar, while the mar-ket value of this company is approximately 100,000,000 U.S. dollar (Zhong, 2011). Due to the low liquidity and limited investor cognition, the companies’ market values cannot be improved.
29
6 Conclusionon
This study investigates the performance of Chinese cross-listing companies in U.S. market in short-run and in long-run respectively. In short-run study, 6 companies cross-list in NYSE and Chinese market are in the sample. Their each abnormal return from 10 days before and after listing date has a tendency in some degree. In pre-cross-listing pe-riod, the ARs are mostly positive and remain stable; but on the cross-listing day, some of the companies’ ARs decline however some do not; and after that day, the ARs still fluctuate around 0 while most of them are negative. In long-run study, By using mul-tiple regression of 99 Chinese companies listed in U.S. market from 2007 to 2012, there is a significant positive relationship between TAT and CL at 5% significance level and the MV is significant negative with CL at 10% significance level; ROE and ROA are both positive with CL, but not significant. The results interpret that cross-listing im-prove the companies’ assets efficiency, but due to the low liquidity, their market value will lessen after cross-listing.
The corporations’ performance is a delicate issue and therefore needs large sample in explaining it, thus the results is more powerful. As I have introduced in my paper, there still are many limitations. First, a small sample is used in short-run study, although there is a tendency in the sample, all the companies in the sample list in NYSE, no one in NASDAQ, hence the results may be not representative. Moreover, in long-run study, companies in my sample are in U.S. market, not include the companies in Chinese mar-ket. If the regressions can be run in U.S. market and in Chinese market respectively, it may be different from my results and there may be new findings.
30
7 References
Alexander, G. J., & Eun, C. S., & Janakiramanan. S. (1988). International listing and stock returns: some empirical evidence. The Journal of Financial and Quantitative
Analysis, 23(2), 135-151.
Amihud, Y., & Mendelson, H. (1986). Asset pricing and the bid-ask spread. Journal of
Financial Economics, 17, 223-249.
Boyd, E. (2012, January). It needs to know more when investing Chinese companies.
Financial Times-Chinese. Retrieved May 12, 2013, from
http://www.ftchinese.com/story/001042794?
Brockett, P. L. & Chen, H. M., & Garven, J. R. (1999). A new stochasitically flexible event methodology with application to proposition 103. Insurance: Mathematics and
Economics, 1999(25), 197-217.
Brown, S. J., & Warner, J. B. (1980). Measuring security price Performance. Journal of
Financial Economics, 30(2), 253-272.
Brown, S. J., & Warner, J. B. (1985). Using daily stock returns: The case of event stu-dies. Journal of Financial Economics, 14(1), 3-31.
Chen, J. (2001). Ownership structure as corporate governance mechanism: Evidence from Chinese listed companies. Economics of Planning, 34, 53-72.
Coffee, J. (1999). The Future as History: the Prospects for Global Convergence in Cor-porate Governance and Its Implications. Northwestern University Law Review, 93, 641-708.
Eun, C. S., & Sabherwal, S. (2003). Cross-border listing and price discovery: Evidence from U.S.-listing Canadian stock. The Journal of Finance, 58(2), 549-575.
31
Eun, C., & Claessens, S., & Jun, K. (1993). International trade of assets, pricing exter-nalities, and the cost of capital, Claessens, S., Gooptu, S. Portfolio Investment in Devel-oping Countries. World Bank Discussion Papers, 287-298.
Fernandes, N., & Ferreira, M. A. (2008). Does international cross-listing improve the information environment. Journal of Financial Economics, 88, 216-244.
Foerster, S. R., & Karolyi, G. A. (1993). International listings of stocks: The case of Canada and the U.S.. Journal of International Business Studies, 24(4), 763-784. Foerster, S. R., & Karolyi, G. A. (1996). The effects of market segmentation and
illi-quidity on asset prices: evidence from foreign stocks listing in the U.S. Unpublished
working Paper. University of Western Ontario.
Foerster, S. R., & Karolyi, G. A. (1999). The effects of market segmentation and inves-tor recognition on asset prices: Evidence from foreign stocks listing in the United States. The Journal of Finance, 54(3), 981-1013.
Foerster, S. R., & Karolyi, G. A. (2000). The long-run performance of global equity of-ferings. The Journal of Financial and Quantitative Analysis, 35(4), 499-528.
Gilson, S. (1997). Transaction costs and capital structure choice: Evidence from finan-cial distressed firms. Journal of Finance 52, 161-195.
Guo, L., & Tang, L. (2006). Cost of Capital and Liquidity of Cross-listed Chinese Companies. Salt Lake City: Financial Management Association.
Gupta, N. (2005). Partial privatization and firm performance. The Journal of Finance, 60(2), 987-1015.
International Organization of Securities Commissions. (1998. September). International
disclosure standards for cross-border offerings and initial listings by foreign issuers.
Retrieved April 9. 2013. from
http://www.sec.gov/about/offices/oia/oia_corpfin/crossborder.pdf
International Valuation Standards Committee. (2003). IVS 1- Market Value Basis of
32
Jayaraman, N., & Shastri, K., & Tandon, K. (1993). The impact of international cross listings on risk and return: The evidence from American Depository Receipt. Journal of
Banking and Finance, 17, 91-103.
Ke, J. F. (2011). Cross-listing on the impact of corporate governance: Evidence from listed companies in China. Journal of Hubei University of Economics, 9(1), 40-45. King, M., & Mittoo, U. (2007). What companies need to know about International Cross-listing. Journal of Applied Corporate Finance, 9, 10-24.
Konar, S., & Cohen, M. A. (2001). Does the market value environmental performance?
The Review of Economics and Statistics, 83(2), 281-289.
Korczak, P., & Bohl, M. T. (2005). Empirical evidence on cross-listed stocks of Central and Eastern European companies. Emerging Markets Review, 6, 121-137.
Lang, M. H., & Lins, K. V., & Miller, D. P. (2003). ADRs, analysts and accuracy: Does cross-listing in the United States improve a firm’s information environment and in-crease market value? Journal of Accounting Research, 41(2), 317-345.
Lau, S. T., & Diltz, J. D., & Apilado, V. P. (1994). Valuation effects of international stock Exchange listings. Journal of Banking and Finance, 18, 743-755.
Levine, R., & Schmukler, S. L. (2006). Internationalization and stock market liquidity.
Review of Finance, 10, 153-187.
Liu, X. Y., & Cheng, G. L. (2009). Present situation and characteristics of Chinese companies listed in the US: the ideal that the construction of the Shanghai Stock Ex-change international board. Practice in Foreign Economic Relations and Trade, 10, 49-51.
Mackinlay, A. C. (1997). Event studies in Economics and Finance. Journal of Economic
Literature, 35(1), 13-39.
Melvin, M., & Valero, M. (2009). The dark side of International cross-listing: Effects on rival firms at home. European Financial Management, 15(1), 66-91.
33
Merton, R. (1987). A Simple Model of Capital Market Equilibrium with Incomplete In-formation. Journal of Finance, 42, 483-510.
Miller, D. P. (1999). The market reaction to international cross-listings: evidence from Depositary Receipts. Journal of Financial Economics, 1(51), 103-123.
Mittoo, U. (2003). Globalization and the Value of US Listing: Revisiting Canadian Evi-dence. Journal of Banking and Finance, 27, 1629-1661.
Onyuma, S. O., & Mugo, R. K., & Karuiya, J. K. (2012). Does cross-border listing (still) improve firm financial performance in eastern Africa. Journal of Business.
Eco-nomics & Finance, 1(1), 92-109.
Qi, D.Q., & Wu, W., & Zhang, H. (2000). Shareholding structure and corporate perfor-mance of partially privatized firms: Evidence from listed Chinese companies.
Pacific-Basin Finance Journal, 8, 587-610.
Scott, D. L. (2003). Wall Street Words: An A to Z Guide to Investment Terms for
To-day's Investor (3rd ed.). Boston: Houghton Mifflin Company.
Shen, H. B. (2007). Market segmentation. cross-border listing and the expected cost of capital -- empirical evidence from the Ohlson - Juettner model. Finance research, 2, 146-155.
Stapleton, R. C., & Subrahmanyan, M. G. (1977). Market imperfections. capital market equilibrium and corporate finance. Journal of Finance, 32, 307-319.
Stulz, R. M. (1999). Globalization. Corporate Finance. and the Cost of Capital. Journal
of Applied Corporate Finance,12, 8-25.
Vassallo, G., & Christensen, O. (2010. January). Secondary and dual listings – demysti-fying the jargon. Brisbane Business News. Retrieved April 9. 2013. from
http://www.brisbanebusinessnews.com.au/process/myviews/bbn_article.html?articleId= 717
Xiao, M., & Shen, Y. F. (2008). Do the cross-border listed companies have a low cost of equity capital. Finance research, 10, 93-103.
34
Zhong, R. X. (2011, September). Thinking of Chinese concept stocks’ valuation.
Busi-ness Value. Retrieved May 12, 2013, from
35
Appendix 1
Table 3: List of the Chinese cross-listing companies in U.S. market
Corporation Name
U.S. China
Exchange Listing Date Exchange Listing Date
Agricultural Bank of China Limited OTCBB 20110124 SSE 20100715
Aluminium Corp. China Ltd NYSE 20011211 SSE 20070430
Air China OTCBB 20050111 SSE 20060818
Angang Steel Company Limited OTCBB 20031013 SSE 19971225
Bank of China Limited OTCBB 20060622 SSE 20060705
Bank of Communications Co., Ltd OTCBB 20120430 SSE 20070515
Beijing North Star Co. Ltd. OTCBB 20040304 SSE 20061016
Bros Holding Company OTCBB 20121219 SSE 20120628
BYD Company Ltd. OTCBB 20020812 SSE 20110701
China Communications Construction
Company Limited OTCBB 20070117 SSE 20120608
China Coal Energy Company
Li-mited OTCBB 20070205 SSE 20080201
China Eastern Airlines Corp. Ltd. NYSE 19970204 SSE 19971105
China Oilfield Services Limited OTCBB 20030203 SSE 20070928
China Pacific Insurance OTCBB 20120517 SSE 20071225
China Construction Bank
Corporation OTCBB 20060213 SSE 20070925
China COSCO Holdings Company
36
China Merchants Bank Co., Ltd. OTCBB 20100923 SSE 20020409
China Minsheng Banking Corp. Ltd. OTCBB 20110629 SSE 20001219
China Railway Group Ltd OTCBB 20080204 SSE 20071203
China Shipping Development Co.
Ltd. OTCBB 20070509 SSE 20020523
CSR Corporation Limited OTCBB 20081110 SSE 20080818
China Shenhua Energy Co. Ltd. OTCBB 20081103 SSE 20071009
China Railway Construction Corp
Ltd OTCBB 20080710 SSE 20080310
Dadongnan Holding Co OTCBB 20101117 SZSE 20080718
Datang International Power
Generation OTCBB 20020312 SSE 20061220
Dongfeng Motor Group Co. Ltd OTCBB 20060203 SSE 19990727
Guangshen Railway Co. Ltd. NYSE 19960513 SSE 20061222
Great Wall Motor Co. Ltd OTCBB 20040211 SSE 20111123
Guangzhou Pharmaceutical Co Ltd OTCBB 20121115 SSE 20010206
Huaneng Power International Inc. NYSE 19940630 SSE 20011206
Industrial and Commercial Bank of
China OTCBB 20061129 SSE 20061027
Jiangsu Expressway Co. Ltd. OTCBB 20030131 SSE 20010116
Jiangxi Copper Company Limited OTCBB 20031110 SSE 20020111
China Life Insurance Co. Ltd. NYSE 20031217 SSE 20070109
37
Ping An Insurance (Group) Co. Of
China Ltd OTCBB 20040922 SSE 20070501
PetroChina Company Limited NYSE 20000406 SSE 20071105
Sichuan Expressway Co. Ltd OTCBB 20031031 SSE 20090727
Shandong Molong Petroleum
Ma-chinery Co. Ltd OTCBB 20050908 SZSE 20101021
Sinopec Shanghai Petrochemical
Company Limited NYSE 19930726 SSE 19931108
Shenzhen Expressway Co., Ltd. OTCBB 20031015 SSE 20011225
Shanghai Electric Group Co Ltd OTCBB 20060413 SSE 20000104
China Petroleum & Chemical
Corporation NYSE 20001018 SSE 20010808
Tianjin Capital Environmental
Pro-tection Group Company Limited OTCBB 20120511 SSE 19950630
Tsingtao Brewery Company Limited OTCBB 20000519 SSE 19930827
Yanzhou Coal Mining Co. Ltd. NYSE 19980331 SSE 19980701
Zijin Mining Group Co. Ltd OTCBB 20040105 SSE 20080425
Zoomlion Heavy Industry Science
and Technology Co. Ltd OTCBB 20120214 SZSE 20001012
China Southern Airlines Co. Ltd. NYSE 19970730 SSE 20030725
ZTE Corporation OTCBB 20050228 SZSE 19971118
38
Appendix 2
Table 4: Average abnormal return cumulative average abnormal return and their T-statistics table for the whole companies in the sample.
AAR T(AAR) CAAR T(CAAR)
-10 0.0071 0.2442 0.0071 0.1385 -9 0.0145 0.4973 0.0216 0.4206 -8 0.0101 0.3491 0.0317 0.6186 -7 -0.0237 -0.8170 0.0080 0.1552 -6 -0.0006 -0.0222 0.0073 0.1426 -5 -0.0086 -0.2951 -0.0013 -0.0247 -4 0.0131 0.4513 0.0119 0.2312 -3 -0.0008 -0.0276 0.0110 0.2156 -2 -0.0043 -0.1464 0.0068 0.1325 -1 0.0274 0.9414 0.0342 0.6665 0 -0.1224 -4.2099*** -0.0882 -1.7214 1 0.0064 0.2217 -0.0818 -1.5956 2 -0.0063 -0.2154 -0.0880 -1.7178 3 -0.0074 -0.2558 -0.0955 -1.8628 4 0.0076 0.2630 -0.0878 -1.7137 5 0.0001 0.0032 -0.0877 -1.7118 6 0.0105 0.3612 -0.0772 -1.5069 7 -0.0009 -0.0293 -0.0781 -1.5236 8 -0.0007 -0.0239 -0.0788 -1.5371 9 -0.0053 -0.1812 -0.0840 -1.6399 10 -0.0024 -0.0823 -0.0864 -1.6866
39
Table 5: Abnormal return and cumulative abnormal return and their T-statistics table for ACH
AR T(AR) CAR T(CAR)
-10 -0.0123 -0.5224 -0.0123 -0.2686 -9 0.0100 0.4252 -0.0023 -0.0500 -8 0.0020 0.0841 -0.0003 -0.0068 -7 -0.0303 -1.2917 -0.0307 -0.6709 -6 -0.0299 -1.2722 -0.0605 -1.3250 -5 -0.0015 -0.0633 -0.0620 -1.3576 -4 0.0071 0.3013 -0.0550 -1.2027 -3 -0.0051 -0.2164 -0.0600 -1.3139 -2 0.0249 1.0618 -0.0351 -0.7680 -1 0.0075 0.3174 -0.0276 -0.6048 0 -0.0080 -0.3403 -0.0356 -0.7797 1 -0.0034 -0.1467 -0.0391 -0.8552 2 -0.0219 -0.9342 -0.0610 -1.3355 3 -0.0076 -0.3221 -0.0686 -1.5011 4 0.0055 0.2325 -0.0631 -1.3816 5 0.0301 1.2823 -0.0330 -0.7223 6 0.0281 1.1951 -0.0049 -0.1078 7 -0.0027 -0.1146 -0.0076 -0.1668 8 0.0226 0.9604 0.0149 0.3270 9 0.0417 1.7751 0.0566 1.2398 10 0.0658 2.8017** 0.1225 2.6803**
40
Table 6: Abnormal return and cumulative abnormal return and their T-statistics table for LFC
AR T(AR) CAR T(CAR)
-10 0.0629 1.2020 0.0629 0.8134 -9 -0.0191 -0.3649 0.0438 0.5664 -8 0.0021 0.0398 0.0458 0.5933 -7 -0.0320 -0.6113 0.0139 0.1797 -6 -0.0042 -0.0796 0.0097 0.1258 -5 -0.0042 -0.0796 0.0056 0.0719 -4 0.0954 1.8249 0.1010 1.3068 -3 -0.0546 -1.0445 0.0464 0.5999 -2 -0.0858 -1.6403 -0.0394 -0.5101 -1 0.1081 2.0669** 0.0687 0.8886 0 -0.1102 -2.1078** -0.0416 -0.5378 1 -0.0403 -0.7698 -0.0818 -1.0587 2 -0.0360 -0.6888 -0.1178 -1.5248 3 0.0149 0.2854 -0.1029 -1.3317 4 -0.0042 -0.0796 -0.1071 -1.3855 5 0.0391 0.7481 -0.0679 -0.8793 6 -0.0115 -0.2202 -0.0795 -1.0283 7 -0.0204 -0.3896 -0.0998 -1.2920 8 -0.0334 -0.6385 -0.1332 -1.7241 9 0.0120 0.2295 -0.1212 -1.5688 10 -0.0231 -0.4417 -0.1443 -1.8677
41
Table 7: Abnormal return and cumulative abnormal return and their T-statistics table for ZNH
AR T(AR) CAR T(CAR)
-10 -0.0540 -0.5655 -0.0540 -0.0540 -9 0.0665 0.6962 0.0125 0.0125 -8 0.0136 0.1427 0.0261 0.0261 -7 -0.0361 -0.3780 -0.0100 -0.0100 -6 0.0021 0.0219 -0.0079 -0.0079 -5 0.0051 0.0537 -0.0028 -0.0028 -4 0.0051 0.0533 0.0023 0.0023 -3 -0.0203 -0.2131 -0.0180 -0.0180 -2 -0.0306 -0.3203 -0.0486 -0.0486 -1 0.0219 0.2295 -0.0267 -0.0267 0 -0.4174 -4.3728*** -0.4440 -0.4440 1 0.0370 0.3875 -0.4071 -0.4071 2 0.0027 0.0283 -0.4044 -0.4044 3 -0.0149 -0.1557 -0.4192 -0.4192 4 0.0179 0.1874 -0.4013 -0.4013 5 0.0156 0.1633 -0.3857 -0.3857 6 0.0330 0.3454 -0.3528 -0.3528 7 0.0066 0.0686 -0.3462 -0.3462 8 -0.0207 -0.2167 -0.3669 -0.3669 9 -0.0277 -0.2898 -0.3946 -0.3946 10 0.0055 0.0577 -0.3891 -0.3891
***result is significant at 1% significance level
42
Table 8: Abnormal return and cumulative abnormal return and their T-statistics table for GSH
AR T(AR) CAR T(CAR)
-10 0.0061 0.1744 0.0061 0.0659 -9 0.0062 0.1758 0.0123 0.1322 -8 0.0539 1.5323 0.0662 0.7107 -7 -0.0164 -0.4667 0.0498 0.5345 -6 0.0663 1.8852 0.1160 1.2462 -5 -0.0404 -1.1488 0.0756 0.8125 -4 0.0386 1.0972 0.1142 1.2267 -3 0.0090 0.2565 0.1232 1.3236 -2 0.0582 1.6567 0.1815 1.9490* -1 0.0475 1.3503 0.2289 2.4588** 0 -0.0476 -1.3538 0.1813 1.9477* 1 -0.0014 -0.0386 0.1800 1.9331 2 0.0245 0.6966 0.2045 2.1961** 3 0.0608 1.7310 0.2653 2.8496** 4 0.0094 0.2663 0.2747 2.9501** 5 -0.0144 -0.4087 0.2603 2.7958** 6 -0.0014 -0.0386 0.2590 2.7812** 7 -0.0014 -0.0386 0.2576 2.7666** 8 0.0384 1.0928 0.2960 3.1792*** 9 -0.0198 -0.5629 0.2762 2.9667** 10 -0.0452 -1.2850 0.2311 2.4816**
*result is significant at 10% significance level **result is significant at 5% significance level ***result is significant at 1% significance level
43
Table 9: Abnormal return and cumulative abnormal return and their T-statistics table for NHP
AR T(AR) CAR T(CAR)
-10 -0.0240 -1.0836 -0.0240 -0.6825 -9 0.0123 0.5559 -0.0117 -0.3323 -8 0.0085 0.3857 -0.0031 -0.0894 -7 -0.0116 -0.5223 -0.0147 -0.4184 -6 -0.0020 -0.0917 -0.0168 -0.4761 -5 -0.0293 -1.3229 -0.0461 -1.3093 -4 -0.0451 -2.0338* -0.0911 -2.5903** -3 0.0245 1.1057 -0.0666 -1.8939 -2 0.0178 0.8054 -0.0488 -1.3866 -1 -0.0379 -1.7083 -0.0866 -2.4626** 0 -0.0254 -1.1476 -0.1121 -3.1854*** 1 0.0391 1.7655 -0.0729 -2.0734* 2 0.0273 1.2312 -0.0457 -1.2979 3 -0.0274 -1.2386 -0.0731 -2.0781* 4 -0.0120 -0.5402 -0.0851 -2.4183* 5 -0.0047 -0.2129 -0.0898 -2.5524** 6 0.0067 0.3005 -0.0831 -2.3632* 7 -0.0116 -0.5213 -0.0947 -2.6915** 8 -0.0020 -0.0887 -0.0967 -2.7474** 9 -0.0130 -0.5863 -0.1096 -3.1166** 10 0.0017 0.0770 -0.1079 -3.0682**
*result is significant at 10% significance level **result is significant at 5% significance level ***result is significant at 1% significance level
44
Table 10: Abnormal return and cumulative abnormal return and their T-statistics table for PTR
AR T(AR) CAR T(CAR)
-10 0.0639 0.0905 0.0639 0.5737 -9 0.0109 0.4660 0.0747 0.0978 -8 -0.0192 -0.0683 0.0556 -0.1724 -7 -0.0161 0.1267 0.0394 -0.1449 -6 -0.0361 0.6447 0.0033 -0.3246 -5 0.0188 0.2976 0.0220 0.1685 -4 -0.0224 -0.2857 -0.0003 -0.2011 -3 0.0417 0.5896 0.0414 0.3747 -2 -0.0102 -1.0211 0.0312 -0.0917 -1 0.0172 0.1638 0.0483 0.1541 0 -0.1257 -0.3008 -0.0774 -1.1293 1 0.0076 0.5893 -0.0698 0.0685 2 -0.0341 -0.9775 -0.1038 -0.3061 3 -0.0705 0.2313 -0.1744 -0.6335 4 0.0293 -0.5025 -0.1451 0.2632 5 -0.0652 -0.5864 -0.2102 -0.5856 6 0.0082 1.1779 -0.2021 0.0735 7 0.0243 -0.1477 -0.1777 0.2184 8 -0.0091 -0.5551 -0.1869 -0.0818 9 -0.0249 0.2406 -0.2117 -0.2234 10 -0.0191 -0.7493 -0.2308 -0.1718
45
Appendix 3
Table 11: Regression Results
Panel A: ROEit = α + β1 ln(TAit) + β2 DTAit + β3 CLit + β4 BMit + β5 CGit + β6 CSit
+ β7 Fit + β8 HCit + β9 Iit +β10 OGit +β11 Tit +β12 Uit + εit
Variable Coefficient Std. Error t-Statistic Prob.
TA -0.300155 0.188592 -1.591552 0.1120 DTA -0.001488 0.006145 -0.242191 0.8087 CL 1.578750 1.186597 1.330485 0.1839 BM 6.449253 3.911430 1.648823 0.0997 CG 6.258039 3.919961 1.596455 0.1109 CS 4.519653 3.961015 1.141034 0.2543 F 6.495250 4.082608 1.590956 0.1122 HC 6.363673 4.794796 1.327204 0.1850 I 6.585298 3.927698 1.676630 0.0942 OG 6.526143 4.316033 1.512070 0.1311 T 7.704990 4.080894 1.888064 0.0595 U 5.433852 3.905545 1.391317 0.1647
R-squared 0.016376 Mean dependent var 0.271274
Panel B: ROAit = α + β1 ln(TAit) + β2 DTAit + β3 CLit + β4 BMit + β5 CGit + β6
CSit + β7 Fit + β8 HCit + β9 Iit +β10 OGit +β11 Tit +β12 Uit + εit
Variable Coefficient Std. Error t-Statistic Prob.
DTA 0.099158 0.001511 65.61311 0.0000 TA -0.068172 0.046384 -1.469741 0.1422 CL 0.165255 0.291841 0.566249 0.5714 BM 1.202785 0.962009 1.250285 0.2117 CG 1.476710 0.964107 1.531687 0.1262 CS 1.646042 0.974204 1.689627 0.0916 F 1.496755 1.004110 1.490629 0.1366 HC 1.549900 1.179271 1.314287 0.1893 I 1.926324 0.966010 1.994104 0.0466 OG 1.582801 1.061520 1.491070 0.1365 T 1.438263 1.003688 1.432978 0.1524 U 1.171600 0.960561 1.219704 0.2231
R-squared 0.896345 Mean dependent var 0.466660
Panel C: TATit = α + β1 ln(TAit) + β2 DTAit + β3 CLit + β4 BMit + β5 CGit + β6 CSit
+ β7 Fit + β8 HCit + β9 Iit +β10 OGit +β11 Tit +β12 Uit + εit
Variable Coefficient Std. Error t-Statistic Prob.
DTA 0.709558 0.019275 36.81144 0.0000
TA -2.196715 0.591611 -3.713110 0.0002
CL 8.725659 3.722333 2.344137 0.0194