THESIS
ANALYSIS OF NUTRIENT REMOVAL AT THE DRAKE WATER RECLAMATION FACILITY
Submitted by Lincoln H. Mueller, Jr
Department of Civil and Environmental Engineering
In partial fulfillment of the requirements Fort the Degree of Master of Science
Colorado State University Fort Collins, Colorado
Spring 2016
Master’s Committee:
Copyright by Lincoln H. Mueller, Jr. 2015 All Rights Reserved
ABSTRACT
ANALYSIS OF NUTRIENT REMOVAL AT THE DRAKE WATER RECLAMATION FACILITY
Since the 1960’s, the Federal Government through the United States Environmental Protection Agency (USEPA) has been working to create and enforce regulations to protect and counteract the degradation experienced in the nation’s waterways due to increased nutrient loading
(primarily phosphorus and nitrogen). The eutrophication caused by excess levels of these nutrients is not only an aesthetic issue, but is toxic to aquatic life and can also create issues detrimental to human health. In 2007, the Colorado Department of Public Health and
Environment began working on new nutrient regulations for state dischargers, particularly larger Publicly Owned Treatment Works (POTWs) like the City of Fort Collins and its two wastewater treatment plants, Mulberry Water Reclamation Facility (MWRF) and Drake Water Reclamation Facility (DWRF). Since 2008, The City of Fort Collins has been upgrading its secondary
treatment systems to Biological Nutrient Removal (BNR) in preparation for National Pollutant Discharge Elimination System (NPDES) permit compliance in 2020. Early in the design process, it was determined that DWRF suffered from a limitation in influent carbon for adequate nutrient removal and carbon addition would need to be considered. The City analyzed various local carbon sources and has been working to determine the viability of beer waste from local
wastewater treatment Master Plan to consistently meet Colorado’s Regulation 85 nutrient discharge limits.
This study included monitoring of nutrient water quality values at specific points in the treatment system while adding beer waste at varying flow rates and durations to determine its effect on the system. Different automated control strategies were tested using several dosage schemes
including Oxidation Reduction Potential (ORP) values. Finally, water quality data was analyzed and compared alongside historical nitrogen and phosphorus values to evaluate the effects of the beer waste addition to effluent quality and plant removal performance.
The initial values for effluent total inorganic nitrogen showed promise, averaging 9.79 mg/L in comparison to 12.05 mg/L when beer waste was not added. However, a mass balance
comparison with influent nitrogen values showed no significant difference in BNR process performance for nitrogen with the beer addition. Effluent phosphorus values averaged 2.24 mg/L-P which was slightly lower than without beer waste addition (2.42 mg/L), but not considered a statistically significant decrease. During the study, an observation was made that adjusting time-of-day and flowrate of the dewatering centrate return significantly decreased effluent phosphorus concentrations down to 1.1 mg/L, significantly lower than P concentrations without beer addition (p < 0.05). An analysis of phosphorus removal at DWRF also highlighted the historical improvement of phosphorus removal as BNR improvements are brought on-line,
added to DWRF and lower effluent P concentrations were also achieved as long as centrate return flow was controlled. Additional study is required for long-term control of centrate return flows which may include the analysis of side-stream treatment solutions. Additional analysis to determine the role of beer waste addition independent of centrate flow returns is also
ACKNOWLEDGEMENTS
I would like to first thank my advisor, Dr. Sybil Sharvelle for her knowledge and support in helping me to achieve this goal. Her guidance in assisting me to work through a study of real-time conditions helped me to complete the project despite the inevitable issues that arose in dealing with biological processes.
I would also like to express my gratitude to Owen Randall, Carol Webb, and Kevin Gertig with the City of Fort Collins Utilities for making it possible both financially through the Utilities’ tuition assistance program and flexibility with my schedule to complete this work.
I would also like to acknowledge all the help and support from the plant staff at Drake Water Reclamation Facility. This project would have been short-lived without their assistance in testing, troubleshooting, and maintaining and operating the pilot test. A special thanks to Ramon Arguello for his support in the whole pilot process and his years of insight in treatment processes which helped considerably when results were not as anticipated.
Most importantly I’d like to express my love and appreciation to my wife, Nancy, and daughters, Rebecca and Cassandra, for supporting me through this entire endeavor. Without their love and extreme patience this would not have been possible.
TABLE OF CONTENTS
List of Tables ... xi
LIST OF Figures ... xii
1 Introduction ... 1
1.1 Research Motivation ... 1
1.2 Research Objectives ... 2
2 Background and Literature Review ... 4
2.1 National Nutrient Timeline ... 4
2.2 Health Effects of Nitrate and Nitrite ... 5
2.3 Colorado Regulations... 6
2.4 Current Limits and Performance ... 8
2.5 Nutrient Removal Process Selection ... 9
2.6 City of Fort Collins Water Reclamation Facility Layout and Process Descriptions .... 10
2.6.1 Overall Treatment System Layout ... 10
2.6.2 Mulberry Water Reclamation Facility Process Flow Diagram ... 11
2.7.3 BNR Facility Design for Phosphorus Removal ... 17
2.8 Nitrogen Removal ... 18
2.8.1 Introduction ... 18
2.8.2 Nitrification ... 19
2.8.3 Facility Design for Nitrification... 22
2.8.4 Denitrification ... 22
2.8.5 Denitrification Microbiology ... 23
2.8.6 Facility Design for Denitrification ... 25
2.9 Previous Work to Address Carbon Limitations at DWRF... 27
2.9.1 Evaluation of Carbon Sources ... 28
2.9.2 Beer Waste Bench-Scale Testing ... 30
2.9.3 Mulberry Water Reclamation Facility 2012 Pilot Test ... 31
2.9.4 Drake Water Reclamation Facility Pilot 2013 ... 32
2.10 Carbon Dosing ... 34
2.11 Use of Oxidation Reduction Potential for Carbon Dosing Control ... 35
2.11.1 Oxidation Reduction Potential Defined ... 35
3.1 Introduction ... 41
3.2 DWRF Carbon Addition Pilot 2015 Setup ... 42
3.2.1 Beer Waste Addition Modifications ... 43
3.2.2 Proposed Sample Locations and Parameters ... 44
3.2.3 North Process Train Layout and Sample Locations ... 46
3.3 Water Chemistry Testing ... 47
3.3.1 Wet Chemistry Testing Locations ... 47
3.3.2 Process Water Chemistry Analytical Methods ... 47
3.3.3 Laboratory Water Quality Methods ... 49
3.4 Water Quality Instrumentation ... 49
3.4.1 Water Quality Probe and Analyzer Locations ... 49
3.5 Statistical Tools ... 51
3.6 Results and Discussion ... 53
3.6.1 Drake Water Reclamation Facility Water Quality Results ... 53
3.6.1.1 Baseline Data ... 53
3.6.1.1.1 Timeframes of Sampling ... 53
3.6.1.2.1 Centrate Influence ... 57
3.6.1.2.2 Comparison of Experiment Phosphorus Data to Historical Data ... 59
3.6.1.2.3 Phosphorus Results ... 60 3.6.1.2.4 Phosphorus Summary ... 63 3.6.1.3 Nitrogen Removal... 64 3.6.1.3.1 Nitrogen Values... 64 3.6.1.3.2 TIN Discussion ... 66 3.6.1.3.3 Nitrogen Summary ... 67
3.6.2 Beer Waste Monitoring ... 67
3.6.2.1 Introduction ... 67
3.6.2.2 Beer Waste Chemical Oxygen Demand (COD) ... 68
3.6.2.3 Beer Waste Volatile Fatty Acids (VFA) ... 68
3.6.2.4 Beer Waste Quantity ... 69
3.6.2.5 Beer Waste Summary ... 70
3.6.3 Carbon Dosing ... 70
3.6.3.1 Introduction ... 70
References ... 74 Appendix A: Statistical T-Test Data ... 78
LIST OF TABLES
Table 2-1 Regulation 85 limits for existing facilities ... 6
Table 2-2 DWRF Permit Limits ... 8
Table 2-3 Biological Phosphorus Removal Carbon Requirements ... 27
Table 2-4 Studied Carbon Sources for Enhanced Bio-P ... 29
Table 2-5 Studied Carbon Sources for Denitrification ... 29
Table 2-6 Water Quality Data for Studied Beer Waste Sources ... 30
Table 3-1Water Quality Sample Locations ... 47
LIST OF FIGURES
Figure 2-1 Extracted from Examples of Pollution ... 4
Figure 2-2 Map of Regulation 85 Affected Watersheds and Facilities ... 7
Figure 2-3 A2O process schematic (Municipal Wastewater Treatment Technologies) ... 10
Figure 2-4 Fort Collins Wastewater Plant Locations ... 11
Figure 2-5 Mulberry Water Reclamation Facility Process Flow Diagram ... 12
Figure 2-6 Drake Water Reclamation Facility Process Flow Diagram ... 13
Figure 2-7 Phosphorus Accumulating Organisms ... 15
Figure 2-8 - Schematic of Biological Phosphorus Removal Process ... 16
Figure 2-9 Nitrification Schematic ... 20
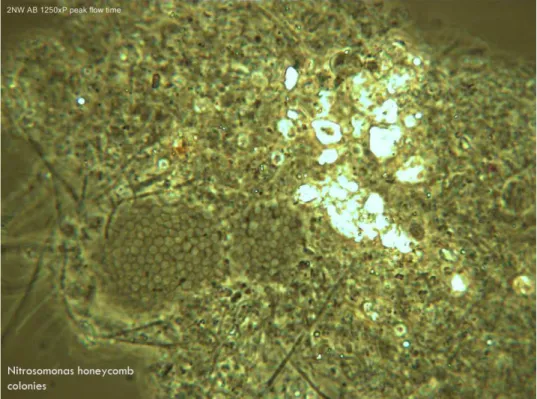
Figure 2-10 - Nitrosomonas Nitrifying Bacteria ... 21
Figure 2-11 Nitrobacter Nitrifying Bacteria ... 21
Figure 2-12 DWRF North Process Train Aeration Zones ... 22
Figure 2-13 Schematic of Denitrification ... 24
Figure 2-14 Picture of Denitrifying Bacteria ... 24
Figure 2-15 DWRF North Process Train Anaerobic and Anoxic Zones ... 26
Figure 2-16 Acetic Acid Concentrations from Bench Scale Testing ... 31
Figure 2-17 Phase 2 Carbon Feed System ... 32
Figure 3-2 Diagram of DWRF excerpt from ... 45
Figure 3-3 Diagram of DWRF North Process Train ... 46
Figure 3-4 Water Quality Instrumentation Locations ... 50
Figure 3-5 - Box Plot Definitions ... 52
Figure 3-6 DWRF Baseline Flow Data ... 54
Figure 3-7 - Effluent Flow vs Phosphorus - Typical Week ... 54
Figure 3-8 Baseline Phosphorus Profile ... 55
Figure 3-9 Beer Waste Flow vs Effluent PO4 - Typical Pilot Week ... 56
Figure 3-10 Centrate Flow vs Effluent PO4 plots ... 57
Figure 3-11 Centrate Timed Feed vs Effluent Phosphorus ... 58
Figure 3-12 DWRF Effluent TPO4 History... 60
Figure 3-13 DWRF Influent TPO4 History ... 61
Figure 3-14 DWRF Phosphorus Removal Efficiency based on lbs TPO4 removed per day ... 63
Figure 3-15 DWRF Effluent Total Inorganic Nitrogen (TIN) History ... 64
Figure 3-16 DWRF Influent NH3 History ... 65
Figure 3-17 DWRF Nitrogen Removal Efficiency based on lbs N removed per day ... 66
Figure 3-18 Beer Waste COD Values - (7/17-9/15) ... 68
Figure 3-19 Beer Waste Volatile Fatty Acids - (7/15-9/15) ... 69
1 INTRODUCTION
1.1 Research Motivation
In 2007 the State of Colorado, under pressure from the United States Environmental Protection Agency (USEPA), began working on stricter nutrient effluent limits for wastewater treatment facilities. Concentrating on phosphorus and nitrogen removal, the Colorado Department of Public Health and Environment (CDPHE) began a multi-year process with stakeholder groups to develop technology-based standards that would balance the need for environmental protection with the financial impacts of the new requirements. Adopted in June 2012, the Nutrients
Management Control Regulation (Reg 85) required plants the size of the City of Fort Collins’ to meet an annual median of 1.0 mg/L or less Total Phosphorus and 15 mg/L or less Total Inorganic Nitrogen (TIN). TIN is the sum of Nitrate (NO3) as N, Nitrite (NO2) as N, and Ammonia (NH3)
as N.
Due to the impending failure of treatment processes at the City of Fort Collins’ Mulberry Water Reclamation Facility (MWRF), the City was unable to wait for the final regulations to be
completed and with the help of the City’s consulting engineer, MWH Global, made a reasonable attempt to predict and design for the future regulations. The was converted between 2008 and 2011 to a Biological Nutrient Removal (BNR) process from the Trickling Filter/Activated Sludge Process that had been in place since the 1940’s. Drake Water Reclamation Facilities’
One major challenge with BNR is the need for additional organic carbon to fuel the additional biological processes. Both Biological Phosphorus Removal (BioP) and denitrification require additional carbon with BioP requiring specific types of carbon high in Volatile Fatty Acids (VFAs). During the upgrade of MWRF, the primary clarifiers were removed from the treatment system and other upgrades completed so that most of the maximum amount of influent carbon is sent to the secondary process. DWRF’s configuration and need for primary sludge for the anaerobic system precluded this solution. The 2009 Master Plan predicted this carbon limitation from the characterization analysis of the plant’s influent. Starting in 2010, Fort Collins began looking at its industrial clients for possible local sources of high strength carbon. Several local breweries high strength liquid waste appeared to fit the bill and a multi-year study of the potential use of this material began.
From the bench-scale tests at the Utilities’ Pollution Control Lab and through a short-term pilot at MWRF, the Utility learned by trial and error the idiosyncrasies of working with beer waste. In 2012 and 2013 two phases of pilot-scale testing were conducted at DWRF with beer waste. The ability to properly dose the additional carbon seemed to be one of the larger challenges to this carbon addition practice.
1.2 Research Objectives
by the end of 2015 with a compliance schedule for meeting phosphorus and nitrogen discharge limits. The specific objectives are as follows:
• Assess water quality plant-wide at each key stage of the process as it relates to nutrient removal. To meet this objective, an extensive sampling effort will be conducted over a six week period and historical data will be reviewed and analyzed.
• Monitor the quality and quantity available for the beer waste currently being utilized as a potential long-term carbon source. Sampling of beer waste carbon and VFA values both in the trucks delivering the product and in the storage tank will be conducted. Daily beer waste delivery volumes and frequency will also be recorded.
• Evaluate dosing options for controlling the feed rate of carbon addition to meet nutrient removal parameters without adversely affecting process. To meet this objective nitrate and ORP probes will be continuously monitored to evaluate the relationships between denitrification, ORP, carbon dosing and effluent quality.
2 BACKGROUND AND LITERATURE REVIEW
2.1 National Nutrient Timeline
While phosphorus and nitrogen are the building blocks of organic life, high concentrations in lakes, reservoirs, and receiving waters can lead to lower dissolved oxygen levels, poison aquatic life and eutrophication (Figure 2-1) In the mid-1960’s, the Federal government enacted
environmental legislative reforms to facilitate the control of nutrient pollution (primarily phosphorus at the time) to obtain a consistent approach to pollution control.
United States. Coming out of the 1990’s and into the 21st century, most POTW’s provided good secondary process removal of Biochemical Oxygen Demand (BOD), Total Suspended Solids (TSS), and Ammonia, but did little to removal phosphorus and other nitrogen species from the effluent.
Continued problems with eutrophication and nitrates in drinking water sources caused the United States Environmental Protection Agency (USEPA) to push States to enact more stringent nutrient removal standards. While high levels of phosphorus are generally attributed to driving eutrophication in surface waters, health risks and toxicity to aquatic life are the motivation for stricter regulations of ammonia in receiving waters. Nitrate and nitrite are regulated due to concern for drinking water quality and human health impacts.
2.2 Health Effects of Nitrate and Nitrite
In 1974 Congress passed the Clean Water Act that requires the EPA, to set limits for certain contaminants for drinking water to be safe for consumption. In 1992, the Phase II rule set limits on Nitrite and Nitrate in drinking water. The Maximum Contaminant Level (MCL) for Nitrite was set at 1 mg/L primarily due to the risk of Methemoglobinemia. This is a syndrome in human infants where nitrite combines with hemoglobin and inhibits the transport of oxygen. Nitrite levels rarely reach or sustain these levels in drinking source waters, but nitrate can be reduced to nitrite in the non-acidic stomachs of infants causing the syndrome so the MCL for nitrate is 10
2.3 Colorado Regulations
In 2007, CDPHE’s impending Regulation 85 for nutrient removal was the reason for Fort Collins’ pre-emptive development of its nutrient removal facilities. Table 2-1 shows the published limits for existing domestic wastewater treatment plants identified prior to May 31, 2012.
Table 2-1 Regulation 85 limits for existing facilities (Colorado Department of Public Health and Evironment, 2012)
Both MWRF and DWRF’s North Process Train were designed prior to the final ruling on Regulation 85, but it was projected that set nutrient discharge limits would take into consideration the limits of technology and Biological Nutrient Removal (BNR) could be utilized without the requirement for chemical addition. Unfortunately, while this was the case for the nitrogen limits, phosphorus removal would treatment modifications (e.g. physicochemical phosphorus removal, carbon addition to BNR etc.).
Figure 2-2 Map of Regulation 85 Affected Watersheds and Facilities (Colorado Department of Public Health and Environment, 2012)
Arguments were made to wait on implementing nutrient removal until the State finalized the proposed limits. However, as two of the larger plants in the priority watersheds (Figure 2-2), it was theorized that both Fort Collins’ wastewater treatments plants would be among the first plants required to upgrade to the Regulation 85 standards. Waiting could potentially cost the rate payers of Fort Collins considerably more if the required upgrades to both plants did not take nutrient removal into consideration.
the Regulation 85 limits. It is anticipated that the permit negotiations will begin for the City by Fall 2015 with the potential for a new permit by Spring 2016. The most likely scenario is that a compliance schedule will be granted to allow the City to finish any remaining improvements required to meet the new nutrient limits.
2.4 Current Limits and Performance
Table 2.1 shows the current limits in the City’s 2012 permit. The limits shown are the most stringent limits in permits. Discharge limits for ammonia and chlorine residual for DWRF’s discharge into the Fossil Creek Reservoir Inlet Ditch (FCRID) are much more lenient.
maintaining nitrification due to maintaining adequate populations of nitrifying microorganisms at lower temperatures.
2.5 Nutrient Removal Process Selection
During the development of the design for MWRF and the 2009 Master Plan from 2007-2009, various nutrient removal processes were analyzed. MWRF’s processes and infrastructure had been rapidly failing between the years 2004-2007 primarily due to several low pH events that killed the plant’s trickling filter and accelerated the failure of the 60-year old infrastructure. Pressure was on the City to come up with a design and construct a new facility prior to actually knowing the ultimate limits that would be imposed on the plant. In the end, a three-stage
Anaerobic Anoxic, Oxic (A2O) process was selected (Figure 2-3). The three primary reasons for the selection of this style of process were:
• It could meet the nutrient removal criteria proposed at the time • The process could easily be incorporated into existing infrastructure
• The process could be easily expanded to a 5-stage Bardenpho process in the event that Enhanced Biological Nutrient Removal (EBNR) was required.
Figure 2-3 A2O process schematic excerpt from Municipal Wastewater Treatment Technologies (U.S. Environmental Protection Agency, 2008)
As shown in Figure 2-3, the A2O provides for simultaneous biological nutrient removal and denitrification. While additional pumping and piping is required, the reduced need for additional concrete tankage more than makes up for the additional mechanical costs.
2.6 City of Fort Collins Water Reclamation Facility Layout and Process Descriptions
2.6.1 Overall Treatment System Layout
The City’s original wastewater treatment plant, MWRF is located on the east side of Fort Collins at the intersection of E. Mulberry Street and Riverside Drive (Figure 2-4). In 1984, MWRF’s anaerobic digesters were decommissioned and all solids
Figure 2-4 Fort Collins Wastewater Plant Locations (Map from City of Fort Collins GIS)
generated at MWRF were sent down a 42-inch transmission line to the City’s second wastewater treatment plant, DWRF located approximately 3 miles southeast of MWRF.
2.6.2 Mulberry Water Reclamation Facility Process Flow Diagram
At MWRF, primary treatment was eliminated in the new BNR process (Figure 2-5) to maximize the influent carbon to the secondary system. The process flow diagram shows the
Figure 2-5 Mulberry Water Reclamation Facility Process Flow Diagram (MWH Global Process Design Report 2009)
future reactors necessary to convert this 3-stage A2O process into a 5-stage Bardenpho process. All scum and waste activated sludge (WAS) discharges from this system enter the 42-inch transmission main and flow down to DWRF.
2.6.3 Drake Water Reclamation Facility Process Flow Diagram
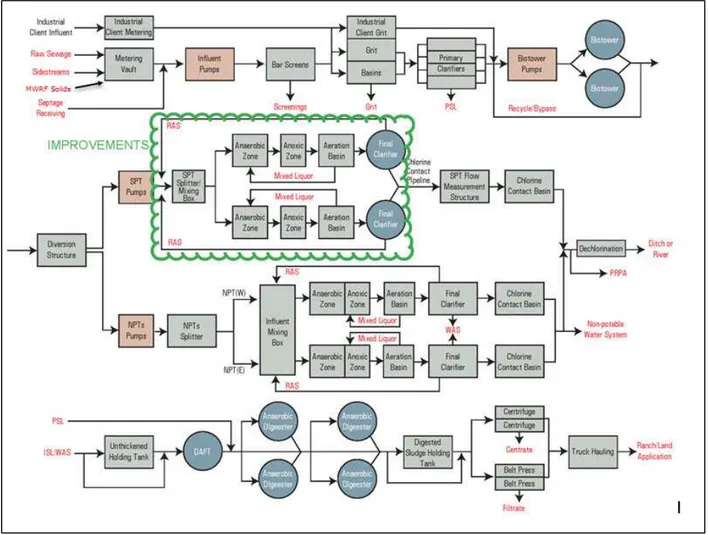
Figure 2-6 shows the process flow diagram for the entire DWRF facility. During the sampling period for this study the area clouded in green was under construction and all flows coming to the plant were sent to the North Process Trains (NPT).
Figure 2-6 Drake Water Reclamation Facility Process Flow Diagram (MWH Global SPT Process Design Report, 2014)
Two items to note in the process flow diagram for DWRF (Figure 2-6) are the MWRF solids coming into the influent metering vault and the plant headworks. This actually is combined with the raw sewage in the transmission line, but shown separately here for clarity. Another item to point out is the centrate discharge from the centrifuges re-enters the system in the sidestreams that return to the influent metering vault.
2.7 Biological Phosphorus Removal
2.7.1 Introduction
In the 1970’s scientists in the United States and South Africa advanced development of Biological Phosphorus Removal (Barnard 2006). Barnard theorized, and then proved, that alternating anaerobic zones with aerobic zones enhanced phosphorus removal by stimulating the growth of Polyphosphate Accumulating Organisms (PAO). Traditional activated sludge
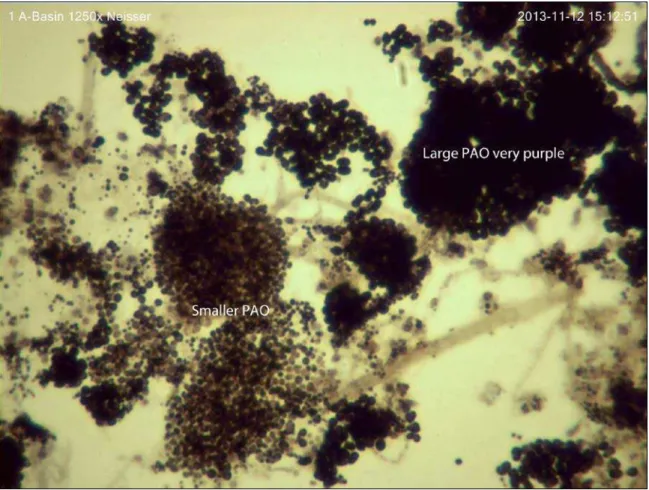
processes removed carbon by the creation of biomass which is then removed from the system by wasting. Phosphorus makes of a 2.67 percent of traditional activated sludge by mass. Enhanced biological phosphorus removal systems that are designed to promote the use and growth of PAO’s can increase that percent removal by 2-5 times that of traditional activated sludge. Several microorganisms identified as PAOs include Accumulibacter phosphatis, Actinobacteria, and Malikia (Prescott, 2005). Figure 2-7 shows PAOs existing in DWRF’s North Process Train
Figure 2-7 Phosphorus Accumulating Organisms (Photo Credit: Cindy Wright-Jones)
The dark nodules within the floc are the accumulated phosphate within the organisms. Weekly observations of microbiology within the aeration basins at DWRF and MWRF show that the darker the nodule, the more phosphorus is accumulated within the floc that is wasted.
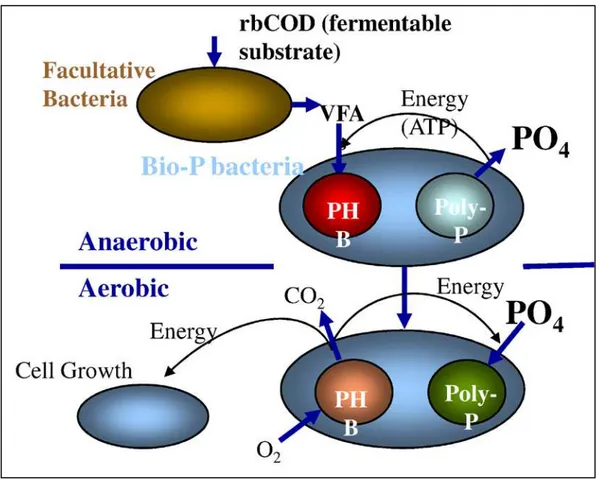
2.7.2 Biological Phosphorus Removal Biochemistry
Because the mechanism of biological phosphorus removal involves cycling between anaerobic and aerobic environments, it is impossible to isolate the effects of PAO and its biochemistry
Figure 2-8 - Schematic of Biological Phosphorus Removal Process (MWH Global 2010)
Short-chain fatty acids trigger phosphorus release as the PAO’s utilize Adenosine Triphosphate (ATP) for energy to sequester the carbon as poly-B-hydroxybutyrate (PHB). These volatile fatty acids (VFA) include acetate, propionate, butyrate, and valeric acid. Their creation is facilitated by fermentation of readily biodegradable carbon in the anaerobic zone.
The presence of free oxygen or nitrate will inhibit the production of PHB. Since the PAOs are facultative heterotrophs, they will utilize the oxygen as a terminal electron acceptor reverting to
During the aerobic phase the PAOs utilize the PHB for growth and reproduction. This depletion of PHB drives the uptake of soluble phosphorus, and since the PAO population has increased, the cumulative removal of phosphorus in the aerobic zone is greater than that released in the anaerobic zone.
2.7.3 BNR Facility Design for Phosphorus Removal
In the A20 process the anaerobic zones are first reactors in the process after the mixing of the Recycled Activated Sludge (RAS) with the effluent from the primary clarifier. Hydraulic retention times (HRT) for these reactors are typically designed for 45 minutes to 1 hour
(Rittmann, 2001). This gives time for hydrolysis and fermentation of the readily biodegradable COD (rbCOD) into VFAs and for the PAO’s to absorb the VFAs, producing PHB in the process. A key indicator that this process is working is the increase in orthophosphate concentration across the basin.
Another design element that takes careful consideration is mixing. Care must be taken not to introduce additional free oxygen into the anaerobic system. Floating mixers are a popular choice for mixing in non-aerated zones at several plants in Colorado. Colorado Springs, Boulder and Fort Collins utilized Aqua-Aerobics floating mixers in the anaerobic zones. Mixing helps maintain a homogeneous concentration throughout the basin which is important in higher solids concentration systems with total suspended solids (TSS) concentrations ranging from 2100-3300
Trains anaerobic zones having a 45 minute detention time at average day flow. The other reason is that both the anaerobic and anoxic zones needed to be contained in the process trains original primary clarifiers so the designer had to balance the available area between the anaerobic and anoxic zones. While obviously important to the enhanced Bio-P process, no structural or mechanical changes were deemed necessary for either the aerobic or final clarifier processes. Process modifications to the dissolved oxygen (DO) concentrations within the three aeration basin aeration zones and sludge blanket depths are adjusted to optimize the process.
2.8 Nitrogen Removal
2.8.1 Introduction
The other nutrient of concern in the upcoming Regulation 85 requirements is nitrogen. Nitrogen enters the plant through the introduction of organic matter, ammonia produced by the breakdown of organic matter within the collection system, or from industrial sources such as nitric acid or ammonia-based cleaners. Another significant source of nitrogen is actually generated within the plant boundaries itself. Centrate generated from the dewatering of anaerobically digested sludge has ammonia concentrations as high as 950 mg/L. The centrate is collected in a storage tank and metered back to the head of the plant (Figure 2-6) and must be taken into account when
combined both DWRF and MWRF’s discharges in a single permit. It required a “report only” for ammonia. The State set a limit on the amount of ammonia allowed in DWRF’s effluent,
requiring improvements to the plant’s secondary processes. The driver was ammonia’s effects on the receiving water quality. Ammonia is toxic to aquatic life and has an oxygen demand of 4.57 g O2/g NH3-N. This high DO demand can be a leading cause of eutrophication in receiving waters. There was not a regulatory requirement for ammonia removal that drove the conversion of the plant’s North Process Train mechanical mixing systems to fine-bubble diffusion in 1992. The existing secondary process was a complete mix system with a total of 8-100 HP mechanical mixers. The primary reasons for this improvement were for energy efficiency and a better activated sludge process based on industry improvements and future changes (Tomerlin, 2015). These improvements converted DWRF to a designed nitrification system.
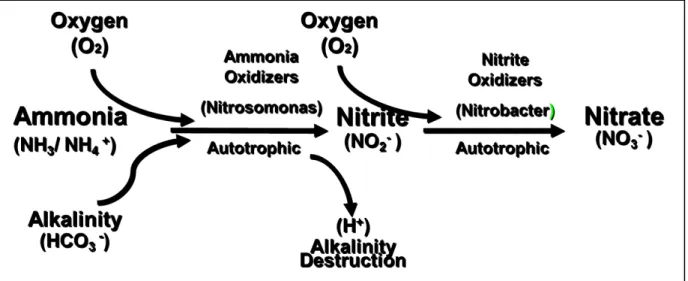
2.8.2 Nitrification
Nitrification is the first of two steps in biological nitrogen removal, in the process sense, if not the physical sense. The process of nitrification involves microbes to oxidize ammonia into nitrate via several steps (Figure 2-6)
Figure 2-9 Nitrification Schematic (MWH Global)
As stated above, ammonia oxidation has a high dissolved oxygen demand, but also a high alkalinity demand. Because the ammonia oxidation process results in an increase in hydrogen ions, bicarbonate is lost due to its reaction to the hydrogen ions in the amount of 7.14 g of alkalinity (as CaCO3) per gram of NH3 oxidized. This leads to plant operational issues because
the 2012 permit modifications increased DWRF’s minimum discharge pH from 6.0 to 6.5. In order to combat alkalinity loss, Mg(OH)2 is added to increase the alkalinity in the aeration basin.
This addition has led to increased struvite scaling in the dewatering centrate system. The BNR improvements installed in DWRF’s NPT in 2011-2012 also have the capability of compensating for the alkalinity loss. This will be explained in Section 2.8.6.
2.8.3 Facility Design for Nitrification
DWRF NPT’s 2 MG aeration basins (Figure 2-6) consist of two passes with a total of three aeration zones. The first pass is evenly divided between the first two aeration zones with the second pass consisting of the entire third aeration zone (Figure 2-12).
Figure 2-12 DWRF North Process Train Aeration Zones
The original Parkson diffuser system was replaced during the 2012 BNR improvements project with a Sanitaire system utilizing approximately 5,800 9-inch ceramic diffusers. Each aeration zone is controlled by Rotork automated valves with Sierra mass flow meters. The aeration zones are balanced utilizing a most open valve control program through the Siemen’s blower master control panel.
DWRF plant staff was already considering modifying the plant process to include denitrification, more for the benefits of alkalinity recovery than reduced nutrient discharge. Between 2006 and 2012 the NPT and SPT operated in a “two-stage” denitrification mode where the first aeration zone was turned down to the minimum air flow required for mixing, thus creating on anoxic zone within the aeration basin. The Recycled Activated Sludge (RAS) flow rate was turned up to simulate Mixed Liquor Return (MLR) and this process modification not only significantly decreased the amount of Mg(OH)2 required for pH adjustment due to nitrification, but decreased power usage plant-wide due to lower aeration requirements.
2.8.5 Denitrification Microbiology
General discussions of denitrification theory usually include the heterotrophic organism’s
reduction of nitrate to nitrite to nitrogen gas. In reality, the complete denitrification cycle consists of four reduction steps (Figure 2-13). All denitrifying bacteria are facultative aerobes (Rittmann, 2001) meaning they can utilize NO3 and NO2 if O2 becomes limiting. Common bacteria include Pseudomonas, Paracoccus, and Halobacterium. Plant microbiologist have indicated that
denitrifying microorganisms are more difficult to identify under a microscope than nitrifiers, but Hyphomicobium can sometimes be seen (Figure 2-14).
While these organisms can be difficult to identify under the microscope, their effect on process makes it fairly easy to determine their existence. One example is when the operators determine that RAS chlorination is required for filament control. During this process, denitrification is usually the first process to drop out due the toxic effects of chlorine on the denitrifiers. The loss of these organisms is indicated by a decrease in available alkalinity in the aeration basin and a decrease in pH due to nitrification. Experience has shown that it typically takes 1-2 weeks for the denitrifying population to recover.
2.8.6 Facility Design for Denitrification
For the selected A2O process, denitrification takes place in the second stage of the BNR process, after the anaerobic zone, but before the aerobic zone. While denitrification prior to nitrification is not intuitive, the reason is to utilize the available carbon remaining in the process for
denitrification while increasing the alkalinity of the mixed liquor prior to nitrification. Full denitrification recovers half of the alkalinity lost during the nitrification process and allows the plant to operate without adding additional chemicals for pH adjustment. DWRF’s anoxic zone (Figure 2-15 ), comprised of approximately 2/3rd of the old intermediate clarifiers is set up in a three-pass serpentine channel to help facilitate plug flow.
Figure 2-15 DWRF North Process Train Anaerobic and Anoxic Zones
Mixers in each pass help maintain the mixed liquor in suspension without adding additional DO into the process.
Another important part of the denitrification design is the mixed liquor return pumps and piping. 15-HP Flygt axial (or wall-fan) pumps were installed during the NPT’s BNR improvements at the end of the aerobic basin (A-basin) to pull the nitrate-rich mixed liquor from the A-basin, prior to discharge to the final clarifiers, and return it to the front pass of the anoxic zone. Two instruments are located at the end of the anoxic zone for monitoring. A Hach ORP probe and a Hach Nitrate probe are located just upstream of the last anoxic pass.
flow split between the east and west trains. The 1.3 foot drop appears to be aerating the mixed liquor which will inhibit denitrification until all free oxygen is consumed.
2.9 Previous Work to Address Carbon Limitations at DWRF
During the 2009 Master Plan development, BioWin modeling of the DWRF processes revealed that both DWRF and MWRF would suffer from carbon limitation in that not enough organic biodegradable carbon was available in the plant’s influent stream to drive the nutrient removal process to the point where Regulation 85 limits could be met. Table 2-3 shows the restrictions predicted based upon the characterization study performed in 2008.
Table 2-3 Biological Phosphorus Removal Carbon Requirements Parameter Suggested Ratio (Water
Environment Federation, 2011)
DWRF
COD:BOD > 2:1 1.76
COD:TKN > 12:1 for sufficient denitrification
10:1
COD:TP 45:1 for efficient
Bio-P removal
51:1
The process improvements completed at MWRF in 2011 were able to compensate for the lack of influent carbon by eliminating the primary clarifiers from the process flow. While this
necessitated improvement of MWRF’s preliminary treatment by upgrading to fine screens and improving the efficiency of the grit removal systems, adequate carbon appears to be available for
These modifications were not deemed practical once the design phase for the NPT improvements commenced. DWRF is dependent on primary sludge for the gas production in the anaerobic digesters. Biogas produced in the digesters is used as fuel for the plant’s two Cleaver-Brooks boilers to heat the digesting sludge to a thermophilic level of 95 degrees F. and provide a heat source for DWRF’s glycol loop which heats approximately half of the facilities’ buildings. The other reason was that the high ammonia and phosphorus concentrations recycled from the sludge dewatering operations would necessitate the addition of carbon to meet the limits imposed by Regulation 85. During the dewatering process, centrate from the centrifuge operations is directed to a centrate holding tank where the liquid is metered back the head of the process in an attempt to level out the ammonia and phosphorus load to the process. Ammonia levels of 950 mg/L – N and Total Phosphorus (TP) load of 120-130 mg/L-P are typical for the return flows accounting for 20-25 percent of the ammonia and phosphorus load to the plant. Research on different carbon sources including costs and safety concerns prompted plant staff and their consulting engineer to evaluate local carbon alternatives in hopes that a nearby source could be more economical, safe, and sustainable. Pilot studies utilizing an available local source were conducted.
2.9.1 Evaluation of Carbon Sources
In 2011 a study for supplemental carbon sources was conducted by MWH. The direction was to find a sustainable source for additional carbon, preferably from a local vender. An evaluation
Table 2-4 Studied Carbon Sources for Enhanced Bio-P (MWH Global, 2013)
Table 2-5 Studied Carbon Sources for Denitrification (MWH Global, 2013)
The City also indicated a preference for a carbon source that would work for nitrogen and phosphorus removal, eliminating Micro C and Methanol from the list. The amount of tankage required for primary sludge fermentation and the odor issues perceived with this form of supplemental carbon decreased the desirability of this option. Given the number of breweries existing in Fort Collins, the City wanted to explore the viability of using industrial waste streams from various breweries for supplemental carbon. Plant staff called the breweries and three were willing to provide samples of their various waste streams for analysis. Table 2-6 shows the laboratory analysis conducted on the waste streams. The truck waste from brewery 2 (Odell’s)
Minimum VFA Strength Available For Bio-P
Carbon Source Strength VFA Strength VFA Flow Rate* Daily Dose 1 Days Storage 2 Days Storage 4 Days Storage
(mg/L) (lb/gal) (gpm) (lb/day) (gal) (gal) (gal)
Primary sludge 4,500 0.04 13.0 695 18,667 37,333 74,667 Whey 18,000 0.15 3.2 695 4,667 9,333 18,667 Beer 5,920 0.05 9.9 695 14,189 28,378 56,757 Acetic Acid 50,000 0.41 1.2 695 1,680 3,360 6,720
Carbon Source Strength COD Strength COD Dose Flow Daily Dose Days of Storage Required Storage Alk. Regen.* % Mg(OH)2
(mg/L) (lb/gal) (gpm) (lb/day) (gal) (lb/day) Reduced
MicroC 650,000 5.36 0.83 6,405 30 35,833 Methanol 1,188,000 9.80 0.33 4,704 30 14,398 Primary sludge 7,000 0.06 84.24 7,006 4 485,236 Whey 65,000 0.54 5.83 4,504 4 33,593 Beer 64,216 0.53 5.25 4,003 4 30,225 Acetic Acid (100%) 1,121,000 9.25 0.30 4,003 30 12,986
* For 12 mgd of influent flow
Table 2-6 Water Quality Data for Studied Beer Waste Sources (MWH Global)
was selected as the experiment source because of it’s high COD, relatively low nutrients, and lower suspended solids.
2.9.2 Beer Waste Bench-Scale Testing
Following the survey of local breweries, the City of Fort Collins began working with Odell’s brewery to try using their brewery waste as a carbon source. The first bench-scale testing in the Summer of 2011 conducted by the City of Fort Collins Pollution Control Lab (PCL), showed that the beer waste was not only an excellent source for Chemical Oxygen Demand (COD), but provided propionic acid (Figure 2-16) which is a desirable source of VFA for BioP removal (Water Environment Federation, 2011). The bench-scale tests also showed indications of increased COD and propionic acid levels when the beer waste was allowed to ferment. The bench-scale tests gave indications that a 2-3 day detention time with adequate stirring achieved the highest values for COD and propionic acid.
Figure 2-16 Acetic Acid Concentrations from Bench Scale Testing
2.9.3 Mulberry Water Reclamation Facility 2012 Pilot Test
MWRF’s 3-stage BNR process came on-line in July 2011, giving the City an opportunity to test carbon addition at one of its own facilities. The elimination of MWRF’s primary clarifiers and the replacement of preliminary treatment with improved screening and grit removal increased the concentration of BOD entering the plant’s secondary system thus decreasing the need for
supplemental carbon addition. It was hoped that the addition of supplemental carbon would help determine the benefits of the beer waste. A 5,000 gallon tanker trailer and a 1.0 hp pump were utilized to feed the waste into the influent stream just before the preliminary effluent pump
mg/L to 0.2 mg/L (MWH Global, 2012). It also revealed that more effort was required in the storage and feed systems due to the heavy sediment loads in the beer waste.
2.9.4 Drake Water Reclamation Facility Pilot 2013
DWRF’s North Process Train conversion to a 3-stage BNR process was completed in September 2012. In February 2013, a 9-week pilot was conducted utilizing beer waste from Odell’s
Brewery. One of the train’s two 16,000 gallon storage tanks was converted to beer waste holding and, learning from the MWRF pilot, 4 horizontally-mounted pumps were installed within the tank to provide constant mixing of the material. A Brendal SPX-25 peristaltic hose pump was temporarily borrowed from the magnesium hydroxide feed system to be utilized as a beer waste feed pump which discharged the beer waste directly into the RAS return as shown in Figure 2-17
The results of this pilot were disappointing due to a number of factors:
• The pump rate of the Brendal SPX-25 used to feed the beer waste maxed out at 1.5 gpm and was insufficient to determine an optimal dosing rate.
• Beer waste supply was not always consistent during most weekends due to reduced production at the brewery so the beer waste flow rate had to be turned down or shut off because of low storage tank levels at the plant
• The Variable Frequency Drive (VFD) used to control the metering pump was not tied into the plant’s Supervisory Control and Data Acquisition (SCADA) system and needed operator intervention to adjust the dosing. During early morning low influent flow periods at DWRF, very low ORP values (< -300 mV) occurred in the anoxic zone and a floating scum layer appeared in the anaerobic zone.
• Finally, due to the lack of available beer waste, the increase in VFA’s due to extended detention times in the holding tank could not be realized. The 2013 pilot study did still show some promise of nutrient removal with decreased effluent phosphorus
concentrations during periods of high beer waste flow (Figure 2-18), so plant staff were directed to continue studying the feasibility of using the beer waste. The two peaks of nitrogen species shown during the test period were the result of RAS chlorination required for filament control.
Figure 2-18 Nutrient Values From Phase 2 Study (MWH Global, 2013)
2.10 Carbon Dosing
One of the issues that needed to be overcome to successfully supplement beer waste to DWRF was adequate dosing control. The MWRF pilot attempted to utilize various types of valves to throttle the flow into the process. The City tried pinch valves, plug valves, and ball valves but all of these had a tendency to clog with the high sediment loads in the beer waste. During the first DWRF pilot, a VFD was incorporated in the system but had to be manually set by an operator. Since neither plant is manned 24 hours a day this setup did not allow for adjustments based upon plant loading. During the aborted pilot attempt in the spring of 2014, time step programing was introduced where the operator could input 4 different flow rates to begin at different times of the
VFA Loading
Detention
2.11 Use of Oxidation Reduction Potential for Carbon Dosing Control
2.11.1 Oxidation Reduction Potential Defined
In wastewater systems where biochemical reactions are taking place, electrons are being
exchanged between different constituents in the reactions. Oxidation causes the loss of electrons by an element while reduction involves the gain of electrons. Since there cannot be a buildup of free electrons in a system (Brezonik, 2011) when a species is oxidized, another is reduced. Wastewater influent contains numerous constituents, so in each reactor vessel there are
multitudes of oxidation and reduction half reactions occurring, making quantitative evaluation of the process state difficult to determine thermodynamically (Peddie, 1988).
Process design can facilitate the prediction of specific reactions such as denitrification in an anoxic zone. The potential for a specific reaction to occur is given in terms of Eo or Reduction Potential. This is the net reaction between the Eo for both the oxidation and reduction half-reactions shown in Equation 2.1
Equation 2-1 Reduction Potential Equation ����� = ����������� − �����������
2.11.2 Historical Perspective on ORP
anaerobic and activated sludge (Hood, 1947). However, in the 1960’s, due to the supposedly insurmountable task of being able to fully rationalize the theoretical aspects of ORP, the common belief that reliable ORP readings were difficult to obtain, and the advent of dissolved oxygen monitors, the use of ORP in wastewater processes was discouraged (Oldham, 1985). The late 1970’s and 80’s brought about the beginnings of full scale Biological Nutrient Removal (BNR) and thus the greater need for a way to monitor processes in environments where free oxygen is neither required or desired. Research began to indicate that although the exact values of ORP reflected all of the factors that contribute to electron activity (biological activity, influent substrate, pH, and temperature), for a given system, the pattern of ORP responses were
reproducible (Peddie, 1988). A sensor similar to a pH probe was found to be most reliable instrument utilizing a platinum indicating sensor measured against an Ag/AgCl reference electrode with electrical contact maintained through a potassium chloride solution. The experimentation also concluded that the only reproducible and reliable method of taking measurements was in-situ monitoring (Oldham, 1985). The ORP probe electrode behavior can also be explained by expansion of Equation 2-1, into the Nernst Equation (Equation 2-2).
Equation 2-2 Nernst Equation � = �0− R × T n × Fln C�� Cred Where:
T = Temperature in K (Kelvin), where T (K) = 273.15 + t°C and t is the temperature of the measured solution
F = Faraday constant (96485 C mol-1) n = electrical charge of the ion
Cox = oxidant concentration in moles/L
Cred = reductant concentration in moles/L.
2.11.3 ORP and Nitrates
As previously discussed, the removal of NO3 is an important goal in DWRF’s nutrient removal
process. The ability to monitor denitrification in the anoxic zone to determine system
performance is critical. Since denitrification involves the reduction (through several steps) of NO3 to N2, the resultant ORP readings for this portion of the process will be negative. Several past research articles provide guidance on the values desired.
In an article published in 1985 (Oldham, 1985), pilot plant process configurations are discussed that were attempting to separate an anaerobic zone in an activated sludge process into two sub-zones, a sludge conditioning zone that denitrified the sludge and a true anaerobic zone that facilitated the production of VFAs which at the time was thought to facilitate the phosphorus release portion of enhanced Bio-P removal. Figure 2-19 shows an interesting tendency that the
Figure 2-19 ORP values within Sludge Conditioning Zone (Oldham, 1985)
lowest NO3 values occur in the -150 mV to -250 mV range. The study also noted that the ORP
readings seem to depend on the mass of nitrates entering the system via the RAS, and the amount of denitrification taking place which was also dependent on the influent waste strength. This information would seem to indicate a range to attempt to maintain for maximum denitrification. In the 1990’s several papers were written on studies attempting to utilize ORP readings to automatically control aeration in Sequencing Batch Reactors (SBR). The first study (Wareham,
Figure 2-20 Chart showing Nitrate bend points
After the first knee, the ORP readings make a steep decline, indicating the reduction of the nitrate through the different species to nitrogen gas. At the completion of the denitrification the ORP readings then take an even sharper decline seeming to indicate a true anaerobic phase until the aeration was restarted. For the purposes of our investigation, this provides a distinct link
Several years later, another study (Plisson-Saune, 1996) provided additional clarification to the ORP-nitrogen relationship. It was determined that the first ORP deflection point was not due primarily to the elimination of NH3, but due to the increase in DO after the oxidation of NH3 was complete. Another finding in this study was the reason for the sudden increase the negative slope of the ORP readings at the end of the denitrification period. After the elimination of nitrate, sulfate-reducing bacteria increase their reduction activity causing the downward trend. This will be a condition the current investigation will seek to avoid since not only will having the anoxic zone in this extremely low ORP condition be a waste of carbon, but the plant desires to minimize the excess production of sulfides to avoid odor and corrosion issues.
Based upon the research it appears that ORP can be a valid indication of successful
denitrification. While exact measurements of ORP readings due not appear to be useful, past data appears to indicate that ORP readings are repeatable and can be used to indicate the state of nitrogen in an process environment. A control description for the beer waste dosage pump was programmed to increase or decrease its flow rate in an attempt to maintain an ORP value of -280 mV. If the ORP reading decreases to below -300 mV, the flow rate for the pump would
decrease, reducing the carbon feed to the anaerobic and anoxic zones. If the ORP value increased to above -250 mV the beer waste flow would increase to add additional carbon to the system. The control description will be adjusted as necessary to optimize denitrification in the anoxic zone.
3 PILOT TESTING TO ANALYZE THE EFFECTIVENESS AND DOSAGE OF BEER WASTE ON AN ANAEROBIC ANOXIC OXIC (A2O) BIOLOGICAL NUTRIENT
REMOVAL PROCESS
3.1 Introduction
The City of Fort Collins Water Reclamation Facilities Master Plan Update 2009 proposed an A2O process for the DWRF’s North Process Train. The A2O processes major advantage over other BNR processes was its ability to be “easily” expanded to a 5-stage Bardenpho process in the event that more stringent regulations are implemented in the future. While the 3-stage A2O process can theoretically meet the nitrogen and phosphorus limits identified in the State’s regulation 85, the second tier improvements that could come into play after the State’s nutrient evaluation in 2023 could result in the need for enhanced nutrient removal (ENR) with the 5-state Bardenpho plus chemical additional and tertiary filtration for more phosphorus removal.
It was also determined that DWRF carbon limitations would impact ability to meet the
Regulation 85 requirements (MWH Global, 2009) even with the A2O improvements. Some form of carbon addition capable of driving denitrification and enhanced BioP was going to be needed. Following the lead of the Colorado Springs Utilities (CSU), the City of Fort Collins, began a search of local industries to determine if there was a locally available carbon source to augment the secondary treatment process. In 2009, CSU began working with a local Colorado Springs dairy to utilize dairy whey to fuel their nutrient removal process (Brischke, Olds, Adams,
The bench-scale testing discussed in Section 2.9.2 showed that beer waste could be a viable carbon source to provide the required substrate for meeting the nutrient limits set forth in Regulation 85. Starting from the lessons learned from the previous pilot phases, the 2015 pilot was modified and during the initial 6-week period added beer waste at different dosages, durations and times of the day to observe its impact on process performance.
3.2 DWRF Carbon Addition Pilot 2015 Setup
In July 2015 DWRF plant staff began the addition of beer waste to the North Process Train. Figure 3-1 shows the beer waste addition setup. Beer is loaded off the beer truck at the north chemical receiving dock. The 2000-gallon tanker truck used a pressure/vacuum pump to off-load the beer which travels approximately 200 feet down the north tunnel through a 3-inch fibercast pipe into the tank.
3.2.1 Beer Waste Addition Modifications
Lessons learned from the 2013 DWRF pilot and the aborted 2014 attempt at carbon addition led to numerous improvements for the 2015 attempt. The following is a list of improvements added:
• In addition to the existing recirculation pump which was an existing progressive cavity gear pump that draws off the bottom of the tank and discharges into the top of the far south end, four horizontally mounted 1-HP sump pumps were added. The pumps were positioned such that two adjacent pairs would discharge toward each other and create a vertical vortex mixing pattern. This setup should help prevent the solids deposition that occurred during the last attempts.
• The Chemical Feed Pump was upgraded from the SPX-25 to a Brendel SPX-40. The reasoning for this pump selection is that it is the same model and capacity of pump that is used in the polymer feed system and can be used as a spare. The pump rate span it larger than needed ( 2-13 gpm) but plant staff was able to decrease the motor frequency enough utilizing a Variable Frequency Drive (VFD) that a pump rate of 0.5 gpm could be
achieved. Once a permanent system is installed, a more suitable pump for this application may be a Brendel SPX-32 with a range of 0.5- 9 gpm.
• The pump (VFD) was connected directly into the SCADA system allowing for system automation. The control schemes available were constant flow rate, timed-step flow, and variable flow based on ORP readings.
these conditions. During this phase, the carbon injection point was relocated to a point at the bottom of the RAS line approximately 20 feet closer to the mixing box. This helped divide the carbon addition more equally between the two basins during different flow conditions.
3.2.2 Proposed Sample Locations and Parameters
Analyzing wastewater characteristics before and after secondary treatment is important in determining what is happening in the secondary treatment process. Figure 3-2 is a layout diagram of DWRF identifying all of the major facilities. The sample locations identified are locations that have existing composite samplers that are utilized by the Pollution Control Lab (PCL) and plant staff for regulatory and process control sampling. These composite samplers are set up on a flow-paced sampling protocol where a solenoid valve opens and draws a set sample volume upon receiving a digital signal from a Programmable Logic Controller (PLC). The PLC sends the signal, or pulse, for every 10,000 gallons read on the influent metering flume. The first location in the wastewater process that the pilot will be conducting additional tests is “2CINF” (Figure 3-2), or combined influent. On all plant sample locations, the “2” stands for Plant 2, or DWRF. "2CINF" is after the raw influent stream is mixed with the plant sidestreams and pumped up into the headworks, through the mechanical screens. Samples from this location showed the influence of the additional ammonia and phosphorus loads from centrate on the secondary system. This location also provided a level of influent carbon and helped calibrate the
Figure 3-2 Diagram of DWRF excerpt from (MWH Global, 2009)
The next location was “2PRI”. This stands for Primary Effluent and was located after the primary clarifiers in the diversion structure where the primary effluent is split between the north and south process trains. This location provided information on wastewater characterization just prior to entering the secondary treatment processes. COD tests in this location showed the actual organic loading to the secondary processes prior to carbon addition.
The location “2EFF” is the plant’s effluent sampling station. The composite sampler in that location collected sample post-SO2 injection and is the plant’s regulatory discharge sample
3.2.3 North Process Train Layout and Sample Locations
The North Process Train as shown in Figure 3.3 was originally built as a traditional activated sludge plant in 1974, converted to BNR in 2012. The green dots show the grab sample locations for the
Figure 3-3 Diagram of DWRF North Process Train
pilot test. These grab samples were taken as the process flow entered the A2O process, leaving the anaerobic zones, and leaving the anoxic zones. Grab samples were also taken from the beer waste tank daily before any deliveries were added and a sample was taken from the delivery
3.3 Water Chemistry Testing
3.3.1 Wet Chemistry Testing Locations
Table 3.1 shows the locations and types of tests conducted during the data collection period of the pilot. When the area operators collected the composite samples, they would pour out a separate 125 ml sample for the pilot study and leave it in the composite refrigerator for pick up by the duty lab operator. The duty lab operator gathered the daily grab samples between 9:30-10:00 a.m. and set them in the lab refrigerator at 4 deg C until their other process duties were completed. The tests included total chemical oxygen demand (tCOD) and soluble chemical oxygen demand (sCOD) along with the orthophosphate (OPO4) and Volatile Acids as acetic acid
equivalents
Table 3-1Water Quality Sample Locations
3.3.2 Process Water Chemistry Analytical Methods
Sample Type Description sCOD tCOD OPO4 NH3-N NO3-N NO2-N Volatile
Acid
2CINF Composite Combined Plant Influent x x
2PRI Composite Primary Effluent x x
2EFF Composite Plant Effluent x x x x
2NEINF Grab Northeast Influent Channel x
2NWINF Grab Northwest Influent Channel x
2NEAN Grab Northeast Anaerobic Zone x
2NWAN Grab Northwest Anaerobic Zone x
2NEAX Grab Northeast Anoxic Zone x x x
2NWAX Grab Northwest Anoxic Zone x x x
Beer Truck Grab Beer Truck discharge line x x
tests were done utilizing a well-mixed sample while the sCOD tests samples were taken after the samples were centrifuged for 3 minutes to settle out the solids instead of the usual 0.4 um filter . The sample is heated for 2 hours with potassium dichromate. Oxidizable organics react, reducing the dichromate to a green chromic ion. The measurement wavelength is 605 nm (HACH
Company, 2014)
Ammonia was analyzed using HACH low range ammonia method 10205 and a HACH DR2800. Since the effluent samples were immediately refrigerated and tested that day, no additional preservation was utilized. The ammonium ions react with hypochlorite and salicylate ions to form indophenol. The amount of color formed is directly proportional to the amount of ammonia nitrogen in the sample. The measurement wavelength is 690 nm (HACH Company, 2014). Nitrate tests were analyzed with HACH Nitrate – Dimethylphenol Method 10206 with a HACH 2800 spectrophotometer. Nitrate ions react with 2,6-dimethylphenol to form
4-nitro-2,6-dimethylphenol. The measurement wavelength is 345 nm. No additional preservation methods other than refrigeration were necessary.
Nitrite levels were measured using HACH Nitrite Method 10207 which is also the USEPA Diazotization Method. Because the samples were analyzed within 48 hours, no additional preservation was needed. The HACH DR 2800 was also used for this test. Nitrite reacts with a primary aromatic amine to form a diazonium salt, which combines with an aromatic compound
Volatile Acids in the beer waste were analyzed with HACH Volatile Acids esterification method 10240 and the DR 2800. The beer waste from both the truck and the tank were sampled within 4 hours so no preservation other than refrigeration was required. The samples were centrifuged for 6 minutes to separate the solids and the supernatant was then analyzed. The volatile acids in the sample react with diols to form fatty acid esters. These are reduced with ferric to form red complexes. The wavelength measured is 497 nm (HACH Company, 2015).
3.3.3 Laboratory Water Quality Methods
The Pollution Control Lab uses either Standard Methods or EPA methods for their analysis of composite samples. The total phosphorus test method was EPA 365.1. NO2 and NO3 tests
utilized EPA method 353.2 by Flow Injection. NH3 was measured using EPA method 350.1.
3.4 Water Quality Instrumentation
3.4.1 Water Quality Probe and Analyzer Locations
In addition to sample analysis in the laboratory, various water quality probes and wet chemistry analyzers existed in the North Process Train and Plant Effluent instrument system. Figure 3-4 shows the location of these instruments in the system. The majority of the pilot concentrates on data from the ORP probes, NITRATAX probes, and the online PHOSPHAX analyzer.
Figure 3-4 Water Quality Instrumentation Locations
The Hach PHOSPHAXTM Phosphate Analyzer provides for continuous sampling of
orthophosphate at 10 minute sampling intervals. The sample is drawn from the post chlorination sample line in DWRF’s sample station and is filtered through a 0.2 um filter before entering the unit. Because of this, particulate phosphorus is not measured, but it gives plant staff an indication of how the enhanced Bio-P process is operating. The unit uses the vanado-molybdate yellow colorimetric method for measurement (Hach Company, 2011). A comparison of the instrument readings of the PHOSPHAX was conducted during the sample period (Figure 3-2) by testing the instrument feed line utilizing the Hach low-range orthophosphorus tests. Readings were taken at different times of day and different effluent flow rates. Almost all of the grab sample readings
Table 3-2 Comparison of Phosphax to Hach Ortho-Phosphorus Tests
The Hach NITRATAXTM sc UV Nitrate Sensor probes are located at the end of the anoxic zones and in the 3rd zone of the aeration basin. These immersion probes are lowered into the process flow and utilize ultraviolet (UV) adsorption technology to measure nitrate concentrations. The unit uses the principle that molecular bonds adsorb UV light to measure nitrate concentrations. A photometer measures the primary beam of UV light while a second beam provides a reference and corrects for turbidity interferences (Hach Company, 2011)
ORP is measured using Hach Differential ORP sensors. Plant staff prefers using this type of immersion probe for pH and ORP because of the durability and ease of maintenance. The ORP probes measure electron activity using platinum and reference electrodes. These probes are located mid-way through the anaerobic zones and at the end of the anoxic zones.
3.5 Statistical Tools
Figure 3-5 - Box Plot Definitions
Another tool used during this study is called a Student’s t-test. This is a statistical hypothesis test used to determine if the differences between two sets of values are statistically significant. The differences in the means of the two sets, taking into account the standard deviations of the values, are used to evaluate whether the differences in the means are true or just by chance. Utilizing the null hypothesis that there is no significant difference between the data sets, the
3.6 Results and Discussion
3.6.1 Drake Water Reclamation Facility Water Quality Results
3.6.1.1 Baseline Data
3.6.1.1.1 Timeframes of Sampling
The duration and timing of the process water quality sampling was determined by the location and tracked consistency of the results. Soluble COD testing in the anaerobic and anoxic zones along with process total and soluble COD tests in the combined influent (2CINF) and primary effluent (2PRI) were conducted from 7/6/2015 – 8/4/2015. Process monitoring of total inorganic nitrogen (TIN) continued an additional month through 9/11/2015 to attempt to obtain consistent results. Daily and weekly nitrogen and phosphorus data from the pollution control lab was monitored continuously through October 10, 2015 in an attempt to identify anomalies that will be discussed in Section 3.6.1.2.1.
3.6.1.1.2 Effluent Diurnal Trends
During the first week of sampling, it was noted that the effluent phosphorus levels exhibited a very steady, distinct diurnal pattern (Figure 4-1). The peaks of this pattern will normally occur
Figure 3-6 DWRF Baseline Flow Data
from midnight to 3 a.m.. The peak highs in effluent phosphorus coincide with low influent flows. As beer waste addition began, this phenomenon remained consistent and a flow profile through the plant did not completely account for the 12 hour lag in peak phosphorus to peak flow (Figure 3-7)
3.6.1.1.3 Plant Baseline Phosphorus Profile
During the baseline week, where all samples were taken, but no beer waste addition occurred, the Pollution Control Lab (PCL) conducted additional phosphorus testing at the combined influent, primary effluent and plant effluent sampling locations. Figure 3-8 shows that approximately 1/3 of the influent phosphorus plus sidestreams is removed in the
Figure 3-8 Baseline Phosphorus Profile (2CINF represents the combined influent, 2PRI is the primary effluent, and 2EFF is plant effluent)
primary clarifiers and (without additional carbon) an additional 1/3 is removed in the BNR process. Effluent phosphorus levels range between 2-3 mg/L.
rate the daily beer waste requirements was 5760 gallons per day which was reaching the maximum delivery volume available (3 x 2000 gallon loads), when it was available. Five times during the study period, dosing had to be turned down to minimum flow because additional beer waste was not available.
Without any notable changes in effluent phosphorus concentration, a step feed approach was conducted for several weeks to attempt applying the carbon dose at the appropriate time during the day to offset the effluent phosphorus peaks. These adjustments in duration, timing and magnitude had little effect on the effluent phosphorus (Figure 3-9). The effluent values
Figure 3-9 Beer Waste Flow vs Effluent PO4 - Typical Pilot Week
3.6.1.2.1 Centrate Influence
Because of the benefits the beer waste addition had on the nitrogen removal processes that will be discussed in Section 4.1.3.2, beer waste addition continued past the initial pilot stage into September and October 2015. A review of effluent phosphate values in the beginning of September 2015 revealed two events that showed effluent phosphate levels below 1 mg/L (Figure 4-4).
Figure 3-10 Centrate Flow vs Effluent PO4 plots
A careful analysis of plant operations during these time periods revealed an extended period of time where centrate was not being pumped to the head of the plant. Centrate is the liquid
are 950 mg/L NH3 and 130 mg/L P. Equalizing the flow addressed the primary concern of plant
staff by minimizing the loss of nitrification due to overloading the secondary system with ammonia during peak flow hours. Over the weekends the centrate is drained back until the centrate storage tank reaches minimum level, then shuts off, normally sometime Sunday morning. Under normal circumstances, the duty centrifuge operator turns the centrate pumps back on at the beginning of the centrifuge cycle, but several new operators have been recently hired and forgot to turn the pumps on until later than normal on Monday.
Plant staff began experimenting with adjusting the flow timing, rate, and duration to see its effect on the effluent phosphorus concentrations. Adjusting the pump start times to begin in the early evening and continue into the early morning hours appears to provide the most benefit.
Substantial improvement was made in the effluent phosphorus concentrations (Figure 3-11).