Electrical Engineering
December 2011
Analysis of packet loss and delay variation on QoE for
H.264 and WebM/VP8 Codecs
Yeshwanth Alahari Buddhiraja Prashant
School of Computing
Blekinge Institute of Technology 37179 Karlskrona
Science in Electrical Engineering. The thesis is equivalent to 20 weeks of full time studies.
Contact Information Author(s):
1.Yeshwanth Alahari
Address: Lgh:1214,Gamla Infartsvagen, 371 40, Karlskrona, Sweden. E-mail: yeshwanth.ece@gmail.com
2. Prashant Buddhiraja
Address: Lgh:1214,Gamla Infartsvagen, 371 40, Karlskrona, Sweden. E-mail: buddhirajaprashant@gmail.com
Supervisor:
Prof. Adrian Popescu
School of Computer Science and Communications (COM), Blekinge Institute of Technology, Sweden
E-mail: apo@bth.se Examiner:
Dr. Patrik Arlos School of Computing,
Blekinge Institute of Technology, Sweden E-mail: patrik.arlos@bth.se
Technical Supervisor: Tahir Nawaz Minhas (P.hd) School of Computing,
Blekinge Institute of Technology, Sweden E-mail: tnm@bth.se
School of Computing
Blekinge Institute of Technology 371 79 Karlskrona Sweden
Internet: www.bth.se/com Phone: +46 455 385000 Sweden
It gives us great pleasure in acknowledging Prof Adrian Popescu for his support and offering us the opportunity to pursue our master thesis under his supervision. We would like to thank Mr Tahir Nawaz Minhas as it would have been next to impossible to complete this thesis without his immense support, encouragement and guidance in the journey of our Master Thesis.
We also owe our deepest gratitude to Dr Patrik Arlos for providing us the ex-perimental test bed and support throughout the thesis.
This thesis is dedicated to our parents who have always encouraged and stood beside us for achieving this dignity.
Yeshwanth Alahari Buddhiraja Prashant
The popularity of multimedia services over Internet has increased in the recent years. These services include Video on Demand (VoD) and mobile TV which are predominantly growing, and the user expectations towards the quality of videos are gradually increasing.
Different video codecs are used for encoding and decoding. Recently Google has introduced the VP8 codec which is an open source compression format. It is introduced to compete with existing popular codec namely H.264/AVC developed by ITU-T Video Coding Expert Group (VCEG), as by 2016 there will be a license fee for H.264.
In this work we compare the performance of H.264/AVC and WebM/VP8 in an emulated environment. NetEm is used as an emulator to introduce delay/de-lay variation and packet loss. We have evaluated the user perception of impaired videos using Mean Opinion Score (MOS) by following the International Telecom-munication Union (ITU) Recommendations Absolute Category Rating (ACR) and analyzed the results using statistical methods.
It was found that both video codecs exhibit similar performance in packet loss, But in case of delay variation H.264 codec shows better results when compared to WebM/VP8. Moreover along with the MOS ratings we also studied the effect of user feelings and online video watching experience impacts on their perception.
Keywords: H.264, WebM/VP8, Quality of Experience, Subjective video quality.
Acknowledgment 3 Abstract i Contents ii List of Figures iv List of Tables v List of Acronyms vi 1 Introduction 1 1.1 Thesis outline . . . 2 2 Background 3 2.1 Video Compression . . . 3 2.2 Video Codec . . . 3 2.2.1 H.264/MPEG-4 . . . 4 2.2.2 WebM/VP8 . . . 5
2.3 Streaming Server and Video Transmission . . . 7
2.4 Network Emulation . . . 7
2.5 Related Work . . . 8
3 Design and Implementation 10 3.1 Aims and Objectives . . . 10
3.2 Research questions . . . 10 3.3 Method . . . 11 3.4 Design . . . 12 3.4.1 Transport Protocol . . . 12 3.4.2 Video Parameters . . . 13 3.4.3 Video Codec . . . 14 3.5 Implementation . . . 15
3.5.1 Experimental Test bed . . . 15
4 Results and Discussion 20
4.1 H.264 and WebM/VP8 . . . 21
4.1.1 Packet Loss . . . 21
4.1.2 Delay Variation . . . 23
4.2 Comparison of H.264 and WebM/VP8 . . . 24
4.2.1 Packet Loss . . . 24
4.2.2 Delay Variation . . . 26
4.3 Comparison of Indian and Swedish user ratings . . . 29
4.3.1 Comparison with respect to Packet Loss . . . 29
4.3.2 Comparison with respect to delay variation . . . 32
4.4 Comparing the average connection speed for India and Sweden . . 35
4.5 User Feelings and Experience of Online videos . . . 36
4.6 Validity threats . . . 37
5 Conclusions and Future Work 39 5.1 Conclusion . . . 39
5.2 Future Scope . . . 40
Bibliography 41 Appendix 45 A Assesment material 45 A.1 Set of Videos for subjective assessment in case of Delay variation 45 A.2 Set of Videos for subjective assessment in case of Packet loss . . . 45
A.3 Questionnaire used for the Assessment . . . 45
2.1 Sampling and Temporal samplings in the video sequence . . . 4
3.1 Experiment setup . . . 15
4.1 MOS based on the Packet loss for H.264 . . . 22
4.2 MOS based on the Packet loss for WebM/VP8. . . 22
4.3 MOS ratings for delay variation of H.264 . . . 23
4.4 MOS ratings of delay variation for WebM/VP8 . . . 24
4.5 95 % Confidence interval for Packet loss . . . 25
4.6 Standard deviation for Packet loss . . . 26
4.7 Confidence interval for delay variation . . . 27
4.8 Standard deviation for delay variation . . . 28
4.9 MOS rating for Sweden users in H.264 packet loss . . . 29
4.10 MOS rating for Indian users in H.264 packet loss. . . 30
4.11 MOS rating for Sweden users in WebM packet loss . . . 31
4.12 MOS rating for Indian users in WebM packet loss . . . 31
4.13 MOS rating for Sweden users in H.264 delay variation . . . 32
4.14 MOS rating for Indian users in H.264 delay variation . . . 32
4.15 MOS rating for Sweden users in WebM delay variation . . . 33
4.16 MOS rating for Indian users in WebM delay variation . . . 34
4.17 comparing the average connection speed for India and Sweden. . . 35
4.18 MOS ratings based on the feelings of the user . . . 36
4.19 MOS ratings based on the experience of the user with the videos . 37 A.1 Sheet 1 of Questionnaire. . . 48
A.2 Sheet 2 of Questionnaire. . . 49
A.3 Sheet 3 of Questionnaire. . . 50
A.4 Sheet 4 of Questionnaire. . . 51
3.1 Nine point Numerical Quality Scale . . . 12
3.2 Description of video content for the test sequences used in the sub-jective test . . . 13
3.3 Video Parameters for H.264. . . 14
3.4 Video Parameters for WebM. . . 14
4.1 Mos Ratings For Varied Packet Loss. . . 24
4.2 Mos Ratings For Varied Delay Variation. . . 27
A.1 Set of videos for subjective assessment in case of varied delay values. 46 A.2 Set of videos for subjective assessment in case of packet loss values.. 47
AAC Advanced Audio Coding ACR Absolute Category Rating AVC Advanced Video Codec CIF Common Intermediate Format CPU Central Processing Unit
DAG Digital Acquisition and Generation DCR Degradation Category Rating DCT Discrete Cosine Transform DDR3 Double Data Rate
DPMI Distributed Passive Measurement Infrastructure DVB Digital Video Broadcasting
FIFO First In First Out FPS Frames Per Second GOP Group of Pictures
HDTV High Definition TeleVision HTML HyperText Markup Language HTTP Hyper Text Transport Protocol IETF Internet Engineering Task Force IP Internet Protocol
IPTV Internet Protocol TeleVision
ITU-R International Telecommunication Unit, Radio communications Sector vi
KBPS Kilo Bit Per Second
MArC Measurement Area Controller MOS Mean Opinion Score
MP Measurement Point
MPEG Moving Pictures Expert Group MP3 MPEG-1 Audio Layer 3
MP4 MPEG-1 Audio Layer 4 MTU Maximum Transfer Unit NTP Network Time Protocol PC Pair comparison Method
PEVQ Perpetual Evaluation Video Quality PSNR Peak Signal-to-Noise Ratio
QCIF Quarter Common Intermediate Format QoE Quality of Experience
QoS Quality of Service
RAM Random Access Memory ROI Return of Investment
SDRAM Synchronous Dynamic Random Access Memory SI Spatial Information
SS Single Stimulus
TCP Transport Control Protocol TI Temporal Information TS Traffic Shaper
UDP User Datagram Protocol VLC VideoLAN Client VoD Video on Demand
WMV Windows Media Video WMA Windows Media Audio
Introduction
Multimedia streaming applications have increasing popularity and became one of the dominating services in today’s internet [1]; some of the multimedia applica-tions are Video-on-Demand(VoD), archived video news and non-interactive dis-tance learning [2]. There are even claims that in 2013, almost 64% of the world mobile data traffic will be videos [3]. Since, a VoD service has great potential to capture a significant fraction of the traditional 25 billion dollars annual rental market in the near future [4]. There is a strong belief among telecommunication companies that VoD services market will expand exponentially in the next few years [5]. This rapid growth in market of multimedia video applications, increases user expectation to incur improved video quality.
To stream a video over a network, compression mechanisms are used because the raw or uncompressed video consumes more bandwidth and resources. To com-press raw videos several video encoding standards are used. H.263 [6] [7] and H.264/AVC (Advanced Video Coding) [6] are mostly used for multimedia appli-cations on the Internet. One of the most widely used codec for Web appliappli-cations is H.264/AVC and recently on May 2010 Google launched its codec naming the project as ”WeBM” [8] especially for Web applications.
H.264 codec provides better coding efficiency for wide range of video con-sumer applications. It has become a promising standard for several video concon-sumer applications namely television broadcasting, streaming multimedia and video con-ferencing. Different products like blu-ray, Digital Video Broadcasting (DVB), iTunes and You Tube are using the H.264 standard.
The WebM project has attracted attention of researchers by launching Web-M/VP8 codec. It is an open source video codec and Google is trying to insert this codec in all its applications in the near future. The main motivation of releasing WebM/VP8 codec by Google was to avoid license fees for H.264 based Google’s products, such as the Chrome browser or youTube. There are even claims that WebM/VP8 codec would offer twice the video quality utilizing half of the network bandwidth compared to H.264 [9] for web applications. Lot of research were ad-dressed for H.264/AVC compared to VP8. So we have evaluated the performance
of both the codecs H.264/AVC and WebM/VP8 based on user perception.
To perform this experimentation, we use the emulated network environment. For emulation we choose NetEm[10] to create the desired conditions for the test like effect of packet loss and delay variation. To stream the video, Flumotion streaming server was used on the server side and VLC player at the client side. Furthermore, we have used Transport Control Protocol (TCP) as the transport pro-tocol as it is used in many popular video distribution sites such as YouTube, Vimeo and MetaCafe use Hyper Text Transfer Protocol (HTTP) over TCP to stream video to clients [11].
In our thesis we investigate the users perception on the impact of packet loss and delay/delay variation on video quality of experience in the context of two codecs H.264 and WebM/VP8 for three different featured video sequences. Apart from the mentioned scenarios we have extended by considering the user perception based on country of residence and past experience on the video.
In order to achieve the objectives, an experimental test bed was set-up and the videos were transmitted, network emulator is utilized to emulate the network char-acteristics. The assessment of video were based on subjective assessments and were realised from the International Telecommunication Union (ITU) recommen-dations [12] [13]. Finally, the results are calculated and presented by conventional statistical methods using the Means Opinion Score (MOS).
1.1
Thesis outline
The rest of the document is as follows. Chapter 2 provides a brief description of concepts with background and related work, chapter 3 addresses the presentation of the objectives, methodology, design and implementation. Chapter 4 discusses about the results from assessments sessions and validity threats. Finally, Chapter 5 comprises the conclusion and future work.
Background
This chapter discusses about the key concepts and related research work .
2.1
Video Compression
Compression algorithms rely on the fact that a video signal contains considerable redundancy [14]. The signal can be compressed to occupy as little as 64kbps, but the quality falls even for videoconferences. So for reasonable quality at least 384kbps or six channels [14] are needed. There are many video compression stan-dards that have been developed by both public and proprietary. Video compression has two main benefits. First, it makes possible to use digital video in transmission and storage environment that might not support uncompressed video. Secondly, compressed video is more efficient to use for transmission and storage resources at the fullest.
2.2
Video Codec
A video codec converts the analog video signal to digital and compresses it before transmission. If the video sequence is decoded and if it is found to be identical to the ordinal video sequence then the coding process is known as lossless, else it is known as lossy.
The digital video scene uses two main redundancies to achieve compression: temporal and spatial sampling (Figure 2.1) [15]. Spatially sampling involves a rectangular grid in the video image plane. Where temporal sampling defines a moving video image captured by taking rectangular snapshot of the signal at peri-odic time intervals. The rectangular snapshots are called Frames and playing back these series of frames produces a motion appearance. A higher temporal sampling rate (frame rate) gives apparently smoother motion in the video scene but requires more samples to be captured and stored.
The resolution suggested by ITU-T [12] for television pictures are Common Intermediate Format (CIF) [14] which offers 288 lines by 352 pixels which is
proximately half of commercial television resolution i.e. 525 lines by 480 pixel. The other resolution suggested for mobile devices is Quarter Common Intermedi-ate Format (QCIF) [14] which is 144 lines by 176 pixels.
Figure 2.1: Sampling and Temporal samplings in the video sequence [15]
2.2.1 H.264/MPEG-4
The digital video application uses several video standards for encoding and de-coding of video sequence according to the need of application. As MPEG-1 and MPEG-2 are used for multimedia applications, where as H.263 [6] [7] and H.264 [16] are used for video-conferencing applications. In the video coding standard a video sequence is partitioned into Group of Pictures (GOP) i.e. GOP # 1, GOP # 2 and GOP # N, This GOP is further sub divided into Intraframes (I-frames), Forward Predictive frame (P-frames) and Bidirectional frames (B-frames).
H.264 codec has different profiles depending on the end application for encod-ing and decodencod-ing of video. These profiles specify the requirements for the equip-ment that will encode and decode the video. The most extended profiles are the baseline profile and main profile. Baseline profile includes support for I-P frames and limited capability devices, whereas main profile uses I-P-B frames for video
storage and transmission. These profiles can be encoded and decoded depending upon the device capability and complexity of the algorithm.
The H.264 standard has following properties namely data formatting, framing and de-multiplexing. it uses multiple control units using digital channels and also provides multipoint hand shake for communication between the codec and a mul-tipoint control unit. H.264 can be coded to low bit rate communication for control and indication of signals.
2.2.2 WebM/VP8
Google sponsored the development of new open media project “WebM”. Its main aim is to provide high-quality and open video compression format for the use with HTML5 video for web applications. It was originally developed by the On2 Tech-nologies, Inc [17] as a successor to the VPx family of video codec. As Google announced the WebM project, VP8 gained lot of attention and support from a large list of media application developers along with the research community from both industry and academically.
Compared to other video coding formats, VP8 has many technical distinctive features that support high compression at low computational complexity for de-coding a video sequence. The main aim of WebM project is to focus on Internet/ web-based applications which led the WebM project to think about the design as-sumptions and highlighted features [18]. The list of highlighted features and design assumptions are stated below:
Low bandwidth requirement
VP8 was specifically designed to operate mainly in a quality range from “watchable video” to “visually lossless” in order to limit the available network bandwidth. Web video format
VP8 was designed to handle the image format of 420 color sampling, 8 bit per channel color depth, progressive scan (not interlaced), and image dimensions up to a maximum of 16383x16383 pixels. These are used by majority of Web video. The push for compression efficiency and decoder simplicity under these design assumptions led to a number of distinctive technical features in VP8 [18], relative to other known video compression formats, such as MPEG-2, H.263 and H.264/AVC. Reference Frames
VP8 is designed to use three types of reference frames prediction namely “last frame”, “golden frame” and “alternate reference frame”. This structure of refer-ence frames consumes very small memory footprint for both encoding and decod-ing. Golden frame can be used in many ways by the VP8 encoder for the improve-ment of coding efficiency and error recovery mechanism in real-time video
con-ference, which might be a multi-party video conference. The Alternative reference frame is used to remove the noise-reduced prediction [18] and helps in improving the prediction without B-frames [18].
Efficient intra prediction and inter prediction
VP8 makes extensive uses of intra and inter prediction frames. Its intra prediction features has a new “T M PRED” mode and inter prediction has a feature of flexi-ble “SPLIT MV ” mode capaflexi-ble of coding arbitrary block patterns within a macro block.
Flexible reference frames
VP8 uses three reference frames for inter prediction, but the scheme is somewhat different from the multiple reference motion compensation scheme seen in other formats. VP8 design limits the buffer size requirement to three reference frame buffers and still achieves effective de-correlation in motion compensation.
High performance sub-pixel interpolation
VP8 motion compensation uses quarter-pixel accurate motion vectors for luma pix-els and up to one-eighth pixel accurate motion vectors for chroma pixpix-els. The sub-pixel interpolation of VP8 features a single stage interpolation process and a set of high performance six-tap interpolation filters.
Hybrid transform with adaptive quantization
VP8 uses 4x4 block-based discrete cosine transform (DCT) for all luma and chroma residual signal. Depending on the prediction mode, the DC coefficients from a 16x16 macro block may then undergo a 4x4 Walsh-Hadamard transform.
Frame level adaptive entropy coding
VP8 uses binary arithmetic coding extensively for almost all data values except a few header bits. Entropy contexts are adaptive at the frame level, striking a balance between compression efficiency and computational complexity.
Parallel processing friendly data partitioning
VP8 can pack entropy coded transform coefficients into multiple partitions, to fa-cilitate parallel processing in decoders. This design improves decoder performance on multi-core processors, with close to zero impact to compression efficiency and no impact to decoding performance on single core processors.
Google open-sourced the formerly closed-sourced video codec along with the introduction of VP8 in order to increase the adoption possibilities of VP8 and make
the codec wide spread. Claims were made that VP8 can provide twice the video quality using half the network bandwidth compared to the other codecs [9].
2.3
Streaming Server and Video Transmission
Streaming server is used for the play back of digital video sequence. There are many streaming servers namely Video LAN Client (VLC) streaming server [19], Darwin Streaming Server [20] and FFserver [21], but none of these servers streamed the WebM codec. In [22] WebM was found to be streamed by the Flumotion server by using the HTTP in the application layer and TCP in the transport layer. A video distribution site, such as You-Tube, Video and Met cafe also uses HTTP over TCP to stream video clips to clients. Moreover, B. Wang stated [23] that using TCP for streaming video provides good performance when the available network bandwidth is about twice the maximum video rate, with a few seconds pre-roll delay.
2.4
Network Emulation
The method of emulation can be accomplished by introducing a device like com-puter that alters the packet loss in a way that imitates the behavior of traffic in an reproducible laboratory network environment. Traffic shaping is used in emulation to analyze the impact of packet loss and delay variance to emulate different net-work conditions. There are different types of traffic shapers; namely Dummy net, NIST Net, Tun tap, NetEm. Dummy net and NIST Net are the two similar designs as Netem and they does its own filtering and queuing. Dummy net[24] support traffic shaping, it acts as a bandwidth manager and delay emulator. As NIST-net is a public domain, many of these functions are re-used in Network emulator (Net Em) [25]. TUNTAP is a device used for emulating network delay and it allows testing network behavior without any delay changes but the performance is limited because of extra data copies and context switches.
NetEm is the recent enhancement of traffic control facilities that allow adding delay, packet loss. It is built in Linux Kernel environment by using the existing Quality of service and Diffserv facilities[25].
In our thesis, NetEm is used as a shaper which is installed on Intel hardware platforms with Linux kernel version: 2.6.23.9. The main motto of the NetEm is to provide a way to reproduce a long distance network in laboratory environment. NetEm basically comprises of two modules namely a small kernel module, com-mand line utility. The kernel module is for Queuing discipline and the comcom-mand line utility is for configuring [25].
2.5
Related Work
Studies of previous works have addressed in the field of codecs and perceptual video quality. In [26] Calyam et al. made a comparative study of subjective and objective video quality assessment for the codec H.323. He determined that delay, jitter and loss are the performance bounds for network metrics and also found that the jitter affects the video sequence when compared to loss and delay. Hyun Jong kim et al. [27] followed subjective assessment method and explained how the net-work delay, jitter and packet loss affect the deployment of IPTV services. Hands and Wilkins [28] analyzed the video quality by changing the packet loss and buffer size using the MPEG-1 codec.
Many works have been done related to H.264. [27] shows the performance evaluation of the MPEG-4 video quality in the presence of packet loss. Their anal-ysis show that this leads to a significant degradation in the video quality because of the single packet loss in the I-frame. Each I frame, P frame and B frame have their own characteristics which depend on a good prediction and delay constraints. Jus-miko et al. [9] compared different codes like H.263, H.264 and XviD for mobile devices by subjective analysis. Choi.L.U et al. [29] shows an analytical model for the distortion due to packet loss on wireless networks. Group of Pictures (GOP) structure of H.264 and MPEG-2 has been studied and a model for packet prioriti-zation had been proposed in [30]. Selim Ickin et al. [31], has implemented three adaptive streaming solutions for distribution of 3-D media which helps in stream-ing of holographic 3-D video over IP. Another study says that most widely used codec in wireless video transmission system is H.264 [32].
WebM is a multimedia container format designed to provide a high quality open video compression as HTML-5 video. WebM is an open source and it is sponsored by Google which is drawing attention of research community. In [18] Jim Bankoski et al. stated the technical overview of the Webm/VP8 compression format, with its unique features like architecture, design, reference frame type and quantization scheme. Patrick Seeling et al.[9] worked on comparing the PSNR val-ues of H.264 and WebM/VP8 and their results show that H.264 outperforms VP8 in terms of rate distortion performance by 1-4dB for a given bit rate.
As explained in the previous section best compression mechanism is impor-tant for the better video quality. The compression involves the coding efficiency and the propagation of errors when a key frame is affected by minimizing the dis-tortion. H.264 gives a wide range of encoding parameters knows as profiles. In [33] Michal Ries and Olivia Nemethova used the baseline profile for the quality estimation based on motion characteristics. Since, no subjective assessment has been made on the WebM/VP8 codec. In our study we used the parameters that are common for comparing H.264 and WebM/VP8, because they are designed for Internet applications. Baseline profile characteristics are same as WebM/VP8. So,
a study was conducted for WebM/VP8 and H.264(baseline profile) with the packet loss and delay variation.
Additionally, studies are carried out for the video quality perception for internet applications like Internet access, video conferencing, entertainment and streaming video [34]. Moreover, empirical studies were addressed for the video quality with respect to QoE and QoS to develop a correlation between them [31].
People based on their residing country have different perception of quality for different encoding techniques. H.264 and WebM/VP8 are used to encode and de-code the same video sequence. The encoding is based on FFmpeg because of its performance and ability to handle most of the WebM/VP8 and H.264 coding profiles. As it is open source it can be appropriately modified according to our requirements. The image resolution, brightness, aspect ratio and contrast are fixed for both the codecs. The user perception changes according to the size of the video. So, Common Intermediate Format (CIF) resolution is taken into consideration be-cause it is supported by all computer and laptops including todays smart phones.
Consequently, a study for the user perception that test the video quality for the video encoded by two Codecs H.264 and WebM/VP8 with different network pa-rameters packet loss and delay variation is done. Further, the role of country of residence, user experience and feelings of the users in user perception was ana-lyzed.
Design and Implementation
This chapter discusses in detail about aim, objectives and research questions. Fur-thermore this section explains the Design and Implementation.
3.1
Aims and Objectives
This thesis aims to study QoE parameters (i.e. impact of packet loss, delay/de-lay variance) on H.264 and WebM/VP8 codecs and it is further sub-divided into following objectives:
• To understand and collect information on H.264 and WebM/VP8 codecs. • To understand the user perceptions of video quality with packet loss and
delay/delay variation for H.264 and WebM/VP8 codecs.
• To understand if users have different perception of video quality for the con-tent of video and their experience for video quality.
• To analyze video quality with respect to user perception.
3.2
Research questions
The main research of this thesis is
RQ1. How will the user percieve video quality with packet loss and delay/delay variatiation for the videos encoded with H.264 and WebM/VP8 codecs? The research question is further sub divided into three sub-questions R 1 What will be the impact of packet loss and delay/delay variance on
video quality of experience for H.264?
R 2 What will be the impact of packet loss and delay/delay variance on video quality of experience for Webm/VP8?
R 3 Do the users have different expectations for video quality? a. with reference to experience of online videos.
b. with reference to user feelings.
RQ2. How will the user perceive video quality with packet loss and delay variation for the video encoded with H.264 and WebM/VP8?
a. Sweden? b. India?
3.3
Method
This Section describes the methods selected to answer our proposed research ques-tions with a comparison to other alternatives.
Video quality assessment can be done under two ways namely objective and subjective assessment methods. The objective method does not involve the human grading and uses mathematical algorithms. Video Quality Expert Group (VQEG) [11] have discussed different methods for the objective method assessment, which forms the validation and standard objective assessment of video quality. The meth-ods used in objective assessment are Peak Signal Noise Ratio (PSNR) [35] and Mean Squared Error (MSE). These methods generate an error signal ratio with respect to original video and the video which is distorted or compressed. These objective metrics do not provide the end user satisfaction level.
On the contrary subjective video quality assessment involves the human per-ception to describe the quality of videos [26] [7]. In subjective assessment hu-man perception plays an important role involving the viewing conditions, huhu-man psychology, video quality experience and surrounding (like lighting conditions) [36]. ITU-T Recommendation P.910 [12] describes different subjective assessment methods namely Absolute category Rating (ACR) and Degradation Category Rat-ing (DCR). In ACR method the user had to watch video sequences and rate them independently with in 10sec. DCR involves the pair of video sequences where user had to rate the video sequence with reference to first video sequence, which is also known as Pair Comparison method (PC).
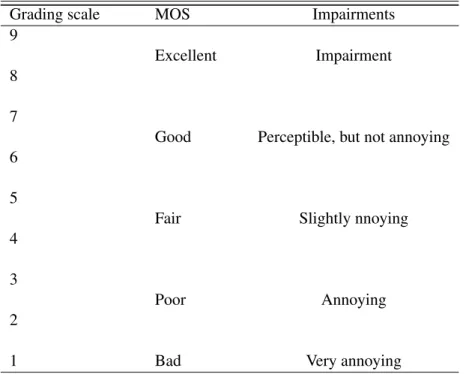
To assess the video quality, MOS is taken as a subjective assessment. The group of subjects are selected to rate the video sequence by MOS metric according to the scale, which represents the quality of video and mapped them into numbers. To rate the low bit rate, videos user perception is mapped on a 9 level quality scale as shown in Table 3.1.
Subjective assessment also involves Perceptual Evaluation Video Quality (PEVQ) [37] recommended by ITU and Video Quality Expert Group (VQEG). It provides
Table 3.1: Nine point Numerical Quality Scale
Grading scale MOS Impairments
9
Excellent Impairment
8 7
Good Perceptible, but not annoying
6 5
Fair Slightly nnoying
4 3
Poor Annoying
2
1 Bad Very annoying
the objective analysis and correlation with the subjective analysis on MOS. PEVQ consumes less time, but the limitation of control on software license and its behav-ior to control the display devices made us to discard it for future work.
In this research work we have selected the ACR methodology for the subjec-tive assessment as we want to measure the video quality with different distortions and expectations with two codecs H.264 and WebM/VP8. Comparison method involves long sessions and makes subjects tedious because of several video se-quences. ACR method is also recommended in several studies and qualification tests [38] [12].
3.4
Design
The parameters which are taken into consideration for the experimentation are:
3.4.1 Transport Protocol
To stream a video between the server and client, transport protocol is used. Me-dia streaming services mainly use transport protocols like TCP and User Datagram Protocol(UDP). TCP is found to be the most used transport protocol for stream-ing stored media over internet. Because of its built-in congestion control, reliable transmission, and firewall friendliness it is found reliable in packet delivery [11].
Popular video distribution sites like YouTube, meta cafe use HTTP over TCP to stream video to clients. More over it is found that when the available network bandwidth is twice the video rate, the TCP performance is found to be good in the case of streaming video [39]. Streaming servers such as windows media server and Flumotion use TCP as their transport protocol [11] [2]. Also, WebM/VP8 codec is specially designed for web applications. These applications mainly use the TCP protocol as their transport agent. Due, to this reason we use TCP as a transport protocol, IP (Internet Protocol) at the network-layer and HTTP at the application layer. The packet size at the data link layer is remained unchanged in our whole experimentation by considering the Maximum Transfer Unit (MTU) of 1500 bytes for Ethernet.
3.4.2 Video Parameters
In this section we discuss about the video parameters which are considered in our experimentation.
Video Sequences selection
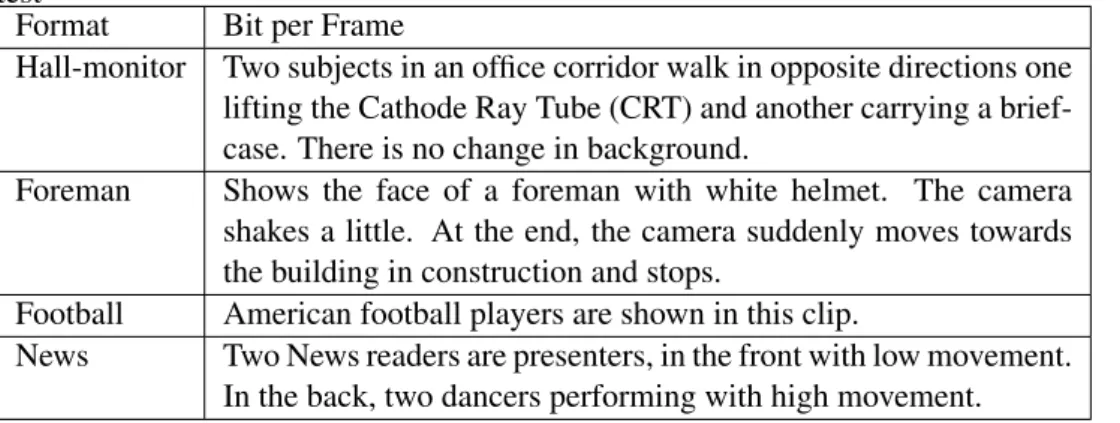
We have chosen four video sequences for the experimentation. The video se-quences are having different motion activities; these sese-quences are having different level of Spatial Information (SI) and Temporal Information (TI) [12]. The videos are taken from a commonly used repository for video quality assessment studies [40] suggested by Simon Et al.[41]. Selected videos description is shown in the Table 3.2.
Table 3.2: Description of video content for the test sequences used in the subjective test
Format Bit per Frame
Hall-monitor Two subjects in an office corridor walk in opposite directions one
lifting the Cathode Ray Tube (CRT) and another carrying a brief-case. There is no change in background.
Foreman Shows the face of a foreman with white helmet. The camera
shakes a little. At the end, the camera suddenly moves towards the building in construction and stops.
Football American football players are shown in this clip.
News Two News readers are presenters, in the front with low movement.
In the back, two dancers performing with high movement. The length of the each video sequence is of 10sec described by ITU-T [12] because longer video sequences might be tedious for the participants and shorter sequences ( ≤ 5 seconds) do not allow sufficient time to the subjects for marking the correct evaluation.
In [12] the ITU-T suggested resolution parameters which are used for studying the video. The ITU-T documentation P.910 [12] was written 11 years ago in 1990 during that time mobile phones are not having much computational skills and their processing speed is also very low. At that time QCIF resolution [14] [33] was used. But, as CIF resolution is supported by smart phones, we have chosen CIF (352x288) [14].
3.4.3 Video Codec
H.264 is mainly used for web applications but later on Google is trying to replace H.264 with WebM/VP8 codec. As the studies show that WebM can achieve com-pression efficiently and is competitive to the H.264. [18].
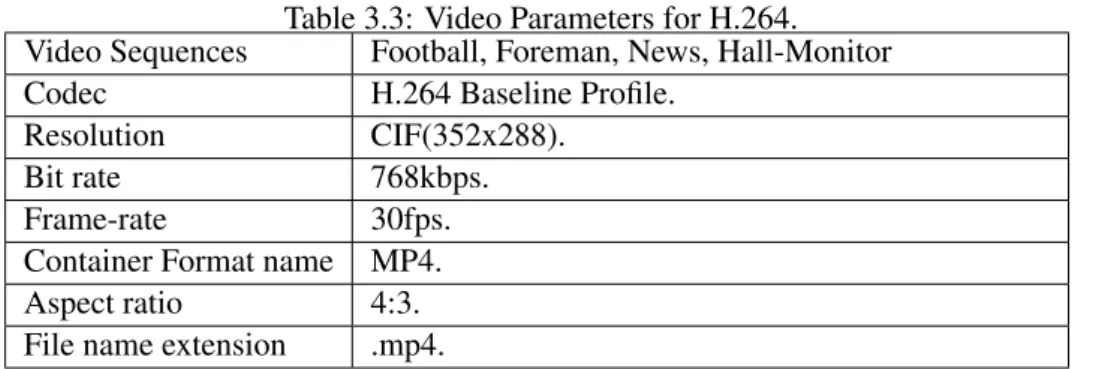
To decode the CIF into H.264 and VP8 codec, we have used latest FFmpeg [18] decoder software (version SVN-r264000) with libavcodec (version 52.108.0) for the both the codec that is x264 and Vpx. In Table 3.3and Table 3.4 shows the video characteristics for H.264 and WebM encoded video sequence respectively.
Table 3.3: Video Parameters for H.264.
Video Sequences Football, Foreman, News, Hall-Monitor
Codec H.264 Baseline Profile.
Resolution CIF(352x288).
Bit rate 768kbps.
Frame-rate 30fps.
Container Format name MP4.
Aspect ratio 4:3.
File name extension .mp4.
Table 3.4: Video Parameters for WebM.
Video Sequences Football, Foreman, News, Hall-Monitor
Codec WebM.
Resolution CIF(352x288).
Bit rate 768kbps.
Frame-rate 30fps.
Container Format name WebM.
Aspect ratio 4:3.
File name extension .webm.
The above parameters are kept constant during the whole experimentation in a control environment, these parameters and added disturbances of videos are streamed to give the final video sequence. We have treated the News video as a dummy video sequence and used it for training session.
3.5
Implementation
This section presents the description of experiment set up along with short descrip-tion of test bed, media player configuradescrip-tion and the commands used in the network emulator configuration.
3.5.1 Experimental Test bed
This Experimental test bed describes about the test network built to perform the experiment. Figure 3.1 clearly shows the detailed structure of experimental setup. The test bed is basically based on Distributed Passive Measurement Infrastructure (DPMI) for measurements. Streaming server, client, measuring point, Network emulator and a consumer for storing the capturing files are used in the setup.
Figure 3.1: Experiment setup Server (Flumotion streaming server)
Flumotion is a server for streaming open- source under the General Public License (GPL). It allows content delivery to the devices like browsers, players, media cen-ters, mobile devices and game stations. It supports and includes all necessary audio and video codecs like H.264, WMV, Theora, VP8, AAC, WMA and vorbis. The technology used in the Flumotion streaming server provides delivery quality, per-formance and stability. The formats supported for on demand streaming are WebM, MP3, MP4, MOV, ogg, 3gpp etc.
A Flumotion system consists of several processes working together, with the worker creating process for the components, and the manager telling the worker
what to do. The Flumotion user interface connects to the manger which in turns controls the workers and tells it when to start and stop a system. So in order to maintain the connection between the manager and the worker, xml files needs to be placed in the Flumotion directory[42].
In our thesis the Flumotion 0.8.1[?] streaming server was used, which support on demand streaming for the codecs like H.264 and Google codec. The server was a laptop Dell Studio 1557 with the Intel Core i7 CPU Q720 @ 1.60GHz 1.60Hz, 4096 mb DDR3 SDRAM, running on a Ubuntu 10.10 with LTS Linux kernel ver-sion 2.6.35.4. In order to perform the streaming the plug-in of Gstreamer were installed and to make the H.264 Codec stream over a network using Flumotion, the Flumotion-ugly plug-in was installed.
Client (VLC player)
VLC player is a free open source multimedia frame work and media player from Video Lan project [19]. It acts as an encoder, multimedia player and streamer that support latest audio, video codecs and file formats as well as various streaming protocols. The VLC player is popular for its ability to play the unfinished, damaged videos and also the incomplete videos before the files are downloaded.
In our thesis, VLC player 1.1.8 is used as a client for receiving the data from the streaming server. The Client was laptop Dell Studio 1555 with Intel Core 2 Duo P8700 @ 2.53 GHz 2.53 GHz with 4096mb of DDR3 SDRAM running on Ubuntu 10.10 with LTS Linux Kernel 2.6.35.4. The streamed packets are received from the Server and are stored using VLC player.
NetEm(Traffic Shaper)
Netem is a network emulator in the linux kernel 2.6.7 that reproduces network dy-namics by delaying, dropping and corrupting packets. It behaves as a basic First in First Out (FIFO) Queue without any packet loss, delay and duplication of packets. As we perform our experimentation on Delay, packet loss. We exclude the expla-nation of other parameters.
A. Packet loss
In our thesis the packet loss values of 0 %, 2.5 %, 5 %, 10 %, 15 %, and 20 % are taken into consideration. 1 % of packet values state that for every 100 packets sent there will be a drop of one packet. In our thesis the NetEm commands for the effect of packet loss values applied on the video are stated below.
#tc qdisc add dev eth2 root netem delay X %. #tc qdisc change dev eth2 root netem delay X %
B. Delay/ delay variation
The delay and delay variation values are expressed as D ± ∆D, where D is the fixed delay and ∆D is the variable delay. According to G.114 [43], the ITU-T recommendations suggest that 0 to 150 ms limits can be used for one-way trans-mission time for connection with echo adequately controlled. So the delay values chosen in the experiment was 150 ms and the variable delays chosen in the exper-iment were shown to be {0, 50, 90, 110, 130&150}. This meant to say that when there is a delay and delay variation of 150 ± 50, the delay values are between 100 and 200.
The NetEm commands for the delay environment in the command line would be:
#tc qdisc add dev eth2 root netem delay X.ms
#tc qdisc change dev eth2 root netem delay X ms Y ms Here X stands for fixed delay and Y stands for variable Delay. Measuring Point
The Measuring Point (MP) is based on Linux environment dedicated for capturing the packets on a network using Data Acquisition and generation (DAG) cards. An MP can be a physical device that can tap one or more links and each link is tapped via wiretap. The MP is equipped with two DAG cards namely DAG 3.5 G [10].The Measurement area controller (Marc) is used for controlling the measuring point and transfers the captured data to the consumer.
Consumer
The consumer is based on Linux environment used for storing the captured packets from the measuring point (MP). The packets are saved as ”.cap” file format. These captured files are not analysed in our thesis but can be used for further analysis.
3.5.2 Experiment Setup
A network is established to perform the experiments; the Figure 3.1 shows the simple set up diagram. The streaming server namely Flumotion is used to send the encoded videos using HTTP/TCP connection to the client. A full duplex link of bandwidth 100mbps is used. The streamed data is sent through the Traffic Shaper (TS) which is placed between the streaming server and client. Traffic shaper is equipped with NetEm software which introduces the packet loss and delay/delay variation between server and client. The whole network is attached to the DPMI [44]. Traffic traversing from server to shaper and shaper to client is wiretapped two times using Measurement point. The measurement point is having two DAG3.5E
cards [45]. Further the information is sent, which are wiretapped for capturing the packets from server to Traffic Shaper and Traffic Shaper to client.
The IP address for the server is set to 192:168:0:2 and for the client it is set to 192:168:0:3 with net mask of 255:255:255:0. The port used was 8080. Then experiment set up was tested before the starting the experimentation by checking the connectivity between the server, measuring point, consumer, traffic shaper and the client using PING. Then the disturbances are provided in the traffic shaper using NetEm by providing packet loss values and are checked whether the captured data packets are of same disturbances similarly tests are repeated in the case of delay variation.
The videos that are collected from the client (i.e. VLC player) are of different sequences namely football, foreman, hall monitor and news for each experimental values of packet loss and delay variation. For each video sequence three sample videos were executed for different packet loss and delay variation to use in human perception assessment. So we had a pool of videos with random packet loss and de-lay variation. The collected videos used for the survey were shuffled and renamed (as shown in Appendix A) in order to make the user unaware of the disturbances watched on the videos.
3.5.3 Assessment Methodology
The survey was conducted at 2 separate countries. The first part of survey was conducted at Blekinge Institute of Technology, Sweden in a control environment according to ITU-T recommendations[12]. During this experiment the total of 27 users from different continents like Asia, Africa and Europe were participated. The Second part of this survey was conducted at India under a controlled experimental environment according to ITU-T recommendations. According to ITU-T [12] the analysis was performed with minimum of 15 Indian users.
To incur the MOS, we worked with 42 test subjects with different professions. The test subjects were chosen with different age groups (between 18 and 63), and we extended our scope by taking different background, nationalities and gender. The test subjects were computer literate and are very well-educated.
Consistent tests were conducted according to the ITU- recommendations [12], using the Single Stimulus (SS) method. Original content was not shown to sub-jects as a sequence of reference, which results in high variance. During the test session the total of 78 videos were shown to 42 test subjects, which include H.264, VP8/WebM videos with respect to packet loss and delay. Specially, video samples were presented at a viewing distance of 1-8H (where H is the native height of the picture), one at a time and are rated on a nine point scale ranging low to high con-sidering the quality of videos. The videos were rated on this scale as the videos used for the experiment were low bit rate videos. The 1-9 scale was assessed as
shown in table.
The assessment time for the interview lasted for 25 minutes and the session took place in three sessions: training, questionnaire and main session. The general information of the users was collected (age, sex, country of residence, feeling, and experience on videos). The assessment time for each video sequence assessment ranged from 8 to 10 seconds with a break time of 2 to 5 seconds for each video shown.
To the original quality of the video, the users who rated below 3 on the scale were removed from the analysis because of rating the videos randomly without following the instructions and treating them as dummy users.
Results and Discussion
In this chapter, we will examine the results based on the experimental setup de-scribed in the previous chapter. We will canvass the perceptual quality of the video with the effect of packet loss and delay. Two conventional statistical methods like mean and variance were obtained from the raw data and the computation of these parameters in each data case were analysed.
The mean, standard deviation and confidence interval were calculated based on the recommendations BT500 for subjective assessment of the quality of television pictures, of the International Telecommunications Union- Radio communications Sector (ITU-R)[13] .The data collected through user feedback were calculated for the respective video sequences (Football, Foreman, Hall Monitor) for H.264, Web-M/VP8.
The mean is defined as:
¯ Xjk= 1 N N
∑
i=1 Xi jk,The standard deviation is stated as:
δjk= s N
∑
i=1 (Xjk− Xi jk)2 N− 1Where, N is number of observers, Xijk is the score of the i th observer for test condition j and for video sequence k.
When the requirements as in [13] are met for the distribution of individual scores, then 95 % confidence interval value is greater than the absolute value ob-tained by differentiating experimental mean score and true mean score.
The 95 % confidence interval is stated as
[ ¯Xjk− δjk, ¯Xjk+ δjk] (4.1) where δjk= 1.96 ∗ Qjk √ N (4.2)
As discussed earlier, different video sequences have same temporal character-istics as the properties effect the encoded video for both the codecs i.e. H.264 and WebM/VP8 for their respective GOP structures.
4.1
H.264 and WebM/VP8
4.1.1 Packet Loss
Figure 4.1 illustrates the MOS rating of the H.264 video sequences with different packet loss values. The X-axis shows the different packet loss values and Y-axis represents the average user ratings. The graph shows the MOS ratings lies between 6.804 to 7.292 which tends between ”good” and ”excellent” for the videos without packet loss. This shows that the user are reluctant to rate the videos as excellent in some cases. This kind of behaviour was also noted by M.H.Pinson [46]. Where as progressive decay of MOS started with the increase in packet loss values on the video. As the packet loss increased to 10 %, user ratings of football and foreman video sequence were ”good”, whereas the hall monitor video had a rating ”fair”. The user rating continued to degrade as the percentage of packet loss increased, at 20 % of loss the football remained ”fair” whereas the foreman and hall monitor degraded to ”poor”.
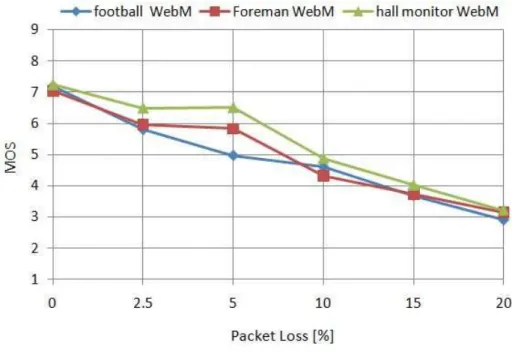
The MOS ratings for the WebM/VP8 video sequences with different packet loss values are shown in the Figure 4.2.The X-axis of the figure represent the packet loss values and Y-axis represents the MOS ratings. At packet loss values of 5 %, the user rating was ”good” for foreman and hall monitor, for the football video user ratings was close to ”fair”. The degradation of the user rating continued as the percentage of packet loss increased to 20 % with the MOS ratings close to ”poor”.
Figure 4.1: MOS based on the Packet loss for H.264
4.1.2 Delay Variation
Figure 4.3 illustrates the MOS rating of the users with different delay variation values, where X-axis represents the variable delay and Y-axis represents the MOS. The MOS ratings of H.264 videos had progressive decay as delay variation was ap-plied to the videos. At delay variation of ± 0 and ± 50 the MOS rating values were consistent, when the variation increased between ± 90 to ± 130 the MOS rating values degraded ”fair”. In the case of three video sequences the MOS ratings of hall monitor were noted to be low when compared to football and foreman.
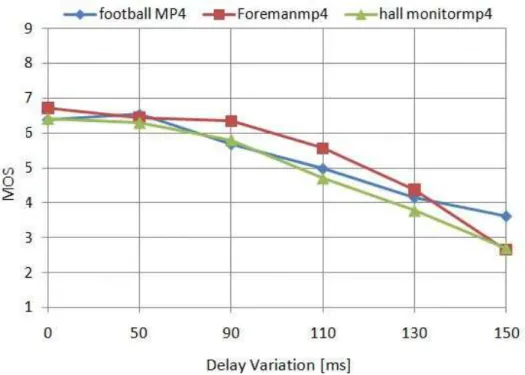
The MOS ratings for the WebM/VP8 video sequences with different delay val-ues are shown in the Figure 4.4.The X-axis in the figure refers to delay variation and Y-axis refers to the MOS ratings. A consistent MOS rating of ”fair” was noted between the delay variations of ± 0 to ± 150. In the case of the three video se-quences hall monitor and foreman are less affected when compared to the football, for a high delay variation value of ± 150ms the MOS is similar for all the three video sequences.
Figure 4.4: MOS ratings of delay variation for WebM/VP8
4.2
Comparison of H.264 and WebM/VP8
4.2.1 Packet Loss
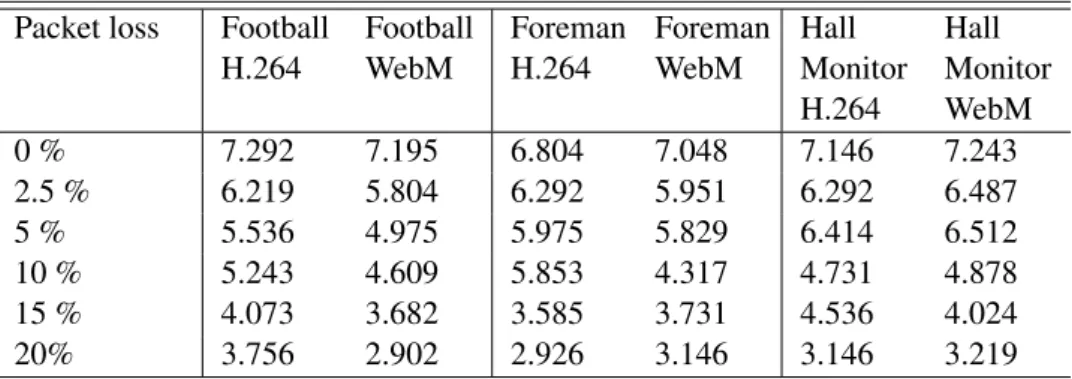
Table 4.1: Mos Ratings For Varied Packet Loss.
Packet loss Football
H.264 Football WebM Foreman H.264 Foreman WebM Hall Monitor H.264 Hall Monitor WebM 0 % 7.292 7.195 6.804 7.048 7.146 7.243 2.5 % 6.219 5.804 6.292 5.951 6.292 6.487 5 % 5.536 4.975 5.975 5.829 6.414 6.512 10 % 5.243 4.609 5.853 4.317 4.731 4.878 15 % 4.073 3.682 3.585 3.731 4.536 4.024 20% 3.756 2.902 2.926 3.146 3.146 3.219
The Figure 4.1 andFigure 4.2 shows the graphs of MOS ratings for H.264 and WebM/VP8 videos respectively. In both cases the user perception shows ”excel-lent” ratings without any packet loss. As the packet loss values increased, videos had a rating of ”good” until 2.5 % packet loss; there was a drastic change from ”good” to ”fair” in between 5 % and 15 % of packet loss. When 20 % of loss
was introduced to the videos, the user assessment was graded close to ”poor”. In the case of different videos sequences affected with packet loss. It is noted that the videos with the lowest MOS in the case of H.264 is foreman and hall monitor videos, where as in the case of the WebM the video sequence with lowest MOS rating is football video.
So the behavior in case of both H.264 and WebM suggests that as the packet loss increases the user rating decreases and the tendency shows that these two codecs have similar behavior for the values of packet loss increased. If this videos with high packet losses are provided as a service the user becomes irresistible to watch the video.
Figure 4.5: [95 %] Confidence interval for Packet loss
The confidence intervals for packet loss are shown in the Figure 4.5. The X-axis shows the H.264 and WebM video sequences (foreman, hall monitor, football) and the percentage of packet loss emulated. The Y-axis refers to the MOS ratings. It is appreciable that for each packet loss values in the case of both codecs there is no big difference within the three video sequences. The tendency shows that a higher value of packet loss represents observers degraded MOS ratings. In general the hall monitor video sequence showed the better overall rating when compared to football and foreman.
From the confidence interval graph it is clear that as the values of packet loss in-creases, the codecs H.264 and WebM had a progressive decay of MOS. In the case of different video sequences a higher value of packet loss represents observers de-graded MOS ratings. The hall monitor video showed the better overall rating when compared to football and foreman. The tendency of H.264 and WebM turned to
show similar behavior and were consistent as the values of packet loss increased .
Figure 4.6: Standard deviation for Packet loss
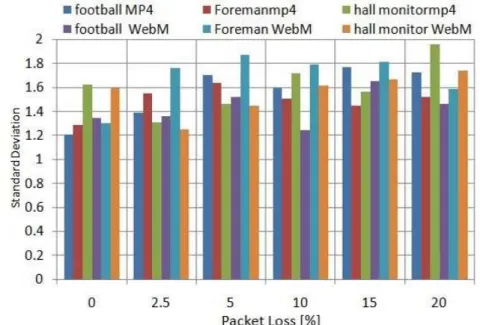
The standard deviation for different videos of H.264 and WebM/VP8 with vari-able delay was plotted in the Figure 4.8. The values ranged from 1.24 to 1.95, where the lower index indicates the minor divergence and the upper index indi-cates major divergence of the subjective ratings. The user ratings had a minor divergence for packet loss values of 0 % and 2.5 %, which intends that the ob-server grades have less variability. The quality assessment seemed to be difficult varying between the observers with high deviations during the packet loss values of 15 % and 20 %.
In [46] the author has compared the H.264 and MPEG-2 with respect to packet loss and without loss, But in our case we had replicated their work by comparing the ITU-T Video Coding Expert Group (VCEG) open source codec H.264 with a recently launched google codec WebM/VP8.
4.2.2 Delay Variation
Figure 4.3 and Figure 4.4 represents the H.264 and WebM/VP8 codec behavior that are affected by delay variation on different videos with respect to MOS. The behavior of H.264 videos with the fixed delay of 150 ms and variable delay of 0ms stated that the videos had a rating of ”good”, and was far better when compared with the rating of the WebM video which was rated ”fair”. As the delay variation increased the H.264 had decay in MOS ratings from ”good” to ”poor”, but in the case of WebM videos the overall MOS ratings was ”fair”.
Table 4.2: Mos Ratings For Varied Delay Variation. Delay Varia-tion Football H.264 Football WebM Foreman H.264 Foreman WebM Hall Monitor H.264 Hall Monitor WebM 150 ± 0 6.390 4.243 6.707 4.780 6.414 4.487 150 ± 50 6.536 3.926 6.439 4.439 6.292 4.121 150 ± 90 5.682 3.341 6.341 4.195 5.804 4.219 150 ± 110 4.975 3.731 5.560 3.902 4.707 4.073 150 ± 130 4.146 3.146 4.365 4.146 3.780 3.609 150 ± 150 3.609 3.121 2.658 3.268 2.707 3.756
So, from the above observations we can resolve that H.264 codec acts superior when compared with the WebM, whereas when high delay variation is considered WebM video codec shows much positive results when compared to H.264.
Figure 4.7: Confidence interval for delay variation
The confidence interval graph of delay variation is shown in Figure 4.7. The major factor to determine the length of a confidence interval is the number of peo-ple taking part in the estimation procedure, the X-axis determines different delay variations and Y-axis determines the user ratings (MOS). From the plot it is clear that H.264 Codec has higher MOS ratings for the delay variation of ± 0ms to ±130ms. But as the delay reaches to ±150 ms, the H.264 video had a less user
rating when compared to WebM videos. In case of video sequences the foreman video showed a higher rate compared to other sequence videos, but at ±150 ms its ratings were reverse. This shows that the overall ratings were consistent.
Figure 4.8: Standard deviation for delay variation
The standard deviation for different delays is plotted in the Figure 4.8 with the values ranging from 1.205 to 1.863. In the case of H.264 video sequences, the football video had a major deviation when compared to the foreman and hall monitor videos. Whereas, in WebM the hall monitor showed a better standard deviation when compared to foreman and football videos. So, we can say that during the MOS ratings of hall monitor (WebM) and football (H.264) the observers had different opinion on the video quality.
There was a similar study on performed by Claymen on H.263 by adding dis-turbances to a video sequences. We also found that inspite of not adding both the disturbances i.e. packet loss and delay variation, the user ratings had a degraded MOS ratings as the delay variation values increased progressively.
4.3
Comparison of Indian and Swedish user ratings
In this analysis the total of 30 users were taken into consideration based on their country of residence of which 15 users constitute to Sweden and the 15 users con-stitute to India.
4.3.1 Comparison with respect to Packet Loss
H.264
The X-axis refers to the delay variation and Y-axis refers to the MOS ratings. The analysis from both the plots of Figure 4.9 and Figure 4.10 show that as the packet loss values increases there will be a progressive decay in the MOS ratings. In the case of video sequences foreman, hall monitor videos had a better rating for 0 % packet loss for Indian users when compared to Sweden. Whereas MOS ratings of football video sequence in the case of Sweden is found to be rated high when compared to that of India. When higher values of packet loss applied to the video, the users of Sweden rating were dropped to ”poor”, where as in the case of India it was rated to ”fair”.
Figure 4.10: MOS rating for Indian users in H.264 packet loss. WebM
The X-axis refers to the delay variation and Y-axis refers to the MOS ratings. From the plots of Figure 4.11 and Figure 4.12 it is observed in case of India that when packet loss values of 0 % is applied, foreman and hall monitor video sequences rated ”excellent”, where as the Sweden users ratings were ”good”, As the packet loss values increased to maximum of 20 % user ratings in the case of Sweden de-cayed to ”poor”, when compared to Indian users ratings which were ”fair”. So it is clear that in the case of WebM when higher packet loss values are applied, the MOS ratings of India were high when compared to the Sweden.
Figure 4.11: MOS rating for Sweden users in WebM packet loss
4.3.2 Comparison with respect to delay variation
H.264
Figure 4.13: MOS rating for Sweden users in H.264 delay variation
The delay and delay variation plots of Sweden and India for H.264 codec is shown in the Figure 4.13 and Figure 4.14. The X-axis refers to the delay variation and Y-axis refers to the MOS ratings. As the effect of delay variation increases MOS ratings had a progressive decay. The MOS ratings in the case of Sweden were rated low when compared to the ratings of Indian users. So this analysis showed an interesting behavior in the case of Foreman and Hall monitor at delay variation of 150 ms. The Sweden user ratings for Hall monitor and foreman videos shows degraded MOS to ”poor”, when compared to the MOS ratings (”fair”) of India. WebM
From the Figure 4.15 and Figure 4.16. X-axis refers to the delay variation and Y-axis refers to the MOS ratings. The analysis showed a different scenario in the case of WebM/VP8. At 0ms the quality assessment of video sequences signify ”fair” MOS rating in the case of Sweden, whereas in the case of India its perception was rated as ”good”. At 150ms the assessment of Sweden ratings tends to ”poor”, where as in the case of India, the assessment tends to ”fair”. So this analysis shows that the WebM video assessment in the case of India had high user ratings when compared to Sweden.
4.4
Comparing the average connection speed for India and
Sweden
Figure 4.17: comparing the average connection speed for India and Sweden. In Figure 4.17, the X-axis refers to the quarter-years from 2009 to 2011.The Y-axis refers to the connection speed in Kbps. As per the State of the Internet report released by Akamai [47] in the first quarter of 2011 the average connection speeds of Sweden and India are 4963 kbps and 788 kbps respectively. And also the vari-ations between the average connection speeds for each quarter starting from year 2009 are negligible with very less transformations as shown in Figure 4.17. This signifies that Sweden users experiencing high bandwidth connections which works perfect for the video sequences. But in the case of Indian users, they experience low speed connections when compared to Sweden. Bandwidth availability implies connection speed which shows variations in video quality. The perception level for video sequences with packet loss and delays is acceptable by Indian users because of their earlier experiences. This might had played major role to show deviated MOS ratings of Sweden and Indian users.
4.5
User Feelings and Experience of Online videos
There is a variation in the quality of the video without any disturbances applied to the video sequences. The video sequences were analyzed by the user based on their feelings is shown in Figure 4.18. The past experience of the users in watching the On-demand videos are shown in Figure 4.19.
Figure 4.18: MOS ratings based on the feelings of the user
From the Figure 4.18, X-axis represents the feelings of the user and Y-axis refers to MOS. It is observed that three video sequences showed different MOS be-havior depending on the feeling of the user. Subjects whose feeling were confused and sleepy rated the quality of the video sequences between ”good” and ”excel-lent”, Whereas the subjects feeling ”sad”, ”very sad”, ”happy” and ”very happy” assessed the video quality keenly and rated the MOS between ”fair” and ”good”. So we state that the user feelings impact on the quality of the video.
Figure 4.19: MOS ratings based on the experience of the user with the videos In Figure 4.19 , X-axis represents the experience of the user with the videos and Y-axis refers to MOS. It is observed that the user experience ranging from ”never” to ”daily” encounters a good impact on MOS ratings. When the user expe-rience on the videos was ”daily”, ”often” and ”sometimes”, the MOS ratings of the football video was much better when compared to the hall monitor and foreman. Whereas the MOS ratings of the user who never watch the videos rated high for foreman and hall monitor. So we state that the user rating differs depending on their experience of watching the online videos.
4.6
Validity threats
Validity threats are basically categorized into internal and external threats. Internal threats are ” the factors that cause interference in the investigators ability to draw correct inference from the gathered data” [48]. In our thesis the internal validity threats are stated as follows:
The results are likely to have variations because of NetEm, as it drops the pack-ets randomly. So it might affect the quality of the video in different ways as the packets dropped (whether I-frame or P frame) cannot be traced for H.264.
After the transmission of the packets from the server to the client, the video se-quences (football, foreman and hall monitor) are stored using VLC player. Three samples of each combination were performed to have a database to select the videos for use in the human perception assessment.
During the user assessment the user feel tedious for the participation because of long assessment sessions, so it might affect the assessment ratings. So in order to avoid boredom and achieve minimum reliability of results, four videos sequences in the randomized order are presented before the user.
External validity is basically based on the experiments as experimental validity. It is the validity of generalized inferences in scientific studies [48]. In our thesis the main factor affecting the external validity threat is implementation in real phys-ical internet environment because it is difficult without the cooperation from global authority. In order to overcome this we had proposed our model in small physical environment.
Conclusions and Future Work
5.1
Conclusion
Our thesis results show performance analysis of H.264 and WebM/VP8 encoded video sequences based on subjective video quality assessment methodology. For further analysis we also considered users feelings, past experience with the videos and country of residence.
The video sequences are introduced with varying packet loss and delay vari-ation values in experimental network setup.In subjective assessment we surveyed users experience and collected their feedback concerning visual impairments and degradation in video sequences with predefined questionnaire. The collected user assessment data is analyzed following statistical methods.
The first research question deals with how the user perceives video quality with respect to packet loss and delay variation for the video encoded using H.264 and WebM/VP8 codecs. We can observe substantial differences between quality assessment of both H.264 and WebM encoded videos. The MOS ratings show that as packet loss and delay variations increase, quality of the video decreases. The users ratings has a drastic change during 5 % and 15 % of packet loss which led to decrease MOS ratings from ”good” to ”fair”. In case of low delay variations H.264 is rated as ”excellent”, whereas WebM/VP8 has shown ”fair” results. At high delay variations, WebM/VP8 shows better performance in contrast to H.264. This shows that the user feels more comfortable while watching the H.264 encoded videos at low delay networks and WebM/VP8 encoded videos in high delay networks.
In the second research question we consider how the user perception differs based on their country of residence in case of H.264 and WebM/VP8 codecs with respect to packet loss, delay variations. In this scenario we can observe differences between perception levels of Sweden and Indian users, this is due to the acceptabil-ity of video sequences. As the packet loss values increases the Indian users have a better MOS rating than Sweden. At high delay variation Swedish users rated per-ception of WebM/VP8 encoded video sequences as ”poor” and Indian users rate it as ”fair”. This behaviour is because of the bandwidth availability which affects the
variations in quality.
H.264 exhibits improved performance than WebM/VP8 at low delay variations and at high delay variations WebM/VP8 performs better. From this we can state that in India where average connection speeds are low with high delay variations, WebM/VP8 codec can be used to encode and stream videos for efficient perfor-mance.
Furthermore, we identify that the user experience and feelings impacts the QoE of the video. Also, we found that the QoE of the video sequence depends on the video codec used for encoding purpose.
5.2
Future Scope
Further research needs to be done comparing the GOP structure of both codecs (H.264 and WebM/VP8). PEVQ software can be used to compare these two codecs for both objective and subjective assessments. Analysis can also be done on the packets which are captured and stored in the consumer during the experimentation session. It is necessary to understand the behavior of different references frames in both the codecs, which implies studying the effect of lost frames for both the codecs.
[1] D. Kaspar, K. Evensen, P. Engelstad, A.F. Hansen, P. Halvorsen, and C. Gri-wodz. Enhancing video-on-demand playout over multiple heterogeneous ac-cess networks. In Consumer Communications and Networking Conference (CCNC), 2010 7th IEEE, pages 1 –5, jan. 2010.
[2] I.-M. Pao and Ming-Ting Sun. Encoding stored video for streaming appli-cations. Circuits and Systems for Video Technology, IEEE Transactions on, 11(2):199 –209, feb 2001.
[3] Cisco Website. Cisco Visual Networking Index: Forecast and Methodology, 2010 2015, [Online; Verified August] Available:2011.
[4] K.A. Hua, M.A. Tantaoui, and W. Tavanapong. Video delivery technologies for large-scale deployment of multimedia applications. Proceedings of the IEEE, 92(9):1439 – 1451, sept. 2004.
[5] K. Couch. Raising the Bar for Triple play with VoD, [Online; Verified July] Available:2011.
[6] Chi-Yuan Hsu, A. Ortega, and M. Khansari. Rate control for robust video transmission over burst-error wireless channels. Selected Areas in Communi-cations, IEEE Journal on, 17(5):756 –773, may 1999.
[7] ITU-T G.1080. Quality of experience requirements for iptv services, 2008. [8] Webm project, February 2011. http://www.webmproject.org/.
[9] Patrick Seeling, Frank H. P. Fitzek, Gerg¨o Ertli, Akshay Pulipaka, and Martin Reisslein. Video network traffic and quality comparison of vp8 and h.264 svc. In Proceedings of the 3rd workshop on Mobile video delivery, MoViD ’10, pages 33–38, New York, NY, USA, 2010. ACM.
[10] J. Shaikh, T.N. Minhas, P. Arlos, and M. Fiedler. Evaluation of delay perfor-mance of traffic shapers. In Security and Communication Networks (IWSCN), 2010 2nd International Workshop on, pages 1 –8, may 2010.
[11] C.G. Gu andrler, B. Go andrkemli, G. Saygili, and A.M. Tekalp. Flexible transport of 3-d video over networks. Proceedings of the IEEE, 99(4):694 –707, april 2011.
[12] ITU-T P.910. Subjective video quality assessment methods for multimedia applications, 1999.
[13] ITU-R BT.500-11. Methodology for the subjective assessment of the quality of television pictures, 2002.
[14] Ed. James Harry Green. Video Systems. New York: McGraw-Hill Profes-sional, ”5” edition, 2006.
[15] Iain E. G. Richardson. H.264 and mpeg-4 video compression: Video coding for next-generation multimedia, 2004.
[16] K. Panusopone, Xue Fang, and Limin Wang. An efficient implementation of motion estimation with weight prediction for itu-t h.264 mpeg-4 avc. Con-sumer Electronics, IEEE Transactions on, 53(3):974 –978, aug. 2007. [17] ”J. Bankoski”. ”on2’s truemotion vp7 video codec and golden frames”. ”EE
Times ”, July 2008.
[18] Yaowu Xu” ”Jim Bankoski, Paul Wilkins. ”technical overview of vp8, an open source video codec for the web”, March 2011.
[19] Videolan, [Online; Verified March] Available:2011.
http://www.videolan.org/vlc/streaming.html/.
[20] Darwin Streaming Server, [Online; Verified March] Available:2011.
http://dss.macosforge.org/.
[21] FF Server, [Online; Verified March] Available:2011.
http://www.ffmpeg.org/ffserver.html.
[22] Flumotion Streaming Server, [Online; Verified April] Available:2011. http://www.flumotion.com/blog/webm-vp8-streaming-live-from -flumotion.
[23] Bing Wang, Jim Kurose, Prashant Shenoy, and Don Towsley. Multimedia streaming via tcp: an analytic performance study. In Proceedings of the 12th annual ACM international conference on Multimedia, MULTIMEDIA ’04, pages 908–915, New York, NY, USA, 2004. ACM.
[24] Luigi Rizzo. Dummynet: a simple approach to the evaluation of network protocols. SIGCOMM Comput. Commun. Rev., 27:31–41, January 1997.
[25] HEMMINGER. Network emulation with netem,
![Figure 2.1: Sampling and Temporal samplings in the video sequence [15]](https://thumb-eu.123doks.com/thumbv2/5dokorg/5495616.143117/15.892.187.703.287.680/figure-sampling-temporal-samplings-video-sequence.webp)

![Figure 4.5: [95 %] Confidence interval for Packet loss](https://thumb-eu.123doks.com/thumbv2/5dokorg/5495616.143117/36.892.192.698.407.743/figure-confidence-interval-packet-loss.webp)