S T A T E N S V Ä G I N S T I T U T
T H E N A T IO N A L SW ED ISH RO A D R E S E A R C H IN S T IT U T E
S T O C K H O L M
R E P O R T 30 A
DETERM INATION OF THE
G R O U N D FROST LINE BY MEANS
OF A SIMPLE TYPE OF
FROST DEPTH IND ICATO R
(Bestämning av tjälgräns i mark med enkel typ av tjälgränsmätare)
byR U N E G A N D A H L
Translated and revised by P. T. Hodgins
Foreword
The original Swedish version of this report was written in December 1956, and published in 1957. The frost depth indicator invented by the Author was just then in its final stage of development and was going into routine use. The report filled an urgent need for a practical description of the instrument and its application to field use, for the instruction of the field observers; at the same time it was published freely for the benefit of the whole community of those interested in ground frost problems.
The Gandahl-type frost depth indicator has been in wide use in Sweden over the years since 19 56— 57, and has proved itself a most useful tool in the study of frost action in roads. Few of these instruments have been used outside of Sweden until the present time, however. It may be supposed that this is partly because the Swedish-language report was not widely translated for use by others. Now, in the winter 1962— 63, it is known that three Dominion Government agencies in Canada alone are taking up the use of the Gandahl instrument. With this awakening of international interest, it seems appropriate to issue this report also in English.
At the same time, it is appropriate to incorporate a number of changes in the text and even among the illustrations. The main purpose of these has been to keep the work as up to date as possible, both in regard to the details of the instrument itself, and to the background discussions. In addition, some aspects of the installation procedure are now described for the first time in a publi cation, and some material which might also be found in textbooks or elsewhere has been added in order that any reader may understand the discussion without consulting these sources. This is not to say that this paper replaces other refer ences, however; subjects such as undercooling (supercooling) and lowering of the freezing point can only be skimmed over here.
Stockholm, March 1963. P. T. Hodgins,
Geological Department, Statens Vaginstitut.
Determination of the ground frost line by means of a
simple type of frost depth indicator
Table of Contents
Examples of some types of frost measuring instrum ents... 4
Construction of the frost depth indicator ... 4
Installation of the frost depth indicator in the g ro u n d ... 9
Determination of the frost depth ... 12
Discussion of the indicator’s accuracy ... 14
The position of the frost in the ground is of great importance in many technical problems. It is therefore of great value to be able to measure this position in an easy way, and thus to be able to register the thickness and extent, and the vertical progress and recession, of the frost layer at various times during the frost season. The frost depth indicator to be described here has been developed to provide this ability. B y w ay of introduction, however, two other methods for the determination of frost depths will first be briefly de scribed.
Examples of other types of frost measuring instruments
One of the two methods of frost depth determination developed by others which will be mentioned here is that of the Swedish Geotechnical Institute.1 The basis is the strongly marked change in the electrical conductvity of a given soil upon a change between the frozen and unfrozen states.The second method is one which has been developed and used in Germany. Observations for a winter’s frost season made by means of the “ Frostindikator” have been published and discussed.2, 3 The principle employed is that heat can be transferred horizontally between the ground and an indicator column con taining a freezable solution, so that the frost line may lie at equal heights in the ground and the indicator column. In the German application of this principle, the position of the frost line in the column is determined by probing with rods.
The apparatus for the German method is housed in a vertical concrete pro tection tube of io cm internal diameter and i m depth. The space inside is divided into segments io cm high by an insert consisting of a central support and a series of perforated shelves. On each shelf rests an indicator body con sisting of a rubber casing filled with foam rubber and indicator solution; a rod leads upward from each such body, through the perforations of the shelves above, to the top of the column at the ground surface. Except for these components, the column contains only air. The existence of frost conditions at any of the ten test levels is indicated if the rod in question cannot be pushed downward with finger pressure. It is assumed that the indicator solution used is water or an aqueous solution, although the descriptions of the apparatus do not state this.
It has been reported that good values for the vertical extent of the ground frost zone were furnished by the German frost indicator.
Construction of the frost depth indicator
The frost depth indicator developed at Statens Väginstitut was based on the same first principle as the German instrument, that is, on the principle that horizontal heat transfer can be used to produce freezing conditions in an indicator column to correspond to those occurring in the ground. This basis
was chosen after experiments with the German indicator clearly showed that a simple and robust, reliable instrument could be developed from such a simple and direct principle.
The German indicator itself was not suitable for use in Sweden. For one thing, the measuring range of o to 100 cm was too limited for the greater part of Sweden, and particularly for the areas where the most important frost problems often occur. In addition, the German indicator seemed complicated,
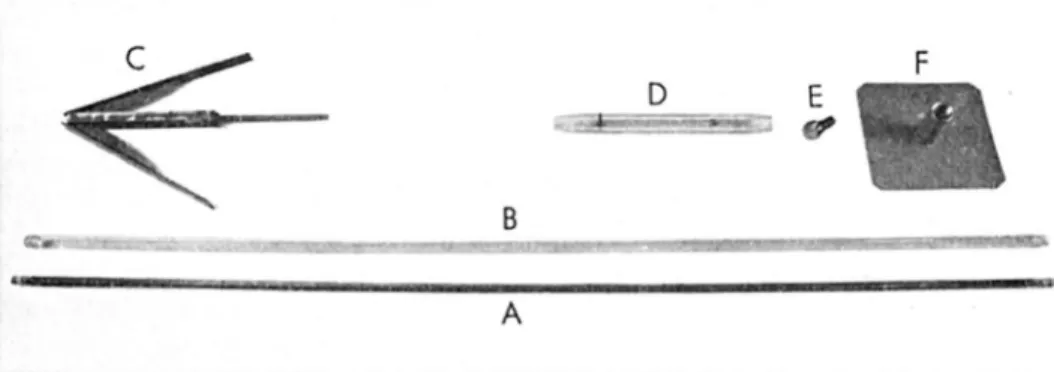
Fig. ia . The frost depth indicator before assembly. The parts include
A) the instrument pipe assembly, or frost depth indicator proper; this includes an acrylic plastic rigid pipe, a latex rubber tube stretched inside the pipe and anchored at the ends by means of plastic stoppers, and in the annular space so formed, a filling of methylene blue dye solution; B) the lining pipe, for maintaining the hole in the ground into which the instrument is inserted; C) the lining pipe anchor; D) the telescoping tube fitting around the upper end of part B (note the rubber sealing ring at one end); E) the screw-plug top of the instrument, from which A is suspended; F) the anchor for the top-end telescoping assembly which includes D. Part E screws into part F to close the top of the lining pipe. A ll parts except B and C ride up and down with surface heaving and settlement movements.
Parts C to F are unnecessary for most installations in untravelled areas.
Fig. i b. The parts shown in Fig. i a, assembled as if for use in a
expensive, and of doubtful precision. The aim in the development of the new type of frost depth indicator has been to produce a simple, cheap, easily-handled, reliable, and robust instrument which still gives indications of the positions of the frost line or lines with a degree of accuracy adequate for all practical purposes.
The resulting instrument has taken the form, basically, of a long column of indicator solution encased in a clear plastic pipe, the solution being one of a dye in distilled water and having the property of changing from a deeply coloured liquid to colourless ice at o°C . The indicator pipe may be raised from its narrow, vertical hole in the ground at any time, and read by simply noting the position of the colour change in the indicator solution. There are no steps in the continuous scale of readings furnished by this instrument.
Described in more detail, the frost depth indicator consists of an acrylic plastic pipe of 15 mm outer and 10 mm inner diameter, and 2, 2.5, or sometimes even 3 m length; a rubber tube stretched from end to end inside the pipe and anchored at the ends by plugs which also seal the tube and the space between the tube and pipe walls; a filling, in the sealed annular space between the tube and pipe walls, of an indicator solution of 0.05 % methylene blue in distilled water; and accessory apparatus for the protection of the indicator proper, and main tenance of the hole in which it must be installed in the ground. As an aid in reading the instrument, it is graduated with markings at 5 cm intervals.
The hole in the ground is maintained mainly by a lining pipe which naturally must be a little bit wider and longer than the outside dimensions of the instru ment pipe. In frost heaving soils there is a strong possibility that such a lining pipe will be gripped by the frozen soil and lifted upward, and so, if this movement cannot be tolerated (as is the case, for example, where the frost depth indicator is installed in a roadway), anchorage must be provided. This has been accomplished by means of a pair of folding steel wings which may be spread after the anchorage assembly has been pushed down to the right level in the hole. The spreading is performed by the turning of a screw and by lifting at the center hinge of the wings, after which the lining pipe may be pushed down and attached to the anchorage by screwing together matching parts. Because the frost lifting force still exists, however, it is necessary to lubricate the lining pipe with a low-temperature grease before inserting it in the hole; this makes it difficult for the frozen ground to grip the lining pipe, and prevents the pipe being torn in two. The grease is unnecessary where anchorage of the lining pipe is not employed.
An additional assembly of parts designed to protect the upper end of the installation must be used where traffic may pass over the test site. This assembly must be able to ride up and down with the surface during frost heaving motions, for example, and for this reason is furnished with an anchor plate or set of wings to be embedded near the surface. A part of this assembly also consists of pipes of larger diameter than the hole lining pipe so that telescoping vertical motions are possible. The annular space between the telescoping parts is sealed with a rubber ring. The final essential feature of this assembly is a screw top
designed and greased to keep dirt and water out of the lining pipe. Simply as a convenient means for retrieval of the instrument pipe from the interior of the lining pipe, the instrument pipe is fastened to the underside of the removable member of the screw top. Thus the instrument pipe is raised when the top of the hole is opened.
For installations in open fields and the like, where traffic is not a problem but finding the frost depth indicator installation in the snow can be, some means of marking the test site and of extracting the instrument pipe without disturbing the snow is required. To accomplish these purposes, the lining and instrument pipes can be left projecting above the ground surface to a height where they cannot become lost; in this case a simple snow cap is all the extra equipment required at the top of the pipes. Alternatively, a rod or pipe can be attached to the top of the instrument pipe as an extension to facilitate handling, and a larger diameter pipe can be used to extend the lining pipe. Again a snow cap is required. In any case, it is wise to prevent disturbances to, and especially the compaction of, the snow cover near the frost depth indicator installation; compacted snow has a much higher thermal conductivity than loose snow, and in addition disturbances which diminish the snow depth have a further adverse effect on the insulating effect of the snow blanket. A raised catwalk may be used to keep the observer’s feet out of the snow.
Returning to the frost depth indicator itself, an attempt must be made to explain the disappearance of the colour of the methylene blue indicator dye solution upon the occurrence of freezing. As far as can be discerned, the change has little or nothing to do with any change in the chemical properties of the solution. It seems that the large dye molecules are excluded from the ice crystals, and concentrate in small cavities in the ice mass, at the crystal boundaries, and at the surfaces of the plastic pipe and rubber tube. Since the indicator solution is 99.95 % water and only 0.05 % dye, it is not difficult to see that, if they are perfectly segregated, the water in the form of ice crystals will form by far the greater part of the total, which will consequently look more like pure ice than like anything else.
Because the dye is only moved short distances by the ice, there is always dye present when thawing sets in. This dye immediately dissolves and diffuses so that the solution is again blue. Thus it is possible to observe the downward progress of the thawing line in the spring, even though a good deal of ice still occupies the middle and lower parts of the instrument.
The rubber tubing stretched inside the instrument pipe has several functions. The first is to form a central air-filled void running the full length of the instrument so that the expansion of the freezing solution may take place inward, with a slight deflection of the rubber tube walls, and thus will be prevented from bursting the pipe. The second is to hold only a thin layer of the indicator solution against the pipe walls so as to reduce the volume of solution present and thus to reduce the amount of heat transfer necessary for the conversion of water to ice or vice versa. This results in increased sensitivity to vertical variations of the frost line in the ground. The third function is to help fix the
position of the ice in the indicator column when it tries to float upward through the water produced in the upper parts of the column during the spring thaw. A fourth function is to act as a long tension spring which keeps the end-plugs o f the instrument pipe in place by pulling them toward the middle of the pipe; and a fifth is to supply a surface for the concentration of the dye mole cules during the freezing process.
The materials used in the frost depth indicator must be selected not only to produce a reliably functioning apparatus but also to ensure that the results produced are as accurate as possible. Thus it has been necessary, for example, to avoid both a certain type of rubber tubing which absorbs water and grows longer during freezing, and metal pipes which would conduct heat faster than the surrounding soil and hence would disturb the thermal regime in the ground and instrument.
The heat transfer between the indicator solution and the ground must occur only in a horizontal direction, through the instrument pipe walls. The instru ment must not be allowed to conduct any significant amount of heat vertically between the frost line region and any other if disturbances to the frost lines in both the ground and the frost depth indicator itself are to be avoided. The overall horizontal thermal conductivity of the ground-instrument system should therefore be as great as possible in relation to the vertical conductivity of the instrument installation. This objective is achieved by making the instrument o f low-conductivity material, so that the horizontal conductivity of the soil is comparatively great, especially when the small conducting cross section of the instrument is kept in mind (see Table I).[1] The only major material
T A B L E I
M aterial1 D ry Density g/cc Moisture Content °/o by weight
Coefficient of Thermal C onductivity kcal/m • h- ° C Sandy gravel 2.0
3
2.0 Coarse mo 1.69
1.1 M jäla i-5
25
1.2Light med. clay 1.2 51.4 1.18
H eavy med. clay 1.03 G 0.88
H eavy clay i
-3
34.8 1.1Moraine clay 1.8 1 6 2.0
Ice, — io ° C — — 1.982
Water — — 0.502
A ir — — 0.0202
Plexiglas, acrylic plastic — — 0.16
Rubber, para — — 0.16
D] Most o f the values of Table I have been generously provided by Fil. Lic. E. Saare. 1 The Swedish soil classification system devised by Atterberg is used in this report. Soil fraction grain size limits do not necessarily correspond to those used in other systems, just as the latter systems differ among themselves. A number o f English-language names may be used
occurring in the indicator which does not have a thermal conductivity lower than the listed soils is ice. Even this need cause no concern however, because the ice occupies only about 5 — 10 °/o of the total cross-section of the installation, and occurs at the same levels as frozen soils, which have somewhat higher con ductivities than the unfrozen soils listed here.
If a cross section of the frost depth indicator is considered, it consists, be ginning at the outside, of 1) the lining pipe, in direct contact with the sur rounding soil; 2) a narrow air space, providing clearance for the extraction and replacement of the instrument pipe in the lining pipe; 3) the instrument pipe; 4) the indicator solution film; 5) the rubber tube; and 6) the central air space. During part of the season the indicator solution film will be turned to a film of ice at the typical cross section. The air and solution spaces are long and narrow, and consequently the transport of heat in quantities that might cause thermal disturbances as a result of convection currents is not possible.
Acrylic plastic pipes have been chosen for both the lining and the instrument pipes. In both places this plastic is suitable because of its low thermal con ductivity and its toughness and strength. It is rigid enough to maintain its shape, but flexible enough to withstand breakage because of ground movements or rough handling. Its transparency is also a necessary quality for the instru ment pipe, and its smooth surface is advantageous in the lining pipe, especially when it is hoped that the freezing of the soil to the outside of the lining pipe can be prevented. I f another material can be found which is suitable from these points of view, it may be used, but it is most important that the thermal conductivity of the soils at the test location should not be exceeded.
Installation of the frost depth indicator in the ground
The frost depth indicator should be installed with the minimum of disturbance to the conditions normally existing in the ground and at its surface. I f con ditions are upset to any great degree, abnormal frost depths may be produced, and the readings provided by the indicator will be misleading because theywith reasonably small errors to describe the Swedish soil fractions, but it seems best to retain two Swedish terms which find no direct equivalents in most other systems. The reader should compare the list of grain size limits which follows to whatever other limits he is most fam iliar with. As with other systems of soil classification, natural soils are named for their predominating fraction ('s'). clay up to 0.002 mm "m jäla” 0.002— 0.02 mm “ mo” 0.02 — 0.2 mm sand 0.2 — 2.0 mm gravel 2.0 — 20.0 mm stones 20.0 — 200.0 mm boulders over 200.0 mm
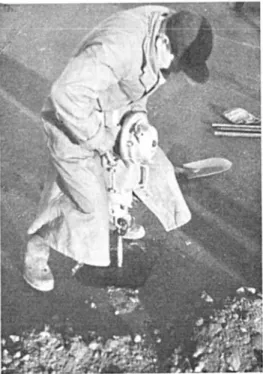
Fig. 2. Machine sounding o f the installation
hole. Road superstructure material has al ready been removed to permit the placement of the upper-anchorage plate. H and sound ing is possible in many softer soils.
Fig. 3. A fter the installation of the lining
pipe and the upper-end telescoping pipe, a seat is prepared for the upper-anchorage plate. A cotton w ad prevents dirt entering the lining pipe.
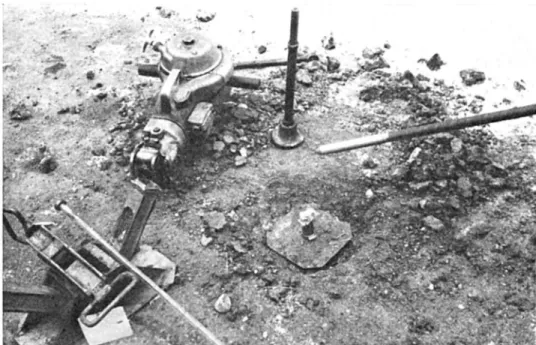
Fig. 4. The anchor plate has been placed and is held by a hose clamp. The flexible plate w ill
seat firm ly with the compaction of overlying road materials. A t bottom of photo, the upper end of the waiting frost depth indicator rests on an apparatus for extracting wedged sounding rods from the ground. Continuing clockwise, there is a hand-held drill; a tamping tool; and a sounding rod. The latter two items can be either machine- or hand-operated. Behind the drill and tamper lies a prying bar.
are not representative of the undisturbed ground. For this reason, the hole in the ground should be made by sounding or drilling a hole of just the right size to accept the lining pipe. Excavation, or oversized drilling, followed by backfilling should be avoided except, perhaps, in the granular materials with which the road superstructure has been built up. These, it can be argued, have already been disturbed. Even so, it is necessary to return these materials to a state as nearly like that in which they were found as possible.
For several reasons, the installation should be completed before the beginning of the frost season. The installation is easier and better in unfrozen ground, there is no disturbance to any frost already present, and a more complete record of the whole frost season may be made.
The hole can be sounded by hand tools, such as pinch bars, in some soils such as soft silt and clay. Other, stonier soils require the use of machinery for drilling and/or sounding as well as, sometimes, for the recovery of rods which may become wedged by the stones. This equipment need not be complicated, however; a simple, hand-held jackhammer or percussion drill and a simple puller acting like a car jack with jaws to grip the rod are usually sufficient. Because of the depth of the indicator holes, two or three progressively longer
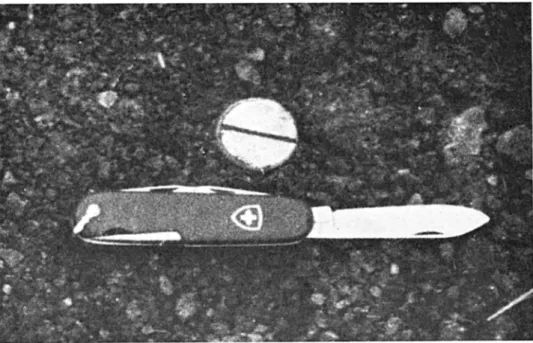
Fig. 5. O nly the screw plug which seals the hole and suspends the instrument proper can be
seen when the installation is complete. Diameter of the plug is 3 cm. (about 1 3 / 16 in.).
drill rods may be most conveniently used. Also, a hole may be drilled undersize and sounded out to the full size with an ordinary sounding rod.
The first thing to go into the hole after its completion is usually the anchor age of the lining pipe, which must then be fixed in position. Thereafter the lining pipe is greased and inserted; where there is no anchorage, the grease can be omitted. I f there is an anchor, the lining pipe is next attached to it. Then the assembly which protects the upper end is added, or, in open field installations, the extensions and snow cap are added. When an anchor plate or wing assembly is placed in the road surface, care should be taken that the underlying materials are properly levelled and compacted first. This preparation is difficult with frozen soils, and should therefore be completed by late autum.
Various phases of the installation of the frost depth indicator are illustrated in figures 2 to 5 inclusive.
Determination of the frost depth
Except for the duration of the observations, the frost depth indicator should be kept always in the ground. The screw top must be kept well greased and tightened down. For an observation, the snow, water and dirt that may be present are first removed, the top is unscrewed, and the instrument pipe is withdrawn. It is then a simple matter to note the depth to which the colourless
Fig. 6. Obtaining a frost depth reading. The in
strument indicates that the o °C isotherm lies 107 cm below the road surface, in this case.
ice extends, below which the unfrozen blue solution cannot be mistaken. As has been mentioned earlier, the position of the colour change can readily be determined on a scale marked directly on the instrument pipe.
The point that is often missed by observers is that the position of the “ thaw line55 in spring also can be noted easily, as a new band of blue spreads down ward from the surface. In a typical example, the indicator may be blue from the top to the 25 cm line, then colourless to the 100 cm line, then blue again to the bottom of the instrument. This indicates that only the ground between 25 and 100 cm below the surface remains frozen. It could happen, though, that cold weather might return suddenly, in which case a new colourless band would appear at the top of the column. Such a turn of events would thus produce four bands of alternately colourless ice and deep blue liquid. The observer should be alert for the thaw line with the onset of warm weather, and may even see a secondary frost line like that suggested here if the warming trend is reversed.
The boundaries between frozen and unfrozen soils, and between frozen and unfrozen portions of the indicator solution, are both usually well marked, especially in damp soils falling within a wide range of intermediate grain sizes. With clays and dry, coarse, stony soils, however, aberrations often occur. In the case of coarse, dry soils the heat transfer near the frost line is made
irregular by the discontinuous nature of the stone and void-riddled strucuture; even convection currents might occur in the voids of some materials, and these carry heat upward through the void system while the frost is penetrating down through the stones by conduction. The result may be a transition zone over which only parts of the indicator solution are frozen. In such cases it is necessary to choose the readings consistently. It has been decided that the transition zone should not be counted as part of the frozen layer.
In the case of clays, there is seldom any doubt about the position of the colour change visible in the column of indicator solution, but only about its meaning. This will be considered further in the next section of this paper.
It must also be mentioned here that a small quantity of air may concentrate in the upper end of the instrument during the frost season. This is quite normal. The liquid could simply be “ topped up” by the addition of a little extra so lution each year, but it is considered best to start each frost season with a fresh charge of solution regardless of the presence or absence of air. The air space will consequently be eliminated in the refilling of the indicator solution column. The refilling is facilitated by the use of a suitable filling bottle.
Discussion of the indicator’s accuracy
The indicator solution of the frost depth indicator freezes at o °C , inde pendently of the surrounding soil. Since most soils also freeze at o °C , and since the instrument has been designed to assume the temperature of the ground at every level, the frost lines inside and outside of the indicator w ill normally coincide. The only exceptions will occur when the freezing temperature of the ground water is lowered below o °C or when undercooling occurs and prevents entirely the freezing of either the ground water or the indicator solution. It should be remembered, however, that as long as the frost depth indicator is functioning normally, it will indicate the position of any o°C isotherm in the ground, regardless of whether ground frost has actually appeared at that level. The position of the o °C line can thus be found, for example, even in dry bedrock. This facilitates the detection of frost conditions near buried water pipes and other facilities.
The phenomena of undercooling and lowering of the freezing point must now be discussed further, since they are capable of affecting the meaning of the readings obtained with the frost depth indicator. Undercooling occurs when a liquid is cooled below its freezing point without the occurrence of freezing simply because there is no group of molecules present which will take the first steps in the formation of the first ice crystal. The phenomenon occurs quite normally, but is not often noticed outside the laboratory. One reason is that, in natural surroundings, there are usually ice crystals supplied to the water in the forms of snow, hail, hoar frost, and the like. Ice
crystals are the most effective possible nucleators of freezing, and furthermore the fact that ice can propagate itself through the pore system of many soils can be observed if one adds an ice crystal to an artificially undercooled soil sample. Consequently, the undercooling of the moisture in natural soils under outdoor conditions must occur relatively rarely. There is additional insurance against soil moisture undercooling because of the presence of many substances in soils, some of which may be capable of encouraging the water to nucleate spontaneously.
The undercooling of the liquid in the frost depth indicator is not quite so unusual. This liquid is sealed in, and has no opportunity to obtain nucleation from outside the instrument. The initial frost penetration into the ground may be masked by the undercooling of a frost depth indicator so that its entire liquid column retains the original blue appearance. Fortunately, nucleation usually occurs before the ground frost has penetrated very far, perhaps with the aid of vibratory energy when the instrument is installed in a roadway. When undercooling persists in one instrument out of a group, there is little chance for misinterpretation of the results; there is, however, a wasted oppor tunity to learn something about the ground frost. Experiments are therefore in progress (1963) with a view to minimizing the undercooling problem.
Lowering of the freezing point is a phenomenon which occurs independently of undercooling. It occurs when water is incapable of freezing at o °C regard less of the presence of ice nuclei, and when water and ice can coexist in mutual contact at some temperature below o °C on a stable basis. There can be a number of causes, including the presence of dissolved substances such as salts. The latter cause is theoretically always in effect for ground waters, but the resulting freezing point depression is normally small and can generally be neglected.
A more interesting cause is the action of mineral surfaces on nearby water molecules. An intermolecular influence causes the latter to cling tenaciously to their liquid status. This effect is extremely strong nearest the mineral boundary, but it tapers off rapidly with distance from the boundary so that the whole water layer affected is measured in terms of few microns (thousandths of a millimeter). Thus the depression of the freezing point is very high im mediately next to mineral surfaces, but very quickly disappears at short distances from these surfaces.
Where soil pores are reasonably large, by far the greatest bulk of the total void capacity will be entirely unaffected by this phenomenon. Nevertheless, the liquid layers between the ice and the soil particles still exist. If the soil particle structure can be visualized as a three-dimensional skeleton or frame work, the ice can be thought of as a second skeleton interwoven with the first; the two do not touch each other but are everywhere separated by thin water films. The water films will be very thin in comparison with the thick ice “ ribs” occuring in coarse soils, and there will be no appreciable effect on the freezing point of the soil moisture in most cases.
The unfrozen water films become more and more significant with increasing soil fineness. The phenomenon can be understood from at least two viewpoints. From the first, the total surface area of the soil occupying a given volume quickly increases with increasing fineness, and the volume of surface water of lowered freezing point consequently multiplies also. Alternatively, it can be said that the dimensions of the soil voids decrease with those of the particles themselves; as the mineral walls therefore approach each other, a smaller and smaller proportion of the space between them is left to be filled by water freezing at the normal o°C .
When the particles have reached clay size, the water unaffected by the presence of mineral boundaries ordinarily will have disappeared altogether. The only water for which this observation does not hold true is that in the larger-scale openings such as cracks, worm-holes, and root canals. Since water can freeze in the larger openings before freezing in the microscopic soil voids is possible, it will begin to do so and will create a local dearth of water. Water migrates from the unfrozen soil mass to try to restore the equilibrium which had existed earlier, with two immediate results: first, the migrant water also freezes in the larger openings; and second, the soil from which the migration occurred is partly dried, so that the diminished quantity of remaining moisture w ill be yet more affected by the proximity of the mineral boundaries. The resultant continuous lowering of the freezing point will prevent the main mass of clay from ever freezing, under natural conditions at least.
The water in the macroscopic soil opening is not so restricted, and may begin to freeze at practically o°C . This can occur throughout the normally well- developed systems of cracks, etc., by propagation and/or spontaneous crystalli zation. Because clay usually hardens and cracks while shrinking during desicca tion, and also because the expanding ice masses can exert forces which may crack the clay, old openings tend to be widened and new openings formed. N ew centers for crystallization may thus be created during the process of frost penetration of clay.
The spring thaw is likely to find the ice content of such a soil well separated from the effects of mineral boundaries, by virtue of the migrations which will have taken place. The ice, then, will be quite normal, and will melt at o°C .
Traditionally, the “ frost line55 has been a more or less definite surface at which there is a marked change in the hardness of the soil layers. This basis of determination is superficially reasonable, but the occurrence of ice beyond the “ line55 shows it hazardous in the case of clays. Before the soil becomes, particularly hardened by the processes of ice segregation and clay desiccation, there is slow transition from the state where the first crystals appeared. The transition continues beyond any point which may be chosen as a “ frost line55, as long as lower soil temperatures continue to be encountered. The line chosen, then, is some point on a spectrum of soil hardnesses. There is every likelihood that it cannot be chosen consistently, and hence it may have different meanings for different persons, or in fact may have no definite mean ing for anyone (although it may still have a useful if indefinite meaning to the
construction industry). In addition, if the clay overlies a coarser soil with a real frost line or even just a hardening line at a lower level, there is then a question of having two “ frost lines” for a single frost advance. For these reasons, the term frost line should be applied only to the unmistakable o °C isotherm, or whatever other isotherm it may be at which the ground water can exist in equilibrium with ice in the free condition.
If the ground water is of a composition that will allow it to freeze at o °G in the absence of mineral boundary effects, the frost line as determined by means of the frost depth indicator will coincide with the actual soil frost line if the preferred definition is used. However, the frost depth indicator does not always indicate hardness of the ground, except in soils where the hardening process takes place at o°C .
Observations on the hardening zone in frozen soils were made in 1935 by
Beskow, who at the time followed the practice of calling this zone the “ frost
line” . As one might expect, Beskow found the temperature of this zone de pressed during the period of frost advance in fine soils. This is, of course, because the hardening process lags after the penetration of the o°line through the soil, and therefore occurs in sub-zero temperatures. Freezing of the pore water in fine soils cannot take place until there has been a migration to the centers of freezing in the larger openings, and this takes time if the soil is relatively impermeable, as the finer soils are. The lag is compounded if, at the same time, the frost advance is pushing ahead rapidly instead of waiting for the hardening processes to catch up. Beskow observed, “ . . . for coarse non frost-heaving soils the temperature for freezing and thawing is practically the same, and is very slightly less than o°C . For frost-heaving soils there is quite a difference between the frost line temperature during freezing and thawing: the receding frost line temperature is o °C or very slightly less, while the frost line temperature during freezing is considerably lowered, the more so the finer the soil is and the faster it freezes.”
To relate the o °C isotherm with the old concept of a line determined by strength changes, the values of Tables II and III can be cited. Table II shows temperatures which have been measured at “ frost lines” in various soils, while
T A B L E II (after G. Beskow)
Temperature of the H ardening Zone, Soil Type Taken as the Frost Line
— °C
Limits Average
Medium sand (“ damp” only, = 6°/o H2O) 0 .0 15—0.02 —
Moey moraine, Enebyberg, Stockholm 0.02 — 0.08 0.05 Fine mo, S. Sunderbyn, Norrbotten 0.15 — 0.2 —
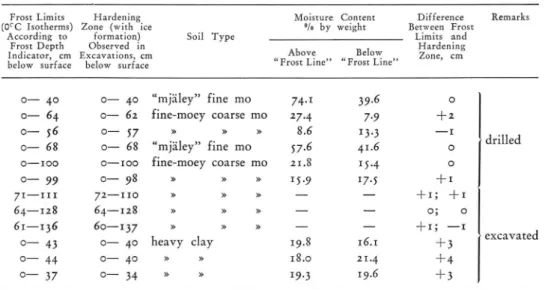
Frost Limits (0CC Isotherms) According to Frost Depth Indicator, cm below surface Hardening Zone (with ic formation) Observed in Excavations, cn below surface Soil Type 1 Moisture Content
% by weight Between Frost Difference Limits and
Hardening Zone, cm
Remarks Above
“ Frost Line” “ Frost Line”Below
o— 40 0— 40 “ mjäley” fine mo 74.I 39.6 O
0— 6 4 0— 62 fine-moey coarse mo 27.4
7*9
+ 2 0— 5 6 0— 68 0— 57 0— 68 “ mjäley” fine mo 8.6 57.6 41.613-3
— I O drilled 0— 100 0— 100 fine-moey coarse mo 21.8 15.4 O 0— 99 0— 98 » » » 15*9
17-5
+ 1 71 — i n 72— n o » » » — — + I J “h I 64— 128 64— 128 » » » — — OJ O 6 1— 136 0— 43 60— 1 3 7 0— 40 » » » heavy clay 19.8 16.1 + i ; “ I + 3 excavated 0— 44 0— 40 » » 18.0 21.4 + 4 0— 37 0— 34 » * I9-3
19.6 + 3Table I II shows the vertical difference in position between the o °C isotherm as measured by the frost depth indicator and several such “ lines” . Unfortunately, the two tables present information for different sets of test locations, and for Table II it is not known whether the frost was advancing at the time of observation. The seventh to ninth observations in Table III were made during the thaw. No very great depression of the temperature at the chosen lines, or difference in location between such lines and the corresponding o °C isotherms, has been found. The only significant depressions and differences have been observed in clays. The “ frost line” chosen by the field observers lay no more than 4 cm above the o °C isotherm in the cases shown. I f the frost had been advancing more quickly at the time of observation, however, this difference could have been greater.
Incidentally, from Table III it would appear that the probable error of the frost depth indicator in giving the position of the o °C isotherm is less than
± i cm, considering the difficulty of excavating exactly besides the instrument.
The quite apparent accuracy of the readings of the frost depth indicator is of little value if the instrumented location is not representative of the area of interest. The importance of preserving the natural conditions in the ground and in the snow cover has already been discussed. The natural variability of the soil and other conditions needs also to be considered in order that it does not upset the readings. Some soils, such as most moraines, are not at all homo geneous in composition and moisture content, even in cases where the ground surface over them seems regular. Apparently homogeneous sedimentary soils can have variable water contents from place to place, for a variety o f reasons. Furthermore, variations in the freezing exposure of the ground can exist from
place to place because of variations in snow and vegetation covers. A ll these factors can cause variations in the rate of frost penetration and hence in the depth of the frost line.
Frost depth indicators must therefore be suitably located, and employed in sufficient numbers to produce readings which will be correctly representative for the ground under study. I f interpolation or extrapolation of the frost boundary is attempted, the surface cover and ground structure must be con sidered.
Sphere of usefulness of the frost depth indicator
Several phenomena can be observed with the help of the frost depth indicator. Special points of time which are of interest are the moment of commencement of thawing and the moment when the last frost disappears. The position of the last remnant of frost in the ground is also interesting. In addition, the frost depth indicator makes evident the speed of penetration of the frost and the thaw, and the position and thickness at any time of the frozen and thawed layers. It is instructive to compare the rates of frost penetration in soils of differing structure or moisture content, and this can be done with the help of the frost indicator’s readings.
If observation of the instant when frost first enters the ground is hampered by undercooling, extrapolation of later-established readings back to the beginnings of frost penetration may be attempted. It is necessary in that case to keep in mind the weather before and during the early frost period. Frost penetration cannot begin without a preceding period when the ground surface first cools to the freezing point, and also cannot begin without mean air temperatures below freezing. For these reasons, ground frost cannot occur at the first sign of frosty air.
If many frost depth indicators are in use, one of them can usually be found starting to freeze early enough to make the undercooling problem a small one. As has been mentioned earlier, steps are being taken to reduce the problem still further.
The observations obtainable with the frost depth indicator can be put to use in studies of the following subjects:
1. Frost behaviour in roads, airfields, and other pavements; 2. Frost behaviour in fields and forests;
3. Permafrost behaviour;
4. Frost penetration in different soil types, and the effects of varying temper ature, snow cover, and other factors;
5. Danger of frost damage to buried installations;
6. The existence of ground frost at earthwork construction sites;
7. The variations of the frost depth over large geographical areas, both for any given time and for the moment of maximum penetration.
Literature References
1. Be r g a u, W . Tw o Methods for Measuring the Frozen Zone in Soil, (Method Bergau).
Proceedings of the Fourth International Conference on Soil Mechanics and Foun dation Engineering, London, August 1957. Butterworths Scientific Publications, 88 Kingsway, London, W. C. 2.
2. Neue Baumaschinen und Geräte, Frostindikator, Strasse und Autobahn, Februar 1954. Fleft 2.
3. Ku b l e r, Ge o r g. Die Anzeigegenauigkeit des Frostindikators, Ein Beitrag zum
Studium des Frostverlaufs im Boden, Strasse und Autobahn, Sept. 1954. H eft 9.
4. Be s k o w, Gu n n a r. Soil Freezing and Frost H eaving with Special Application to
Roads and Railroads, (trans. J. O. Österberg), The Swedish Geological Society, Series C, No. 375, 26th Year Book No. 3, pub. by The Technological Institute, Northwestern University, Evanston, Illinois, U .S.A . 1947. (Swedish original pub lished 1935.)
I N D E X O F P U B L I C A T I O N S F R O M
T HE N A T I O N A L S W E D I S H ROAD
R E S E A R C H I N S T I T U T E
M e d d e l a n d e n i — 62. Se Meddelande 9 1.63. Snabb bestämning av bitumenhalten i vägbeläggningar. Rapid Determination of the
Bitumen Content in Pavements, av H A r n fe lt ... 1942 64. Arbetsbeskrivning för byggnad och underhåll av slitlager av grus. Specifications
for G ravel Roads, utgivna av K . Väg- och V attenbyggnadsstyrelsen... 1942
65. Försök med pågrus. Tests with Chippings, av N v Matern och A H je l m é r ... 1943
66. Skador på betongvägar uppkomna genom saltbehandling vintertid. Damage on
Concrete Pavements by Wintertime Salt Treatment, av H A rn felt ... 1943 67. N ågra undersökningar av snöskärmar. Some Investigations as to Snow Fences, av
S H a llb e r g ...
1943
68. Undersökningar rörande konsistens hos betong. Investigations as to the Consistency of Concrete Mixtures, av N v Matern och N O demark ... 1944 69. Statens väginstituts provvägmaskin. The Road Machine of the State Road Institute,
av G K ullberg (utgånget) ... 1944 70. Ett långtidsprov på betongrör. Iakttagelser på en tioårig provledning i aggressivt
myrvatten. A Long-time Test on Concrete Pipes. Observations on a Ten Years Old Pipe-line in Aggressive M oorland Water, av H j G r a n h o lm ... 1944 7 1. Sambandet mellan viskositet och temperatur för bituminösa bindemedel i grafisk
framställning. Graphical Representation of Viscosity of Bituminous Substances as a Function of Temperature, av S H a llb e r g ... 1945 72. Statens väginstituts inventeringar av naturliga vägmaterialförekomster (»Grusin
venteringar») 19 3 3 — 1944. Investigations into N atural Deposits of G ravel and other Material for Roads in Sweden 19 33— 1944, av F Rengm ark ... 1945 73. Undersökning av avnötning hos smågatsten i provvägmaskinen år 1945. Investi
gations into the Wear of Sett Pavings carried out with the Road Machine in 1945, av O Gabrielson ... I 947 74. Köldsprickor i gjutasfalt. Cracks in Mastic Pavements due to low Temperatures,
av S H allberg och N Lindholm ... 1947 75. Tjärbeläggningar på Spångavägen 1946. Tests with T ar Pavements on the Spånga-
vägen near Stockholm 1946, av O M a r t in ... 1949 76. Distillation Analysis of Road Tars.
Metoder för destillationsanalys av vägtjäror, av S H allberg och H A r n f e l t ... 1 949
77. Undersökning av elasticitetsegenskaperna hos olika jordarter samt teori för beräk ning av beläggningar enligt elasticitetsteorin. Investigations as to the Elastic P ro perties of Soils and Design of Pavements according to the Theory of Elasticity, av
N O d e m a r k ... 1949 78. Vidhäftningen mellan bituminösa bindemedel och sten i närvaro av vatten. The
Adhesion of Bituminous Binders and Aggregates in the Presence of Water, av
S H allberg ... 1950 79. D ifferential Thermal Analyses of some Quaternary Clays of Fennoscandia, by
U Soveri ... 19 5 1 80. P rovväg med ytbehandlingar på D alarövägen 1948. Test Road with Surface T reat
ments on the D alarö Road near Stockholm 1948, av S G yllsjö ... 19 5 1 81. Amerikansk och svensk jordklassifikation speciellt för vägar och flygfält. American
and Swedish Soil Classification. Especially for Piighways and Airfields, G Beskow 19 5 1 82. Asfalters deformation och hållfasthet vid långsam och snabb belastning. D eform a
tion and strength of asphalts at slow and rapid loading, av R E r ik s s o n ... 19 5 1 83. Provvägen på Ekerö 1948. The Test Road at Ekerö 1948, av B Örbom ... 1952
84* En metod att på arbetsplatsen kontrollera bindemedelshalten i en bituminös be-läggningsmassa genom bestämning av massans specifika vikt. A Field Method for the Control of the Binder Content of a Bituminous M ix by Specific G ra vity Measure ments, av S H a llb e r g ...
19
S3
85. D ragprov på sandasfalt. Tension Tests on Sheet-Asphalt, av R Eriksson . . .^... 1954 86. Hyvelblandningsförsök med vidhäftningsmedel vid Aneby 1952. R oad M ix Testswith Antistripping Agents at Aneby 1952, av R Eriksson .
1954
87. Om komprimering av jord. A study of the Compaction of Soil, av N G Bruzeliusm. fl. ( Utgånget) ...o- ... • •• I
9
S4
88. Provvägen Hälsingborg— Viken— Höganäs efter 20 år. The Test Road at H älsingborg after 20 years, av S H allberg och R E r ik s s o n . ... ... 19 5
5
89. Fett- och hartsaminer som tillsatser till bituminösa bindemedel. Investigation of someFatty and Rosin Amines as A dditives to Bituminous Binders, av A Z v e jn ic k s 1956 90. Försök med oljegrusvägar. Test with Oiled Gravel Roads, av S H a ll b e r g . 19 5 ^ 9 1. Köldmängdskartor över Sverige. Maps of freezing indexes for Sweden, av B Fellenius
och F R e n g m a r k ...
I959
R apporter
1 — 22. Se rapport 34.
23. Försök med en beläggningssladd. A Multiple-blade-drag for Bituminous Retread Work, av S H allberg ... 1953 24. Some Research on Bituminous Materials at the Road Research Laboratory, Great
Britain. N ågra undersökningar av bituminösa material, utförda vid Road Research Laboratory i England, av A R Lee ... 1953 25. Vidhäftningen mellan bituminösa bindemedel och stenmaterial och dess betydelse för
vägbeläggningar. A short Treatise on the Adhesion of Bituminous Binders and Aggre gates and its Importance to Road Pavements, av S H a llb e r g ... 1953 26. Undersökning av inverkan på asfaltbelagda banor av högt lufttryck i flygp lan
ringar. Influence of H igh Tire Inflation Pressure on Runw ay Asphalt Pavements 1954 27. N ågra problem rörande fri sikt i vägkurvor. Some Problems Concerning Sight
Distance on H ighw ay Curves, av N v Matern och L -O Alm (U tg å n g e n )... 1954 28. Studier och försök med sandning och saltning på vinterväglag, utförda åren 19 5 3—
1956 av statens väginstitut. Sand and Salt Treatments of Snow-Covered and Icy Roads. Tests Carried Out by the State Road Institute of Sweden during the years of 19 53— 1956 ... 1956 29. K ort redogörelse för oljebehandling av grusvägar. A Brief Account of Oil Treatment
of Gravel Roads, av S H a ll b e r g ... 1957 30. Bestämning av tjälgräns i mark med enkel typ av tjälgränsmätare. A Frost Depth
Indicator, av R G a n d a h l... 1957 30 A. Determination of the Ground Frost Line by Means of a Simple T ype of Frost
Depth Indicator, by R G andahl ... 1963 3 1. Försök med bestrykning och lagning av ytskadad betongväg vid H ällekis. Exp eri
ments with Protective Coatings and with Methods of Repairing a Scaled Concrete Road at Hällekis, av N O dem ark och S Engman ... 19 57 32. Procentvåg för siktanalys i fält. Per Cent Balance for Sieving Analysis in the Field 1958 33. Ytskador på svenska betongvägar 19 55— 1957. Extent of Concrete Road Pavement
Scaling in Sweden 1955— 1957, av N Odemark och S E n g m a n ... 1958 34. Berättelse över statens väginstituts verksamhet under budgetåret 1958— 1959 ... 1959 35. Axeltrycksm ätningar. A xle Load Measurements, av S Edholm ... i960 36. Undersökning av vinterdäck och slirskydd ur friktionssynpunkt. Investigation of
Friction Properties of W inter T yres and Anti-Skid Devices, av G K u llberg och
B Kihlgren ... i960 37. Berättelse över statens väginstituts verksamhet under budgetåret 1959— 1 9 6 0 ... i960 37 A. Annual Report of the N ational Swedish Road Research Institute (Statens vägin
stitut) for the Financial Y e a r 1959— 1960 ... 19^° 38. Undersökningar rörande snöplogar. Snow Plough Investigations, av B K ihlgren . . . . 1961 39. Betongvägars friktionsegenskaper. Frictional Properties of Concrete Roads, av
40. Berättelse över statens väginstituts verksamhet under budgetåret 1960— 1961 ... 1961
40 A . Annual Report of the N ational Swedish Road Research Institute (Statens väg-institut) for the Financial Y ear i960— 1961 ... 1962
4 1. Berättelse över statens väginstituts verksamhet under budgetåret 19 61 — 1962 . . . . 1962
41 A . Annual Report of the National Swedish Road Research Institute (Statens väg-institut) for the Financial Y ear 1961 — 1962 ... 1963
42. Provning av sandspridare. Tests on Sand Spreaders, av B K ihlgren ... 1963
Specialrapporter Statens väginstituts specialrapporter fram lägger forskningsresultat m m, som antingen är av intresse endast fö r en begränsad läsekrets eller är av preliminär natur. Innehållet bör ej publi ceras utan särskilt tillstånd. Specialrapporterna utges endast i mycket begränsat antal. Kopiering av utgångna specialrapporter betalas av beställaren. 1. Undersökning ang hastigheten hos motortrafiken på vägarna ... 1953
2. Experim ental Study of T raffic on Tw o Lane Roads, av G Kullberg och S Edholm 1954 2. Supplement 1 — 4. Experim ental Study of T raffic on Tw o Lane Roads, av G K u ll berg och S E d h o lm ... 1955
3. Försök på provvägar 1953 och 1 9 5 4 ... 1955
4. Vägräckesförsök utförda är 1954 ... 1955
4. Supplement 1. Vägräckesförsök utförda år 1955 ... 1956
4. Supplement 2. Vägräckesförsök utfört år 1957 ... I 95^ 5. M otorfordonstrafikens sidolägesfördelning på tvåfiliga vägar. I. V ägar med gräs- och grusvägren, av G Kullberg och S E d h o lm ... 1956
6. Om vägens konstruktion vid höga hjultryck. Construction of Roads fo r H igh Wheel Loads ... 1956
7. Trafikhastighetsstudier i Skillingaryd 1955 ... 1956
8. Försök på provvägar 1955 och 1956. Oljebehandling av grusvägar ... I 957 9. Försök med cementstabiliserat bärlager på Nynäsvägen 1955, av L J a n s o n ... 1957
10. Försök på provvägar 1957 ... I 957 1 1 . Provningsmetoder för material till bituminösa vägbeläggningar ... 1959
Reviderad upplaga ... 1961
12. Försök med beläggningar av cementbetong på riksväg 1 vid Törnevalla 1953. Försök med cementstabiliserat bärlager på Södertäljevägen 1956, av B L i l j a ... 1959
13. Försökssträckor med oljegrus 1958 och 1959. Försökssträckor med vidhäftningsmedel vid underhållsytbehandling 1959 ... i960
14. Förhandlingar i Stockholm den 15 och 16 juni 1959 med utskottet för bituminösa bindemedel och beläggningar inom Nordiska vägtekniska förbundet. Conference, held in Stockholm on the 15th and 16th of June 1959 with the Delegation fo r Bituminous Binders and Surface of the Scandinavian Road Engineers’ Association ... i960
15. Försök med bituminösa blandningsbeläggningar på Bergslagsvägen i Stockholm 1957 och 1958. Road surfacing trials with asphaltic concrete on the Bergslagsvägen in Stockholm in 1957 and 1958, av B L i l j a ... i960
16. Försök till praktisk definition av begreppet framkomlighet, av S G r u n d e n ... 1961
17. Methods of T raffic Measurement. Determination of Number and Weight of Vehicles, av S E d h o l m ... 1962
18. Försökssträckor med oljegrus i960— 1961 ... 1962