V¨
aster˚
as, Sweden
Thesis for the Degree of Master of Science in Engineering - Robotics
30.0 credits
HUMAN-ROBOT INTERACTION
USING REINFORCEMENT
LEARNING AND CONVOLUTIONAL
NEURAL NETWORK
Edier Otalvaro & Yousuf Khan
eoz15001@student.mdh.se, ykn15001@student.mdh.se
Examiner: Baran C¨
ur¨
ukl¨
u
M¨
alardalen University, V¨
aster˚
as, Sweden
Supervisors: Elaine ˚
Astrand
Miguel Le´
on Ortiz
Mirgita Frasheri
M¨
alardalen University, V¨
aster˚
as, Sweden
Abstract
Proper interaction is a crucial aspect of team collaborations for successfully achieving a common goal. In recent times, more technically advanced robots have been introduced into the industrial environments sharing the same workspace as other robots and humans which causes the need for human-robot interaction (HRI) to be greater than ever before. The purpose of this study is to enable a HRI by teaching a robot to classify different human facial expressions as either positive or negative using a convolutional neural network and respond to each of them with the help of the reinforcement learning algorithm Q-learning. The simulation showed that the robot could accurately classify and react to the facial expressions under the instructions given by the Q-learning algorithm. The simulated results proved to be consistent in every conducted experiment having low variances. These results are promising for future research to allow for the study to be conducted in real-life environments.
List of Acronyms
AI Artificial intelligence ANN Artificial neural network
API Application Programming Interface ASM Active shape model
A3C Asynchronous Advantage Actor-critic CK+ Extended Cohn-Kanade
CNN Convolutional neural network DAE Deep autoencoders
DB Database
DBN Deep belief networks
DCF Discriminative complete features DDPG Deep deterministic policy gradient DNN Deep neural network
DQN Deep Q-Learning
DRL Deep reinforcement learning ER Emotion reward
FACS Facial action coding system FER Facial expression recognition GAN Generative adversarial networks
GICA Grounded intersubjective concept analysis GPGPU General purpose graphics processing unit HCI Human-computer interaction
HID Human interface device HMI Human-machine interaction HRI Human-robot interaction ML Machine learning
MLP Multilayer perceptron NLP Natural language processing RAF Real-world affective
RBM Restricted Boltzmann Machine ReLU Rectified Linear Unit
RL Reinforcement learning RNN Recurrent neural networks
ROS Robot Operating System
SARSA State-action-reward-state-action UI User interface
Table of Contents
1 Introduction 1
2 Background 3
2.1 Reinforcement Learning . . . 3
2.1.1 Q-learning . . . 4
2.2 Artificial Neural Networks . . . 4
2.2.1 Convolutional neural networks . . . 7
2.3 Human–robot interaction . . . 10
3 Related Work 11 3.1 Emotion Recognition . . . 11
3.2 Neural networks for facial detection . . . 11
3.3 Reinforcement Learning in robotics . . . 12
4 Problem Formulation 13 4.1 Hypothesis . . . 13
4.2 Research questions . . . 13
5 Method 14 5.1 Data acquisition using convolutional neural network . . . 14
5.2 Applying Q-learning for agent training . . . 15
5.3 Robotic platform . . . 15
5.4 Validation . . . 16
6 Limitations 16 6.1 Effect of the COVID-19 pandemic on the thesis work . . . 16
7 Implementation 17 7.1 Facial expression detection using CNN . . . 17
7.2 Image Datasets for facial expression recognition . . . 17
7.2.1 The Extended Cohn-Kanade Dataset (CK+ Dataset) . . . 17
7.2.2 CK-CNN . . . 18
7.2.3 Real-world Affective Face Database (RAF-Database) . . . 19
7.2.4 Haar-Cascade for Face Detection . . . 19
7.2.5 RAF-CNN . . . 19
7.3 Q-learning algorithm applied for robot manoeuvring . . . 20
7.4 Performance simulation using the Gazebo simulator . . . 22
8 Results 27 8.1 CNN . . . 27 8.2 Q-learning . . . 28 8.3 Experiments . . . 29 9 Discussion 37 9.1 CNN results . . . 37 9.2 Q-learning results . . . 37
9.3 Gazebo simulation results . . . 37
9.3.1 The overall performance of the robot . . . 38
9.3.2 Distances of facial detection experiment using the Haar-Cascade algorithm 38 9.3.3 Second experiment . . . 38
9.3.4 Third experiment . . . 39
9.3.5 Fourth experiment . . . 39
9.4 Goals and research questions . . . 39
11 Future work 41 11.1 Convolutional Neural Network . . . 41 11.2 Q-Learning . . . 41 11.3 Simulation . . . 41
1
Introduction
Robots are an essential asset in today’s world, and with the expansion and progress of automation, the demand for more robots continues to rise on the market. Robots come in different shapes, forms and capacities but some of their benefits include their superiority aspects such as strength and computational power which enables them to complement humans in tasks requiring high preci-sion and performance, e.g. welding, assemblage, heavy calculations etc. They can save people from performing a dangerous job, work under challenging conditions such as with toxic chemicals and in tight spaces. However, frequently, these advantages come with a cost, i.e. little to no interaction or adaption of the robots to the humans in its surroundings. Since robots are nowadays becoming more sophisticated and are used for a variety of purposes, the need for interactive skills are neces-sary for many applicational fields in which the robots share the same objectives and workspace as other robots or human [1]
Human-robot interaction (HRI) is a field of study focusing on understanding and designing robotic systems used by or with humans [2]. Its objective is to shape the interactions between humans and robots and serves as an understanding for collaboration between the two parties working in a team, being able to assist each other by exchanging information to achieve a common goal [3]. However, HRI mainly features human-centred experiences and makes humans the core and focus of attention.
A study conducted by Hoffman et al. [4] shows that subtle changes in the robot’s behaviour had a positive effect on the humans in their surroundings. The robot communicates non-verbally ei-ther explicitly, i.e. using gestural social cues such as nodding, or implicitly through behaviour, e.g. making eye contact with the human, moving its gaze to indicate what currently interest the robot, its focus of attention, visual awareness etc. These implicit non-verbal cues made the robot more transparent and predictable and could thus be engaged by the humans accordingly in order to achieve the desired results. The humans could also more easily coordinate their own actions with those of the robot. By providing these implicit non-verbal cues, the human got a better understanding of the robot’s internal state and could use it to improve robustness and teamwork efficiency in performing tasks. As a result, these types of robots turned out to be better team members and have a greater positive contribution to the joint activity compared to the more non-expressive traditional robots who had participants telling them what to do. The authors in [4] proceeds to describe the human’s perspective and outline the importance of implicit non-verbal communication in human-robot teams as it conveys why the robot behaves as it does and how it can give us a deeper understanding of the potentials of HRI.
Robots being able to navigate and identify the likes, dislikes and apparent intention of human colleagues benefits mutual adaption and understanding of each other. Since the robots do not have the natural ability to make quick judgements of personalities of the people in the surroundings and change their behaviour accordingly, they must be taught these qualities. Artificial intelligence (AI), and particularly Reinforcement Learning (RL), have shown great promise in this aspect [5]. Reinforcement learning allows the robot to learn independently how to respond to its surroundings and how its surroundings react to the actions taken by the robot by continuously giving feedback about its performance [6]. It allows the robot to adapt and perform in unpredictable and dynamic environments [7].
This thesis will focus on how a RL algorithm can be implemented to enable and initiate a HRI by teaching a robot how to act and respond to human facial expressions using machine learning. The input will be received using a camera attached to the robot, and it will be passed on to a convolutional neural network (CNN) which will identify and categorise human facial expressions. The CNN output will be fed to the RL algorithm which will manipulate the robot’s actuators. Nowadays, more industries aims to slowly replace human labour with automation and thus adopts more robots which causes an increase of human-robot environments making cooperation between the two parties a fundamental part for successful industrial growth. Therefore, the ultimate goal of this work serves as an initial stage of interaction between the two by having the robot differentiate between positive and negative facial expressions and learn how to adapt to it using simple naviga-tion. Notably, by approaching the detected human if the person expresses positivity, or distancing itself from the detected human if the robot detects negativity such as anger and frowning.
The rest of the report is organised as follows. Section 2 provides background on the main topics relevant to our work. Section 3 consists of related work that has previously been done in this field of study. Section 4 looks at the description of the problem in detail and defines the research questions. Section 5 describes the method and methodology, the proposed approach and research tools. Section 6 discusses some limitations which had an impact on the thesis work. Section 7 describes and goes through the different implementations and set-ups. Section 8 presents the obtained results. Concluding remarks and discussion can be found in Section 9 and Section 10. Finally, Section 11 takes a brief overview of future work and how to proceed.
2
Background
In this section of the thesis work, the distinct theoretical backgrounds for the implemented algo-rithms and methods are to be presented to provide an advanced perception of the report.
2.1
Reinforcement Learning
Reinforcement learning (RL) is one of the areas of AI research. RL methods do not use explicit instructions for learning. Instead, rewards and punishment guide the teaching. Different algorithms are used in this field such as Monte Carlo, Q-learning, State-action-reward-state-action (SARSA), Deep Q-Learning (DQN), Deep deterministic policy gradient (DDPG), Asynchronous advantage actor-critic (A3C) [8,9]. Arranging a simulation environment relative to the task to be performed is a challenge in RL. To implement the model in a real-world environment results to be different as it highly differs from the training environment.
There are two types of reinforcement positive and negative. Positive reinforcement is when an event takes place because of a specific action which raises the frequency and strength of the behaviour, causing a positive effect on the act. Negative reinforcement is the behaviour that is strengthened due to an adverse condition being avoided [10]. As in other areas of AI, there are several known drawbacks to these methods [11] such as a) reward design should be involved, b) parameters may affect the speed of learning, c) realistic environments can have partial observability, d) too much reinforcement may lead to an overload of states which can diminish the results. There are two main strategies to solve the previously mentioned problems [11]:
1. Search in the space of behaviours, so it finds one that performs well in the environment. 2. Statistical techniques and dynamic programming methods used to estimate the utility of
taking actions in states of the world.
The aim for the reinforcement learning algorithm and the agent is to perform actions in the assigned situation to augment the aggregated reward, as illustrated in Figure 1.
Agent Environment Action At Reward Rt State St Rt+1 St+1
Figure 1: Reinforcement learning model with its fundamental elements; agent, environment and reward action.
The agent is the learner and the one who makes the decisions based on punishments and rewards [12] [13]. The physical world where the agent operates is called the environment. An agent and the environment interact with each other in a discrete-time steps t. The environment sends the agent representation of its conditions (S, set of possible states), and on that basis selects an action A. This environment gives feedback called rewards (R) that are unique numerical values that can be maximised by the agent during the time. One instance of a reinforcement learning problem is the task which is a complete specification of an environment. In other words, the procedure of RL contains the following steps:
1. Inspection of the environment. 2. Determine Action.
3. Perform Action.
4. Obtain a reward or punishment.
5. Learn from the gathered experience and improve action-taking. 6. Repeat until achieving adequate knowledge.
2.1.1 Q-learning
Q-learning is a value-based model-free reinforcement learning algorithm which uses Q-values to improve the behaviour of a learning agent to attain the optimal policy. It applies to any environ-ment, and it is an explicit trial-and-error algorithm. The Q-values are defined for states and action as Q (S,A) and is an estimation of how good it is to take the action A given the state S. The goal is to update the Q-values in such a way that running through a chain of operations will produce an optimal result, which can be achieved by rewarding the agent as it goes through the environment. The reward for a long-term goal is given preeminence rather than immediate short-term actions. The courses of actions will over time teach the robot ”the correct behaviour” to maximise the obtainable reward.
A Q-table helps the agent to find the best action for each state and any given combination of states can be looked up within the Q-table. It helps to maximise the expected reward by selecting the best of all possible actions and returns the expected future remuneration of the specific action at the particular state. Wherever the agent finds itself, it is going to look for the highest Q-value for the particular combination (e.g. position and velocity) in the table and then perform that action. Initially, the agent is going to explore the environment by picking random values. The Q-table will gradually be updated as the exploration proceeds. Over time as the agent picks these values and eventually reaches a reward, then using the Q-function (Equation 1), it will slowly back-propagate that reward to make for higher Q-values for the actions that when chained together lead to that reward [14].
To improve the action-taking and to learn from the experiences, Equation 1 is necessary to update the learning process continuously until it is concluded.
Qnew(s, a) = Q(s, a) + α[R(s, a) + Υ max(Q0(s0, a0)) − Q(s, a)] (1) Where α, is the learning rate which simply determines to what extent newly acquired information overrides old information and can take any value between 0 and 1. Υ is the discount factor which determines the importance of future reward. R(s,a) is the reward for taking an action in a state, max(Q’(s’,a’)) is the maximum expected future reward and Q(s,a) is the current Q (Q learning method) values.
2.2
Artificial Neural Networks
Machine learning is a part of artificial intelligence (AI) which enables a system to have the ability to learn automatically and make decisions without human intervention. The aim is to develop computer programs that learn by themselves by accessing data. Furthermore, the learning process can be in different ways, such as instructions or direct experiences to learn by memorising from the examples that are given and decide better in the future. The core of machine learning is deep learning which is a learning algorithm that is inspired by the human nervous system and brain structure [11].
An artificial neural network (ANN) is a machine learning (ML) technique. It contains several processing units and organised layers that are divided into input, hidden and output [11]. The units of each layer and the nodes of the nearby level are connected. The connections have weight values that are multiplied by the respective weight of each link and summarised in each unit. The sum undergoes a transformation based on the activation function, which, in most cases, is a sigmoid, hyperbolic, or Rectified Linear Unit (ReLU) function [11].
The implementation of neural networks is concluded by following these steps [11]: 1. Acquire training and testing data-sets
2. Train the network
3. Classify the test data (unseen data).
Acquiring data is the first step in implementing a neural network. Data is collected and split to start the training, generally, into three parts, training data, validation data and testing data, usually 60%, 30% and 10% respectively. The second step is to train the network, which can be achieved in three ways supervised, unsupervised and semi-supervised learning. Supervised learning contains labelled data, which means it learns by responses. In unsupervised learning, there is no learning by estimation, and neural networks are competent because they apply generating models such as Restricted Boltzmann Machine (RBM). Semi-supervised learning is the integration of supervised learning with unsupervised learning (with unlabelled data). Additionally, to verify that the model behaves appropriately with unknown data, the test set is used.
Neural Network models can be separated into two distinct groups, discriminative and generative[11]. A discriminative model is a bottom-up procedure where data passes from the input layer to the output layer through hidden layers. These procedures are considered when handling supervised training problems like classification and regression. Discriminative approaches are generally im-plemented when labelled data is available and typically give a good predictive performance. Fur-thermore, a discriminative model learns the conditional probability distribution p(y|x), given the input x and the label y. Conversely, generative models are top-down, and data goes in the oppo-site direction. They are used for problems related to unsupervised pre-training and probabilistic distribution [11]. Generative processes are customarily used when labelled data is not available. These models, on the other hand, learn the joint probability of p(x, y) to conclude P (x|y) [15].
Figure 2: The general pipeline of deep facial expression recognition systems- Based on Deep Facial Expression Recognition: A Survey by Shan Li and Weihong Deng, October 2018
Pre-processing is the step before training deep neural networks, visual semantic information of the face is aligned and normalised in this phase, see Figure 2. The first step is the facial alignment that detects the face and removes the background and areas where a face is not present. The reduction of variation in face scale and in-plane rotation is essential. The second step is data augmentation, and it is composed of two groups: on the fly data augmentation, which is used to reduce over-fitting, and offline data augmentation which is used to expand data on size and diversity. The on the fly data augmentation includes action like cropping the input sample from the four corners, centralising the image and flipping it horizontally. The offline data augmentation has different operations such as skew, rotation, scaling, contrast, shifting and colour jittering. The third step is face normalisation which has two methods, illumination normalisation and poses normalisation (frontalisation), that will improve variations in illumination and head poses that introduce massive changes in images. Face normalisation is followed by illumination normalisation that is based on the improvement of lighting and contrast that can differ in different pictures, which can cause large intra-class variances. A common problem in pose normalisation is the considerable pose variation in unconstrained settings. After locating facial landmarks, it generates a 3D texture reference model to improve the visibility of facial components.
Figure 3: The general pipeline of deep facial expression recognition systems- Based on Deep Facial Expression Recognition: A Survey by Shan Li and Weihong Deng, October 2018
In Figure 3, traditional architectures of deep networks for feature learning are presented such as Convolutional neural networks (CNN), Deep belief networks (DBN), Deep autoencoders (DAE), Recurrent neural networks (RNN), Generative Adversarial Networks (GAN). CNNs are typically used for computer vision, and image recognition, and they broadly consist of the following layers: convolutional layers, pooling layers, and fully connected layers [16]. DBNs [17] are models that learn to extract a deep hierarchical representation of the training data. DAEs [18] are used to learn logical codings for dimensionality reduction. RNNs are based on using computers to model how brains process and retain information by capturing temporal information and is frequently used for sequential data prediction [19]. GANs [20] train models by utilising a minimax two-player game between a generator G(z) (that generates input data by mapping latent z to data space with z ∼ p(z)), and a discriminator D(x) that assigns probability y = Dis(x) ∈ [0; 1], where x is an actual training sample to tell apart real from fake input data.
2.2.1 Convolutional neural networks
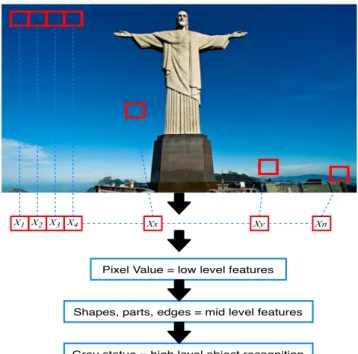
A convolutional neural network (CNN) is based on the human visual cortex and is often the neural network of choice for computer vision (image recognition) and video recognition [21, 16]. CNNs focus on the fact that the input will be an incorporation of images. It makes the architecture easy to compose so it can be adapted to the requirements in how to deal with specific data [21,22]. A CNN generally consists of convolutional layers, pooling layers, dropout layers and fully connected layers. The layers of a CNN contain neurons sorted into three dimensions: the spatial dimensionality of the input (height and width) and the depth. The depth refers to the third dimension of an activation volume [23, 12]. This activation is a node placed at the end of or in between Neural Networks, and it has a volume of width, height, depth. Figure 4 shows how a CNN can learn hierarchical levels of representations from a low-level input vector, and then to identify a higher-level object [11]. The red squares are an overall generalisation of the pixel values of the highlighted section of the picture. CNNs can gradually get a higher representation of a figure after each layer, and at the end, the image can be recognised.
X1 X2 X3 X4 Xx Xy Xn
Pixel Value = low level features
Shapes, parts, edges = mid level features
Gray statue = high level object recognition
Convolutional layers
A convolutional layer is an essential component of a CNN architecture. Convolutional layers are the most significant building blocks applied in CNNs. This layer can be defined as the function of a filter in an input that will result in activation. When this implementation is repeated, the information will appear in a map of activations which is called a feature map. A detected feature in an input specifies the locations and strength. The advantage of having this layer is to learn a high number of parallel filters automatically, in a training data-set that is being limited to a specific modelling problem like the image classification [24]. The convolutional layer can be described as the component that executes the feature extraction. It includes a mix of linear and non-linear operations, such as convolution operations and activation functions [25].
Furthermore, the parameters of a convolutional layer consist of a set of learnable filters. Each filter is small spatially along its width and height. The filter extends as a cause of the full depth of the input volume. A typical filter on the first layer of a convolutional network might have size 5x5x3 (i.e. 5 pixels width and height, and three because of the colour channels). As the forwarding happens, every filter slides over the width and height of the input. Along the process, the dot products in the middle of the filter’s entries and input are calculated. The slide of the filter generates a two-dimensional activation map that will give the response of the filter in every input. Convolutional layers allow a volume of size W1× H1× D1and require four hyperparameters such
as the number of filters K, their spatial extent F, the stride S, and the amount of zero padding P [25]. It produces a volume of size W2× H2× D2, where [24]:
W2= (W 1+2P −F S + 1 if S > 0, W1+ 2P − F if S = 0, (2) H2= (H 1+2P −F S + 1 if S > 0, H1+ 2P − F if S = 0. (3) D2= D1 (4) Pooling layers
A pooling layer is a typical under-sample activity which diminishes the in-plane dimensionality of the feature maps. It is done to present a change in the invariance with little moves and bends and helps in minimising the number of learnable parameters [25]. In other words, the main aim of this layer is to gain a spatial constant by reducing the resolution of feature maps. Every pooled feature map takes into consideration the feature map of the previous layer. There are two commonly used pooling operations: max pooling and sub-sampling. The pooling window can be of arbitrary size and in some cases, can be overlapping [26]. Max pooling concentrates patches from the input of feature maps and outputs the most significant value in each patch. A filter of size 2x2 with a stride of 2 is frequently used.
The primary function of pooling layers is to reduce computational time and the number of param-eters. This layer operates independently on every depth slice of the input and resizes it spatially by using the MAX operation. For instance, a small 2x2 region in the depth slice will take a max function over four numbers. The depth dimension remains unaffected in this layer. Pooling layers allow only these qualities: volume size where W1× H1× D1. The hyperparameters requested are,
spatial extent F and stride S. The produced volume size is W2× H2× D2. From the latter, the
components have the following values.
W2= (W 1−F S + 1 if S > 0, W1− F if S = 0, (5) H2= (H 1−F S + 1 if S > 0, H1− F if S = 0. (6) D2= D1 (7)
By adding a fixed function of inputs, zero parameters will be presented. The input normally does not have zero-padding in this layer.
Fully connected layers
The feature maps after the convolution and pooling layer are turned in a one-dimensional array of vectors. The vectors are then linked to dense layers (fully connected layers). Dense layers’ role is to connect inputs to all the outputs with a learnable weight. The next step is for the features from the previews layers to be mapped from a subset of fully connected layers to get the results of the network. In the end, this layer continues with a non-linear function, such as ReLu (rectified linear unit)[25]. The input dimension is the one who determines the size of the output. This layer has some issues; one of the biggest problems is having a vast number of parameters when classifying images. Fully connected layers need 12288 weights in the first layer for pictures that have the size 64x64x3. However, for larger images, such as 225x225x3 the number of values will escalate to 151875, causing slower training time, and the model will fit with great precision a particular set of data points while failing to work with unseen data (over-fitting). A fully connected layer is considered as a finite number of neurons that takes a vector as an input and returns another one. The following equation represents fully connected layers:
zl≡ wlal−1+ bl (8)
Where zl is the weighted input to the neurons in layer l that is equal to the weight wl in
the layer l multiplied by activations in the (l − 1)th layer summed with the bias vector bl. The
activation vector alis equal to the function of zl.
al= σ(zl) (9)
To conclude, the fully connected layer equation is essential to note that zl has components
zlj= Σkwljka l−1 k + b l j (10) zl
j is the weighted input to the activation function for neuron j in layer l.
The features of the equation are : • w - weights
• l - a layer of neurons • b - bias vector • a - activation vector
• k is used to refer to the input neuron and j to the output neuron. The sum is over all neurons k in the (l − 1)thlayer where wl
jk is the weight from the kthneuron
in the (l − 1)th layer to the jthneuron in the lthlayer. wjkl multiplied by the activation vector al with components such as the activations al
k (of the kth neuron in the lthlayer) that is related to
the (l − 1)th layer. Same way as for the weights, for each layer l we define a bias vector, bl. The
components of the bias vector are the values bl
j, (of the jthneuron in the lthlayer) one component
for each neuron in the lthlayer.
Dropout layers
The dropout layer turns off components of a neural network to prevent over-fitting. A fully connected layer constitutes the majority of the parameters; as a consequence, neurons develop in co-dependency with each other. That will produce power for all neurons individually, and this conduct to over-fitting of the training data. Dropout can be seen as a way to provide a model averaging in which the number of trained models is exponential in that of the units [27].
2.3
Human–robot interaction
As robots are found among humans in everyday life, for example, robot toys, robotic vacuum clean-ers or lawnmowclean-ers, the development of robots has deviated and presently also aims for real-world application areas (robots in elderccare, or rehabilitation, or educational applications). The field of HRI is broad and researchers working on the development of advanced robotic systems with possible applications in real-world, have to understand the interaction of humans with robots to increment the robots’ efficiency. The concept of what a robot is has changed through the years, which makes the interaction with robots and gathering more knowledge for HRI a challenge. If the focus is put only in the human perspective, the robot component loses the importance. For the same reason, it is essential to combine both aspects, to emphasise the interaction that results when people and interactive robots are put together [28].
Based on [29,30, 31] human-robot interaction (HRI) can be identified as a well-coordinated col-laboration of a human and robot that need complex sensor-motor control capabilities. As seen in Figure 5, the HRI can be considered as a three-station cycle. The Human Interface Device (HID) includes computer mouse, keyboard, gamepads, knobs and sliders, motion tracking with optical markers or electromagnetic fields, eye tracking, voice control and gesture control via visual object recognition, touchpads and touchscreens, joysticks. A robot is made up of several sensors that understand the spatial relationships between the computer and some objects that are external influencers. These sensors can be radar cameras, electromagnetic sensors, accelerators, passive or active stereoscopic (infrared), motion capture systems, active and passive sonar. A human operator can manually control a robot through an HID. This device modifies the location and orientation of the robot. Automotive sensors can detect this modification, and the data received from the sensors are processed, interpreted and then communicated to the operator through the user interface (UI), which are merely visual displays. Human-computer interaction (HCI) is the illustration of a broad field of research and application. HCI includes areas such as user interface design and tasks related to user modelling, system adaptation, and optimisation suitable for the user’s needs.
UI
communicates SR via
Sensor
modifies SR sensed by
HID
enables action via
3
Related Work
The proposed human-robot interaction method is based on the fact that if machines were able to interpret the user’s facial expression correctly, by adapting to the human, the latter can be more accepting, or could respond better to the interaction with a robot, thus leading to potentially more efficient interaction. Nevertheless, the field of emotion recognition is an area that does not have abundant studies in comparison with the field for neural networks for facial detection and reinforcement learning in robotics where there is a considerable variety of studies that have been conducted during the last years. Thus, making it hard to compare to a wide range of researches. The studies presented in this section will target different methods for facial expression recognition, how neural networks can solve problems related to facial recognition and lastly how reinforcement learning algorithms can resolve robotics questions.
3.1
Emotion Recognition
Recognising facial expressions can be approached in different forms. One of them is the way K. S. Hwang et al. [32] have opted to adopt, by using the OpenCV library where they collect distinctive traits from the human face to detect whether the individual has a positive, negative or neutral expression. These traits are combined with a Fuzzy rule system, as the difference for a Negative and a Normal expression is merely the degree of a frown. They later use something that they call emotion reward (ER) for Reinforcement Learning, where they include this reward in Formula 1 to let the program learn to solve mazes and different problems with the help of an input which is based on a person’s facial expression.
Another way can be to have a Deep Convolutional Neural Network which could be based on Edge Computing, using suggested improved CycleGAN. For experimentation, diverse facial expression databases can be used, such as FER2013 [33], CK+ [34] and JAFFE [35], which are commonly used within facial expression research [36]. Emotion Vector is used in Reinforcement Learning and is called ”basic” emotions in [37]. The three ”basic” states are joy, sadness and fear, and they are stored in a three-dimensional vector. Furthermore, the analyses of the emotions are conducted with Affectiva [38], and the vector is used to compare the actions taken by the individual and consequently improve the program to suggest the correct action given the emotional state of the subject [39]. There are six basic emotions: happiness, sadness, anger, fear, surprise and disgust, suggested by Ekman and Friesen, and they are concluded to be universal. These six basic emotions are used in the majority of the studies even though there are different opinions, and they change from study to study [37,40,34]. To conclude, the literature review, is relevant to mention that for emotion recognition, researchers are not only using databases but even real-time images.
3.2
Neural networks for facial detection
Deep learning models have shown good performance for many different computer vision applica-tions. As mentioned in previous sections, there are two ways to extract features with deep CNN models: one using feature extraction that incorporates several convolutional layers, pooling layers and activation functions; and (b) the classification part composed by a few fully connected layers followed by a loss function[41,42,43,44,45,46,47].
A face recognition system is built of four models which are detection, alignment, feature extraction and matching. The localisation and normalisation are considered as steps made before the face recognition is performed. A fast face detection method which is based on discriminate complete features (DCF) draw out by an elaborated CNN, is presented in the mentioned studies. This method uses direct classification in DCFs compared to newer face detection methods using CNN, which allows for a more efficient face detection process. Also, this method can effectively detect faces with small sizes utilising a strategy called sliding window. This method can have good results in performance in different face detection databases [21].
Furthermore, basic models of a neural network are presented which applies efficiently to modules of the facial recognition system. The three-layer artificial feedforward neural network and AdaBoost with Tanh activation function are being used for face detection modules [48]. New models to recognise human faces in 2-dimensional digital images are aiming to combine AdaBoost and ANN
for Face Detection. The result revealed that it could minimise false detections. For face alignment modules, multilayer perceptrons (MLP) are introduced. Multilayer perceptron active shape model (MLPASM) was used as a 2D local texture for the active shape model (ASM) local searching. The comparison of classical ASM and MLP ASM was made on the MIT + CMU database, which shows the feasibility of MLP ASM models. Grounded Intersubjective Concept Analysis (GICA) was used for a combination of geometric feature-based methods, and facial feature extraction was presented with the ICA method [48].
In the different studies, neural network-based algorithms were implemented to distinguish frontal views on faces in grey-scale. This algorithm is general and can be applied to different views of faces and pattern recognition problems as well as for training methods. Due to the level of difficulty in portraying prototypical ”non-face” images, preparing a neural system for the face location task can be demanding. Dissimilar to face recognition, where the classes to be separated are various faces, the two categories to be segregated in face detection are “images containing faces” and “images not containing faces”. The algorithm can identify somewhere in the range of 78.9% and 90.5% of faces in a group of 130 test images. Contingent upon the application, the framework can be made rather a traditionalist by shifting the discretion heuristics or limits utilised. The framework has been tried on a wide assortment of pictures, with numerous appearances and unconstrained foundations [49].
Lastly, the connections approach for identifying and exactly confining semi-frontal human faces in complex pictures, making no suspicion about the substance or the lighting states of the scene. For this approach, a convolutional neural network architecture intended to perceive face patterns straightforwardly from pixel pictures with no pre-processing, via consequently blending its own arrangement of highlight extractors from a huge preparing set of countenances. It is shown the subtleties, the enhanced plan of the design, the learning procedure, and the subsequent procedure of face location. Additionally, it gives exploratory outcomes to show the vigour of the methodology and its capacity to identify amazingly factor faces in uncontrolled conditions unequivocally [50].
3.3
Reinforcement Learning in robotics
Reinforcement Learning (RL) in the context of robotics is possible using artificial agents that learn to act as they should in a simulated or real environment. That involves constant states of state and action which are indisputable. To represent the predictive function of the RL service, it is combined with the neural network approach. Based on the context that the authors give, there are several issues such as the balance between exploration and exploitation, simulation of apparently changing strategies in animal behaviour, development and integration of “meta-heuristics” like “curiosity” or “cautiousness,” learning of several partially incompatible actions, the problem of finding a “state space” and its partial observability [13,12,51,52].
RL can be used in game theory and multi-agent systems where exploitation and exploration need to be optimized. The experiment conducted to make an agent learn the environment with exploitation and exploration. This experiment is based on a finite number of state-action by the agent, the probability of moving from one state to another based on action and a reward-related with moving to the following state with a given action. The objective is to adjust and amplify the present reward and potential compensation by foreseeing the best action. By mixing deep neural network architecture with reinforcement learning, the result will be deep reinforcement learning (DRL). DRL can be used in complex games and areas such as robotics, smart grids and healthcare. The problems that are more complex with RL are solved with RL based on Q-Learning algorithms [11].
4
Problem Formulation
Humans have learned through evolution and their own experiences to recognise whether a person should be approached or not and how to collaborate [53]. A robot, on the other hand, does not possess these traits intrinsically and to participate in interactions with a human; it needs to acquire essential collaborative capability and skills [54]. In this master thesis, a basic approach of human-robot interaction is implemented to improve the cooperation between the two parties, and its performance is to be evaluated in simulation. The problem can be reduced into two different aspects. The first is determining when to approach the human, and the other is approaching it. To decide when, a CNN will collect data from the robot’s camera sensor and classify the individual’s emotional state based on its facial expression, and pass the results to the RL algorithm. When the emotional state is classified as positive, the RL algorithm will command the robot to take a sequence of actions that will lead to approaching the subject based on the robot’s current state which is determined by the sensors’ readings. Instead, if the emotional state is negative, the taken actions will lead to avoid the negative person.
4.1
Hypothesis
By considering the problem formulation, the hypothesis for this thesis work can be formulated as: By implementing the reinforcement learning algorithm and combining it with the convolutional neural network, it is possible to achieve a basic human-robot interaction.
4.2
Research questions
The two following research questions are addressed in this thesis work.
• RQ1: How can the reinforcement learning algorithm be implemented to approach an individual and establish Human-Robot Interaction?
The algorithm should take into consideration plausible and efficient methods to approach or avoid the individual. It should further recognize the human’s stance to complete a friendlier interaction.
• RQ2: How can the CNN help the reinforcement learning algorithm have an interaction by responding to human facial expressions?
Perception in a robot is an essential tool to have to understand its environment. The CNN will perceive the human’s emotional state based on facial expressions and decide when to approach. Thus a CNN is essential to ensure an improved interplay.
5
Method
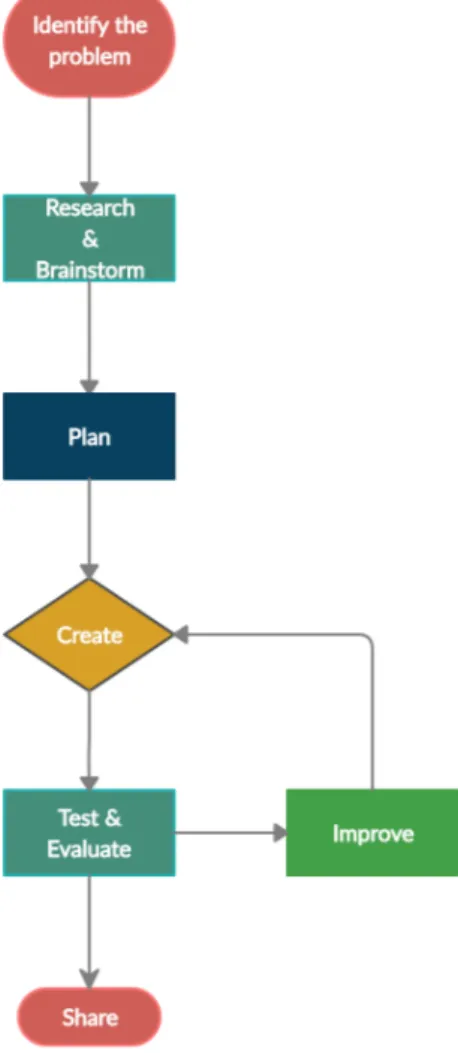
This thesis will follow the engineering design process approach [55] shown in Figure 6, which is a highly iterative process consisting of several steps based on quantitative research methods. The engineering design process is useful for identifying the problems and continuously improving the solutions thus making it the most suitable approach for this thesis work in terms of testing and confirming theories and assumptions. The process includes the following steps:
Figure 6: The series of steps in the engineering design process methodology used for solving problems.
5.1
Data acquisition using convolutional neural network
A CNN will be modelled to analyse visual images by using TensorFlow’s (an open source machine learning library) application programming interface (API) where a python script code drives the network. The network will undergo training to learn distinguishing the differences of features in facial expressions that are representative as positive and negative respectively using an image database. The trained network will then be tested using a smaller quantity of images from the same image database to observe the accuracy of the outputs before proceeding further. Different strategies will be used until an adequate accuracy level is reached, such as training the network using a larger image database and grouping different similar emotions under the same label. The
target accuracy level is estimated to 70%1and above so that the robot’s ability to determine facial
expressions is as precise as possible.
The output data from the neural network will be fed as input to the reinforcement learning algo-rithm which will use it as instructions for the robot’s execution of actions. The output from the neural network will also determine the robot’s accuracy when judging the facial expressions of the subject.
5.2
Applying Q-learning for agent training
The Q-learning algorithm will be examined and consist of two main parts, an exploratory part as well as an explanatory part. The exploratory part is observational and seeks to observe what is happening while the explanatory part will clarify concepts and give us an understanding of why certain actions takes place and thus give us the ability to explain them [13].
The reason for Q-learning to be the implemented algorithm in Python is due to its useful open-source documentations, user friendliness and efficiency. A reward system will be defined to train the agent in an environment in order to maximize the cumulative reward. The agent will generate its own data while interacting with the environment and hence no additional external data has to be provided. Q-learning is a model-free algorithm and is therefore applicable to any environment in which the agent will start off by exploring the environment, find the optimal policy and then exploit it to maximize the obtainable reward.
The OpenAI gym is an opsource library toolkit that provides various playgrounds and en-vironments which can be utilised to compare and develop reinforcement learning algorithms. The compatibility with TensorFlow facilitates future use for implementation and testing together with the CNN.
A virtual environment will be created to observe the agent’s behaviour and learn its decision-making methodologies. This also allows experimentation with different parameters, for instance the learning rate and the importance of future rewards. Given that the agent can navigate through the environment effectively and find an optimal policy and thereby exploit the environment, the subsequent stage would be to create a virtual environment representative for the real environment in which the agent will act in accordance with its training of recognizing human facial expressions.
5.3
Robotic platform
Live experiments will be conducted using the robot RedBot shown in Figure 7 made by Spark-Fun Electronics which operates using dual motors with sensor integration based off the Arduino platform. The RedBot includes multiple sensors including a line follower and an accelerometer. A camera will be attached to the RedBot for taking input of facial expressions that will be classified by the trained CNN and the output will be fed to the RL algorithm which manipulates the robot’s action. LED-lamps will be mounted onto the robot initially to display the robot’s output. A green light will indicate a positive expression while a red light will illustrate negative.
When the LED-lamps can successfully display the correct readings of expressions, the robot will also demonstrate it in the form of motor actuations. The robot will distance itself from the sub-ject when it perceives negative expressions and approach the subsub-ject when interpreting positive expressions.
1
Figure 7: The robot to be used for live experiments.
5.4
Validation
The different parts of the work will be validated independently before being combined.
The RL algorithm will be validated using the open-source 3D robotic simulator Gazebo2. The software allows rendering of realistic environments that can represent reenactments of physical en-vironments. Sensor simulations can perceive the environment and together with actuator control it enables a full recreation of the robot which can be simulated and tested in the virtual environ-ment. The simulation will show how the current algorithm works and facilitates the observance for possible improvements. The progression being made to the RL algorithm will frequently be tested and simulated to verify that the progress is going in the right direction.
The CNN will be trained using 80% of the data in the image database while the remaining 20% is used for validation. The accuracy level is given to the user instantaneously, enabling the user to quickly review and improve the CNN as needed.
When the robot is able to interact with the simulated environment as desired, i.e. reciprocate to the facial expression images as explained earlier, then, the software will be implemented on RedBot and carried out in real-time.
6
Limitations
A constraint that can affect the results and expected outcome of the project is the lack of ac-cessibility to powerful computers. Machine learning and in particular training of neural networks require powerful computers to handle a significant amount of computations. The implementation will be done on regular PCs which can have a considerable impact on the amount of processed data and thus on the final results. During the Gazebo simulation, a few limitations were encountered. The resolution of the camera sensor was low and combined with humans in the simulation that do not entirely depict a real person made it hard for the CNN to work correctly. Combined with the absence of powerful machines, the already low-quality images, were resized to half of its size, losing quality, to speed up the process of facial detection. Also, the simulator has the capacity to know the exact location of all the objects in the environment and this trait was exploited. In real life, one could use distance sensors to obtain a similar result.
6.1
Effect of the COVID-19 pandemic on the thesis work
The COVID-19 pandemic outbreak reached its peak in the early stages of the thesis work resulting in new guidelines to be followed. The university’s opening hours changed and could thus not be accessed except for certain hours each day. Therefore, most of the work had to be done from home, which had an impact on productivity. Physical meetings with the supervisors were also not possible and were held online. They were helpful and could answer our questions but physical meetings could have facilitated it further as only explaining the work can make room for misinterpretations and misunderstandings.
7
Implementation
This section describes the implementations of the explained methods from section 5. It includes both the processes as well as brief overviews of some of the utilised libraries throughout the work. The project was mainly broken down into three practical parts, and each was tested and validated individually before being merged with the others. The following list shows the division.
1. Facial expression detection using CNN.
2. The Q-learning algorithm applied for robot manoeuvring. 3. Performance simulation using the Gazebo simulator.
7.1
Facial expression detection using CNN
A CNN was the chosen ANN for this project. As mentioned in Section 2.2.1, CNNs focus mainly on having images as inputs. Thus, making them commonly used in computer vision and video recognition tasks. Two different CNNs were trained and validated. One of them using a database called CK+, hereafter called ”CK-CNN”, and the other one using the RAF database, hereafter referred to as ”RAF-CNN”. The two CNNs were implemented each one having a particular aim in the project based on their traits. The CK+ data-set is an image data-set containing staged photography, which makes it suitable for higher accuracy. In contrast, the RAF data-set is built of real-world photography, making it more convenient for real-world applications. The CNNs em-ployed TensorFlow and OpenCV. OpenCV is an open-source computer vision library that consists of numerous programming functions that focus primarily on obtaining information from images or real-time videos3, and it was responsible for handling the photos from the data-set. Additionally,
TensorFlow was used for training and validation of the CNN. A Haar-Cascade, for frontal face detection, is exclusively used in the RAF-CNN to detect faces in the images and crop the portion where the face is located, after that just feeding the face into the CNN. It does not apply for the CK-CNN, as its content solely represents faces.
7.2
Image Datasets for facial expression recognition
Facial expressions are the mirror of every emotional state and intentions of a human being. In computer vision and machine learning, these are used dramatically for facial expression recognition (FER) systems. Ekman and Friesen [56] based on cross-cultural studies, decided that six are the basic emotions that humans have. The facial expressions are anger, disgust, fear, happiness, sadness, and surprise. Although, different studies do not agree with the model of six basic emotions and instead sustain that they are culturally based and not universal. Numerous databases contain basic expressions that are vastly used in deep learning algorithms evaluation. Some of these databases are CK+, MMI, JAFFE, TFD, FER-2013, AFEW 7.0, SFEW 2.0, Multi-PIE, BU-3DFE, Oulu-CASIA, RaFD, KDEF, EmotionNet, RAF-DB, AffectNet and ExpW.
7.2.1 The Extended Cohn-Kanade Dataset (CK+ Dataset)
The CK+ data-set consists of 210 images from adults expressing facial behaviour. They were recorded with two Panasonic WV3230 cameras, with both paired to a Panasonic AG-7500 video recorder. The members that were recorded were of varying ages, ranging from 18 to 50 years old. Differences among the participants were colour, age, face shape, ethnic background, texture, and facial and scalp hair varied with gender. The set was based on taking a series of 23 facial displays for each member, which involved combinations of actions and single actions. Every collection started and ended with an expressionless face. The photographic equipment had different locations; one was placed in front of the subject while the second one was 30 degrees to the right. The digitalisation was in 640x490 or 640x480 pixel arrays with 8-bit grey-scale or 24-bit colour values. The original CK had 486 Facial Action Coding System (FACS) sequences from 97 subjects, and
for the CK+ there were added 593 sequences from 123 participants, so 22% extended sequences and 27% different subjects.
While recording the CK data-set, 84 members smiled at the camera one or more times during the assignment. The smiles were relatively natural and not as a response to an action. These natural facial expressions are the base of CK+. The requested criteria were: the absence of facial occlusion before smile apex, no indication of the requested directed facial action task, lack of image artefact and relatively neutral expression at the start. Although 66 members achieved the smiles that matched the required criteria with 122 smiles, and 32% were completed with some small planned comments [34].
7.2.2 CK-CNN
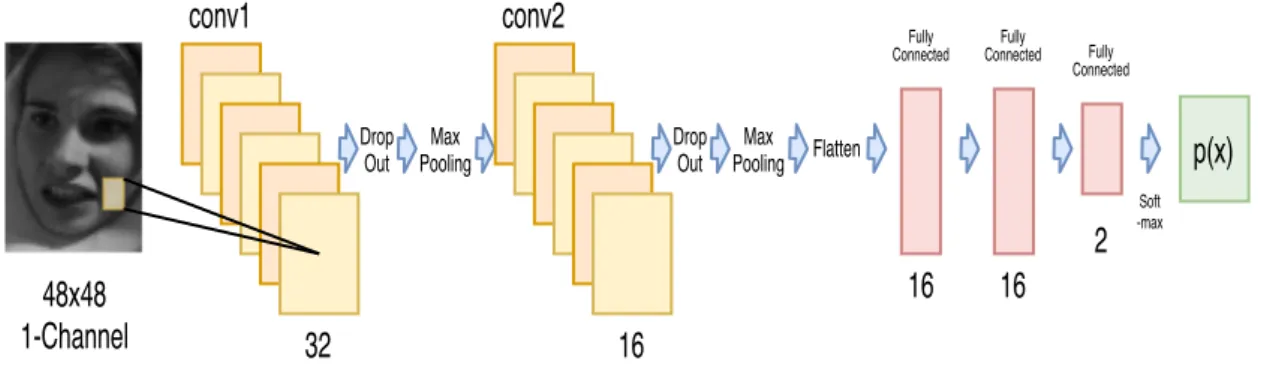
For the CK-CNN the complete data-set was not utilised. Instead, four of the seven existing emotions were adopted. Happy and surprise were merged to create a positive class, and angry and fear were combined to create the negative category. The positive class contained 432 images and the negative class 353 with images in greyscale that had a size of 48x48 pixels. The data-set was divided into train, validation and test data. The test data consisted of 5% of the total data from each class, while the remaining classes were split into 85% and 15% each, for training and validation, respectively. The training data was used to train the model, and the validation data helped after each epoch to confirm that the model was trained properly and to prevent it from over-fitting. The test data was used after the training was concluded as unseen data to test the performance of the trained model. The number of samples processed before the model was updated (batch size) was 32, and it had a learning rate of 0.001. The learning rate had a decay rate of 0.7 every 23 steps and patience of 15 iterations in case the validation loss would not improve. The architecture of the model can be seen in Figure 8.
48x48
1-Channel
conv1
32
Drop Out Max Poolingconv2
16
Drop Out Max Pooling Flatten Fully Connected16
Fully Connected16
Fully Connected2
p(x)
Soft -maxFigure 8: Architecture of CNN using the CK+48 Data-set.
A tensor of shape (48, 48, 1) was used as input based on the image width, height and colour channels (R, G, B). Since the pictures were in greyscale, there was one colour channel. The CNN model followed a commonly used pattern which is a convolutional layer followed by a dropout layer and then a max-pooling layer which builds a convolutional base. This pattern is repeated twice. The first convolutional layer had a filter of 32 and the second one of 16. Both shared a kernel size of (3, 3) and had the activation function ReLu (Rectified Linear Unit). The Max Pooling layers were both equal and had a filter size of 2x2. The first dropout layer turned off 30% of the neurons compared to 15% in the second. A dense layer (Fully connected layer) was added on top of the convolutional base. Dense layers have 1D vectors as inputs, and since the output from the convolutional base is a 3D tensor, a flatten layer was used to turn the 3D output of the convolutional base into a 1D vector. After that, there was a dense layer with 16 outputs and a ReLu activation function, followed by a dropout layer with a 30% drop out and finally the classification layer with two outputs (positive or negative) and softmax as the activation function.
7.2.3 Real-world Affective Face Database (RAF-Database)
The Real-world Affective Face Database (RAF-DB), as the name implies, is a real- world data-set containing 29,672 images with great facial diversity obtained from the internet. Seven basic and eleven compound emotion labels are provided for the samples via manual annotation and continuous evaluation. An amount of 15,339 photographs from the basic emotion set are separated into two particular groups, 12,271 training samples and 3,068 testing samples for evaluation [22]. Based on different studies, although mostly on Yingruo Fan et al [23]. it can be determined that a good accuracy for the adopted database when classifying happy, surprise and angry emotions, should be 88.78%, 86.02%, 83.95%, respectively.
7.2.4 Haar-Cascade for Face Detection
Haar-Cascade is an effective machine learning algorithm for object detection in images or videos. It is based on the approach to features introduced by Paul Viola and Michael Jones in [57]. It is popular for being capable of identifying faces and body parts, but it is possible to recognize practically any object with training.
7.2.5 RAF-CNN
The RAF-CNN made use of the emotions happy and surprise for the positive class, and sadness, anger and fear were merged to create the negative category. The positive class contained 2500 images for training and the negative class 2498. For validation, there were 705 images from each class, and for testing, 300 were used for each class. The same principle of the CK-CNN was applied for this CNN, where the training set was used to train the model, validation set to support the training and the test-set to examine the CNN’s performance against previously unseen data. The images were converted into greyscale, and they were scaled to 70x70 pixels. The batch size and learning rate were the same as for the CK-CNN, 32 and 0.001, respectively. The learning rate had a decay rate of 0.7 every 247 steps and patience of 10 iterations in case the validation loss would not improve. See the model’s architecture in Figure 9.
70x70 1-channel conv1 32 Max Pooling 64 conv2 32 Max Pooling 16 conv3 conv4 Max Pooling Flatten Fully Connected 32 Fully Connected 2 Soft-max p(x)
Figure 9: Structure for CNN with RAF-Database.
The CNN had a tensor of shape (70, 70, 1) as input and its model followed a convolutional layer followed by a max-pooling layer pattern, which constituted the convolutional base. The design was repeated three times, and all convolutional layers had a kernel size of (3, 3) and ReLu as their activation function, as well as the max-pooling layers with a filter size of 2x2. The different convolutional layers differed in the filter size, having it as 32, 64 and 32. Subsequently, a last convolutional layer followed, which also differed from the others by having a different filter size of 16. This layer connected to the dense layers through the flatten layer. Lastly, there were two dense layers, the first one with 32 neurons and a ReLu activation function which connected to the final layer which consisted of two outputs (positive and negative) and a softmax activation function.
7.3
Q-learning algorithm applied for robot manoeuvring
The chosen RL algorithm for this project was the Q-learning algorithm mainly due to its simplic-ity and intuitiveness. It serves as an introduction to reinforcement learning and makes the core concepts, such as agent, actions and states easy to understand. It does not deal with extremely difficult and complicated technical details, unlike Deep Q-learning which requires prior knowledge in Keras and TensorFlow, i.a.
The Q-learning algorithm seeks to find the best action to execute at a given state which can be found in a Q-table. The Q-table is initially empty and as the agent explores the environment, the Q-table gets updated with higher Q-values which will help maximize the expected long-term reward.
The Q-learning algorithm would reward the robot for taking the correct decisions, i.e. responding to each facials expression accordingly. Otherwise, it would be given a penalty. The robot would approached the person if the person expresses a positive facial expression and distanced itself from the person in the cases of negative facial expressions.
In order to implement the Q-learning algorithm, the following aspects had to be dealt with: setup of the environment, selectable actions, the hyperparameters, distance/angle estimator as well as a reward system.
The environment consisted of a graphically rendered 9x9 square grid wherein the agent would navigate. The agent’s goal was to take actions and acquire knowledge by learning to find the shortest path to the goal. There were 8 possible actions (up, down, right, left and diagonally in all directions) which enabled the agent to learn efficiently and find the shortest path to the goal without being limited by its own actions. 80% of the iterations were allocated for training in which the subject was not static throughout the whole process but rather changed position after every iteration in order to test different angles and distances. The rest, 20% of the iterations were for testing.
Table 1 shows the implemented model hyperparameters and their respective values.
Learning rate Discount EPS
0.1 1.0 1.0
Table 1: Model hyperparameters
The learning rate, as explained in 2.1.1 simply determines to what extent newly acquired informa-tion overrides old informainforma-tion taking a value between 0 and 1. Setting the value to 0 would make the agent learn nothing new and only depend on exploiting the environment in accordance with prior knowledge while a value of 1 would make the agent ignore what was previously learned and only consider the most recent information.
The discount factor determines the importance of future reward. A factor of 0 would make the agent short-sighted and only look for current reward while a higher value would make the agent strive towards a high, long-term reward.
Lastly, the EPS determines the randomness of actions. It’s high in the beginning, encouraging exploration, but decreases after each iteration to make room for the agent to start taking the best actions instead of random actions. The process continues throughout the training phase, and by the end of it, the EPS value is 0.
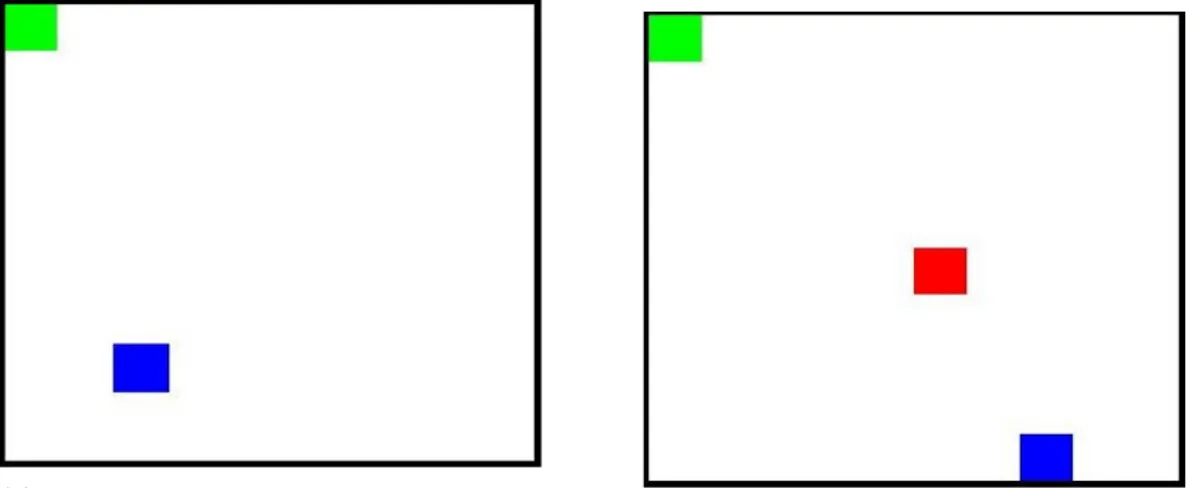
Once the model hyperparameters were set, a positive person was added to the environment in order to act as the goal, as shown in Figure 10a. The agent would receive a greater punishment if it took an action which distanced it from the person and a smaller punishment by going in the right direction, towards the person. The reward for reaching the positive person was 0 and thus the agent’s aim was to keep the total punishment as close to 0 as possible within an iteration. The agent was consistently provided with a discrete distance to the person using the formula: p
x2+ y2 where x and y holds a value between 0 and 9. The agent was also provided with the
agent feedback in which direction to move to reach the positive human in the form of a number (0-7). Every number represented a 45◦ angle, as illustrated by Table 3. The robot’s x and y axis originates from its center, are static and also parallel to the x and y axis of the grid. The robot has its own direction vector which indicates where the robot is facing just as the positive person is associated to a vector that indicates where he is located. Both of these vectors’ angles are measured with respect to the robot’s x-axis and the difference between them are presented in the form of a number as mentioned earlier. A good illustration of this is given by Figure 11. Hence, whenever the robot takes an action, the resulting direction vector of the robot is recalculated and the angle is compared to the angle of the vector of the positive person. Every action were printed on the screen and provided the user with the orientation of the agent with respect to the positive human. Once the person was reached, the program would terminate.
(a) The agent is marked in blue and the positive
per-son marked in green. (b) The negative person is marked in red.
Figure 10: The agent learns by seeking to find the positive person and receives a great punishment if it gets too near the negative.
A negative person (illustrated by Figure 10b) was added in the center-parts of the grid in the same manner as the positive person except that the punishment would increase if the agent would approach it. When the agent comes near the negative person it can be perceived by the user as if the agent steps on it due to the step size being set to 1. The step size makes the user unable to see movements on distances smaller than 1 due to the size of each cell being set to 1x1. As a result, it appears as if the agents steps on the cell of the negative person in the grid but that’s not the case. The avoidance is much clearer in the simulated environment.
The agent was receiving feedback of the distance to the negative person as well as positive person constantly. However, the angle to the negative person was only received by the agent if the agent came within an area of 1x1 horizontally or vertically and 1.42 diagonally. The program would not terminate if the agent stepped on the negative person as for the case with the positive person, but rather issue a very high punishment. Table 2 gives and overview of actions resulting in different punishments.
All possible states were different combinations of: • Distance to positive person.
• Angle for facing the positive person.
• Whether agent was nearby negative person or not. • Angle to negative person (if agent was nearby)
The punishment per iteration was logged throughout the learning process and testing phase and plotted after termination to be observed and analysed by the user.
Figure 11: The big green arrow is the robot’s direction vector and the black is the angle of the positive person. θ1 is the angle of the direction vector and θ2 denotes angle of the of the positive
person. The differences between them signals the robot about its orientation with respect to the positive person.
Table 2: An overview of the reward system. Directional punishment refers to the punishment that would be given normally.
7.4
Performance simulation using the Gazebo simulator
The simulation was implemented in the Gazebo Simulator being controlled by the Robot Operating System (ROS) application programming interface (API). The ROS API is an open-source collection of libraries and tools that supports the building of robotic application, and in robotics is used as middleware. A robot’s hardware can be accessed and controlled with ROS topics, services,
messages and action servers4. In the simulation, the Q-Learning and the CNN worked together.
Three scenarios were created to validate the functionality of the developed algorithms, and one method was created to check the distance at which the faces of the different persons were found. Experimental Set-Up
The subjects were placed facing the robot for easier facial emotion recognition. A static position and orientation throughout the experiment were maintained by the subjects, where all faces were visible at the start. The emotions exhibited by the persons were constant. Once a face was found in the picture obtained by the camera sensor, which is placed 1.4 meters above the robot to be closer to the faces level, it was replaced by one image from the CK+48 data-set for improved reliability during the experiment. The experiment to investigate at what distance the faces started to be detected, experiment for facial detection, consisted of the robot being placed in the lower-left corner and the person with either positive or negative emotion on the opposite corner to create the longest possible distance between the two, see Figure 12. The experiment was performed with six different subjects, two representing the positive expression with happy and surprise emotions, and four with the following negative expressions, angry, fear and two distinct for sadness. The robot went in a straight path towards the person while logging the results from the Haar-Cascade whether a face was encountered or not.
Figure 12: Experiment to investigate distance of face detection when using the Haar-Cascade.
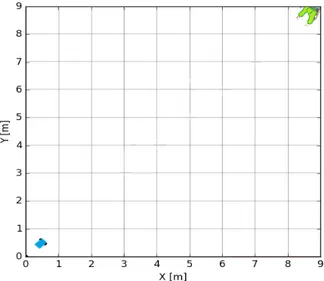
Three experiments were created to test the functionality of the Q-Learning along with the CNN. The first scenario was implemented five times. In this scenario, the robot and the positive person were facing each other at a distance of ≈8.48 meters, as seen in Figure 13, which was outside of the range for reliable facial detection. The second and third experiments were implemented eight times. Both had two subjects, one with a positive emotion (Positive) and the other with a negative emotion (Negative), see Figure 14. The Negative subject was placed between the robot and the positive to force the algorithm to avoid the negative while approaching the positive. Whenever the negative person was being approached, the robot would react to it by merely avoiding him on his left side (shortest path to the positive without entering the negative boundary) and proceed towards the positive person, i.e. the goal. In scenario two, the distance to positive was ≈6.25 meters while to negative was ≈3.35 meters, both within the facial detection range. For the third scenario, the distance to positive was ≈8.48 meters, and to negative was ≈5.32 meters, where the positive was outside of a reliable facial detection range. When out of the range, the robot advanced without the Q-Learning algorithm controlling it, and once it detected a face, the algorithm assumed control of the navigation.
Figure 13: Environment where the experiment occurs, with only one positive person in green and the robot in blue.
(a) Scenario 2 (b) Scenario 3
Figure 14: Environment where the experiment takes place, with the positive person in green, negative person in red and robot in blue.
Q-Learning Algorithm Implementation
The trained Q-Table was used to decide the direction the robot should take based on the angle and distance to the subjects. Depending on the separation and angle to the individuals, the velocities were determined in the following way. The linear velocity was
v = d
dmax
where d was the distance to the subject and dmax was the maximum possible distance between
the robot and the individual (≈12.73mts) and the angular velocity was
ω = θ
θmax
where θ was the angle to the subject and θmax was the maximum possible angle between the
robot and the person (180◦). Using ROS Topics, the subjects’ x and y coordinates were retrieved