Industrial Symbiosis in Malmö:
Transitioning into a collaborative
network
Emelie Larsson
Two-year master program in Interaction Design, 120 credits Thesis project 2, 15 credits
Malmö University K3, Spring semester 2020 Supervisor: Clint Heyer
2
Abstract
In collaboration with Afry, the focus of this thesis is to facilitate the transition from an Industrial park into an Eco-park using industrial symbiosis strategy, in the industrial harbor of Malmö. To transition into a collaboration where physical exchanges of energy, waste, materials and other by-products between different facilities takes place. Some of the keys to an industrial symbiosis are proximity, government planning and self-organization. The aim of the thesis is to create a digital platform that can facilitate the connectivity between facilities and organizations and to inspire a social transition. Therefore, this thesis uses transition design as an approach, touching upon topics such as organizational collaboration, industrial symbiosis strategy and knowledge sharing. Whilst using Research through design for designing a technology that can inspire collective transition into a more sustainable future. Design methodology from Service design and Interaction design, such as user researching, customer journey mapping and prototyping, is used when designing for a somewhat unexplored area in Sweden.
Keywords: Industrial symbiosis, Transition design, Knowledge sharing, Organizational collaboration.
3
Table of Contents
Introduction ... 6
Positioning within Interaction design ... 7
Research question ... 7
Collaboration ... 7
Limitations ... 7
GDPR and ethical concerns ... 7
Background ... 9
Industrial symbiosis ... 9
Technologies for Industrial symbioses ... 9
Creating a sustainable network ... 10
Transition design ... 11
Organizational data and knowledge sharing ... 13
Industrial and urban symbiosis in Malmö ... 13
Influential examples ... 15
Kalundborg Symbiosis ... 15
Digital tools for Industrial symbioses ... 16
3.2.1 FISSAC ... 16
3.2.2 eSymbiosis ... 17
3.2.3 Loop Rocks ... 19
3.2.4 Excess materials exchange ... 20
3.2.5 SHAREBOX ... 21
Renova digital platform ... 22
Karma ... 23
Methodological approach ... 25
Research through design ... 25
Interviews ... 25
Service design methods ... 26
4.3.1 Customer journey mapping ... 26
Flowchart ... 26
Prototyping ... 26
Usability testing ... 26
Design process ... 27
Interviews ... 27
4
5.1.2 Interviews about existing tools ... 27
5.1.3 User interviews ... 28
5.1.4 Conclusions ... 30
Customer journey mapping ... 31
Flowchart ... 32 Prototype ... 33 Usability tests ... 38 5.5.1 Students ... 38 5.5.2 VA-syd ... 38 5.5.3 Malmö City ... 38 Result ... 40 Discussion ... 42 Future development ... 43
Contributions to Interaction design research... 44
References ... 45
Appendix ... 48
Appendix I: Interview questions ... 48
5
Figure list
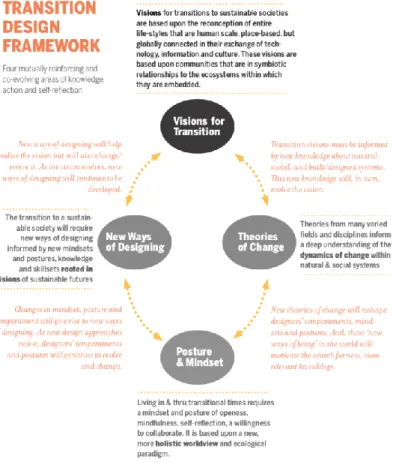
Figure 1. Transition design framework (Kossoff et al., 2015). ... 12
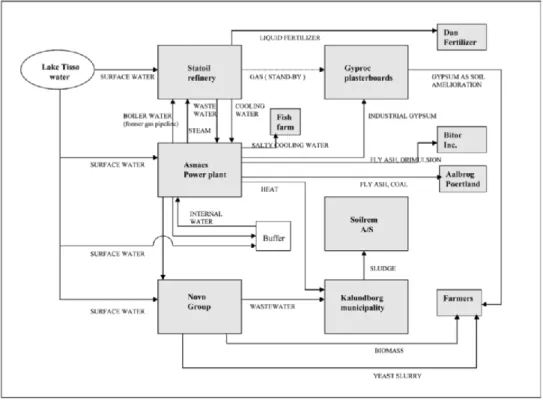
Figure 2. Chart over the waste flows in the Kalundborg symbiosis (Jacobsen, 2006)... 15
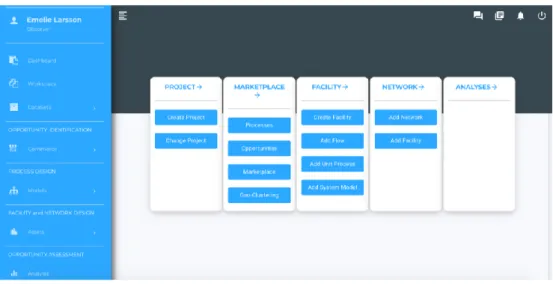
Figure 3. Fissac home page (Fissac, 2020)... 16
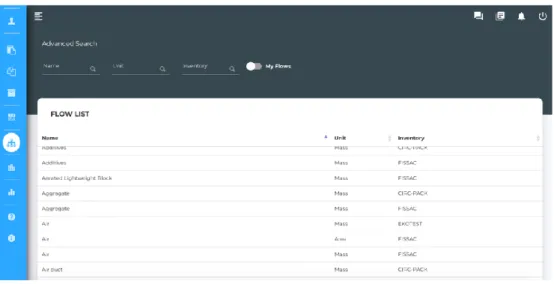
Figure 4. Fissac flow overview (Fissac, 2020). ... 17
Figure 5. Organisation profile input (eSymbiosis, 2020). ... 18
Figure 6. Regestering the organisation’s resources (eSymbiosis, 2020). ... 18
Figure 7. eSymbiosis creates possible matches (eSymbiosis, 2020). ... 19
Figure 8. Loop Rocks platform (Loop Rocks, 2020). ... 20
Figure 9. Sharebox identifies opportunities for trading waste materials (Sharebox, 2020). 21 Figure 10. The Renova customer portal (InUse, 2020). ... 22
Figure 11. Karma application (Karma, 2020). ... 23
Figure 12. Customer journey map of the users experience. ... 31
Figure 13. Flow chart over main functions. ... 32
Figure 14. Examples of flows for the prototype. ... 34
Figure 15 & 16. The overview before loggining in and after. ... 35
Figure 17 & 18. Sending a notice of interest regarding a specific waste flow... 35
Figure 19. Registering a new account. ... 36
Figure 20. Company that do not want to share their information shown on the map. ... 37
Figure 21. Adding information about current waste flows... 37
6
Introduction
Industrial symbiosis is the collective physical exchanges of energy, waste, materials and other by-products so that the overall resource utilization can be improved within an area and between different facilities (Song, Geng, Dong & Chen, 2018). A network like this will often need to share infrastructure and engages collectively in related environmental projects (Grant, Seager, Massard and Nies, 2010). The advantages of an eco-park that implements industrial symbiosis are material reducing, energy and economic costs, while improving operating efficiency and quality (Song et al., 2018). Kalundborg in Denmark is told to be the world’s first eco-park using an industrial symbiosis strategy, and countries like United states, Japan, South Korea, Italy and Thailand have followed with their own stories and examples of industrial symbioses (Song et al., 2018). Many digital platforms and projects aiming to help industrial symbioses and eco-parks have been developed in different parts of the world, but with unclear outcomes (Grant et al., 2010). Some of the keys to maintaining a collaboration like this between different organizations, are the geographical proximity and government planning. However, studies have shown that the human connection and the social process is an important factor in an Industrial Symbiosis network. Focusing on the human intention and on the human connection, creates interactions and collaborations with more value and with less waste, according to Cohen-Rosenthal (2000). It is about how we as humans make choices, our willingness to seek new connections and to explore the possibilities of the world (Cohen-Rosenthal, 2000). Therefore, this thesis uses Transition design as an approach. Transition design acknowledges that we are living in “transitional times” and its central premise is the need for societal transitions into more sustainable futures, and aims to design solutions for short, medium and long horizons of time and in all levels of scale in every day and working life (Kossoff et al., 2015).
This thesis project is made in collaboration with Afry, a company that works with engineering, design and advisory within the fields of infrastructure, industry and energy with the aim of creating sustainable solutions for future generations (Afry, 2020). Through working with Malmö City and other big companies and facilities in Malmö, they have concluded that in order to promote industrial symbiosis in the area of the industrial harbor in Malmö, a public digital platform is needed. A digital platform can facilitate the necessary connection between companies in the industrial area, and can provide an overview of the different waste flows. This can open up for new possibilities and create connections between companies that were not connected before, and eventually create new synergies and symbioses. The benefits of having a symbiosis like this in Malmö are environmental, economic, strengthening for organizational relationships, and making potential environmental projects visible for others outside of the area.
7
Positioning within Interaction design
This thesis project has the approach of Transition design, as one of its sub-fields is Interaction design. I aim to use this for creating a bridge for transitioning from an industrial park into an eco-park by using industrial symbiosis strategy. This is achieved using Research through design as a methodological approach, using methods from Service design and Interaction design in the process.
Research question
The focus for this research will be to create a platform for creating a social connectivity and collaboration between companies for sustaining an industrial symbiosis. With the aim of transitioning in to an Eco-park. Hence, the research question for my thesis will be “How can social connectivity between companies be encouraged through a digital platform?” And, “How can a digital platform be designed in order to inspire transition into a more sustainable future?”
Collaboration
The main collaboration partner for this thesis is Afry. A company that works with engineering, design and advisory within the fields of infrastructure, industry and energy with the aim of creating sustainable solutions for future generations (Afry, 2020). A team from Afry, had already started a project to digitalize a way for companies to share resources and waste flows, in dialogue with Malmö City and four other big facilities in the industrial harbor of Malmö. During this thesis project, I have also worked together with a design supervisor from Afry.
Limitations
The users for this thesis project are companies and industries that produces or processes waste materials or waste flows, that are located in a geographical proximity of each other. Therefore, I will not look at any problems on an individual level, it will instead look at difficulties and experiences from an organizational level. Since Afry have concluded that a responsive web program is what they have the ability to develop, I will not look into other formats for a digital solution in the design process.
GDPR and ethical concerns
For this thesis project, the main user is companies and/or facilities. The contact with outside people happens during the user research in the form of interviews, and during user tests. Everyone involved in this thesis project have been contacted through e-mail and through video calls. No personal
8
information about the people I have come in contact with will be used for this thesis. Regarding ethics, I will to the best of my abilities not to discriminate anyone and will do no harm to people or to the environment.
9
Background
Industrial symbiosis
An Industrial symbiosis can be categorized as a concept of collective resource optimization based on by-product exchanges and utility sharing among different facilities (Jacobsen, 2006). The resources that are being exchanged can be materials, energy, water and/or by-products. The keys to an industrial symbiosis are collaboration and the possibilities of geographic proximity (Jacobsen, 2006). According to Jacobsen (2006), an industrial ecology or industrial symbiosis when turning waste output from one facility into raw material for another facility, will lead to environmental benefits because of the reduced intake of virgin material and also, reduces emissions from the facilities. Grant et al. (2010) argue that industrial symbiosis describes networks that cooperatively optimize resource flows for a collective benefit greater than the sum of individual benefits that could be achieved by acting alone. These networks often exchange by-products, share resources and infrastructure and also engage collectively in related environmental projects (Grant et al., 2010).
Technologies for Industrial symbioses
Many digital tools for development of industrial symbiosis have been created, but the results of the efforts coming from these tools have been unclear (Grant et al., 2010). Grant et al. (2010) looked at 17 different systems for Industrial symbiosis in 2010, where nine were shown to not be in use, three were in use but not publicly, one was open for purchase over the internet, and the rest were still under development. By evaluating these tools, Grant et al. (2010) developed a framework to identify strengths, trends and opportunities for continued development of tools for industrial symbiosis. They divided the success of an industrial symbiosis network into five main phases which are; opportunity identification, opportunity assessment, removal of barrier for realization, commercialization, and documentation and publication (Grant et al., 2010). Opportunity identification meaning the match making between companies, which could happen through investigation, organized workshops or a coordinated search. All with focus on relationship building (Grant et al., 2010). Opportunity assessments include the evaluation of the outcomes and challenges with a new innovation or process. Such as benefits/cost, risk, corporate image and environmental and social impacts. Barrier removal is important for the relationship building when overcoming or eliminating challenges associated with realization. That the business-to-business agreements require more investments. Commercialization and adaptive management can show the implementation of the industrial process and provides feedback for continual improvement. Both for internal use in the organizations and evaluates the performances of the synergetic processes (Grant et al., 2010). Finally, documentation review and publication that
10
communicate the success of individual firms and their associated synergies. Grant et al. (2010) continues by stating that data-sharing towards community-building is supportive of industrial symbiosis. They argue that it is often a lot of information that needs to be processed and communicated when establishing an industrial symbiosis between different organizations, and that some by-products or resources needs to contain a lot of information in order to be exchanged. Such as waste water. If a technology can assist with this, the outcome would have a greater chance of success (Grant et al., 2010).
Creating a sustainable network
Cohen-Rosenthal (2000) writes about the human side of industrial ecology. He argues that computerized linkages between companies and people can provide necessary information, and it can illustrate possibilities for waste streams, but they usually cannot bring about the connections needed (Cohen-Rosenthal, 2000). An industrial ecology is fundamentally about connections. About material, energy, organizational and human connections, which makes it a social construction. By identifying the use of resources and redirecting them to the right targets, economic opportunity can expand, but Cohen-Rosenthal (2000) expresses that it is not as easy as it sounds. Since different-sized companies have different data-collection capabilities, different measurements are used, and processes that are easily changed, makes it hard for a digital solution to connect different companies using their resource data (Cohen-Rosenthal, 2000). Cohen-Rosenthal (2000) instead believes that systems for industrial ecologies should operate by using self-organizing behavior, which can lead to maximizing the amount of connection and to a broader system adaption. These connections can occur based on ecological conditions or it can be constructed by building dedicated “bridges” from one material to another. Cohen-Rosenthal (2000) further explains the importance of the social process in the development of industrial ecologies and writes that in previous digital solutions, the level of prediction for collaborations removes the possibilities for the human intention to explore potential connections. When focusing on the human intention and on the human connection, it creates interactions and collaborations with more value and with less waste. It is about the ways humans make choices, their willingness to seek new connections and to explore the possibilities of the world (Cohen-Rosenthal, 2000).
Boons, Chertow, Park, Spekkink & Shi (2017), defines the dynamics of an industrial symbiosis and how the human factor can impact the evolution. An industrial symbiosis can for example evolve through self-organization, organizational strategy change, third-party facilitation through education and providing linkages, government planning or eco-cluster development through local government planning (Boons et al., 2017). Kalundborg in Denmark is an example of self-organization. Which is the development of symbiotic activities as the result of self-motivated strategies by industrial actors. These
11
are often shaped by influence from institutional factors such as level of trust, social norms, regulatory programs, and policy (Boons et al., 2017).
Transition design
Transition design, according to Tonkinwise (2017), is a design discipline that is used for large scale transitions into more sustainable futures. It comes from areas of social and management sciences, and uses theory and methodology from other disciplines such as Interaction design, Service design, Design for social innovation and Participatory design (Kossoff, Tonkinwise and Irwin 2015 and Tonkinwise, 2017). Kossoff et al., (2015) argue that design has a long and diverse history in aspiring to drive system-level change. That the modern profession of design and its subdisciplines like communication, information, interaction, production, environmental, service and social design, seeks to transition societies from tradition-bound communities to universally rational modes of living (Kossoff et al., 2015). Many contemporary designers persist in the belief that design can enable significant changes in lifestyles and ways of working by making certain practices easier and more effective. Kossoff et al. (2015) further argues that good designs in this way can determine future pathways for our societies and can play a central role in the discourse of transition. Transition design acknowledges that we are living in “transitional times” and takes as a central premise the need for societal transitions to more sustainable futures (Kossoff et al., 2015). To do so, design has a central role in these transitions and can apply understandings of the interconnectedness of social, economic, political and natural systems to address problems and to improve quality of life. Transition design can also advocate the re-conception of lifestyles with the aim of making them more place-based, convivial and participatory and harmonizing the lifestyles with the natural environment, and to design solutions for short, medium and long horizons of time and in all levels of scale in everyday life (Kossoff et al., 2015). Thus, Kossoff et al. (2015) have proposed a framework for transition design.
12
Figure 1. Transition design framework (Kossoff et al., 2015).
Tonkinwise explains it in a talk made in 2017, as a framework with areas that designers will need to focus on in order to inspire large-scale transitions. It shows the outlines for mutually reinforcing and co-evolving areas of knowledge, action and self-reflection. Visions for transition inspires designers to envision all possible futures in the specific area (Kossoff et al., 2015). Theories of change meaning that Transition design is a somewhat new discipline and borrows theory from other disciplines such as service design, design for social innovation and design for policy. The posture and mindset refer to the openness, mindfulness, self-reflection and the willingness to make a social change. Lastly, the knowledge and skillsets rooted in the visions of the sustainable future creates new ways of designing (Kossoff et al., 2015). When creating new technologies for a sustainable change, the most important part is the social change. Tonkinwise (2020) proposes participation and mutual evolving together with the users and developing new technology in a specific field and thereof, new ways of practice (Tonkinwise, 2020).
In the industrial harbor of Malmö, every company have their own strategy and vision of sustainable work. Creating a digital platform with the aim of visualizing the future and the possibility for a sustainable industrial park, and enhancing the collective visions for the near future, can open up for a transition to a sustainable network in the industrial harbor.
13
Organizational data and knowledge sharing
When trading and transferring waste materials across organizations, there is a need for knowledge and information sharing between companies. It can be knowledge about business strategy, organizational process and data regarding the waste flows, which in itself can create restraints. Suppiah and Sandhu (2011) describes an organization as a bundle of resources and among them, knowledge has been recognized as the most important resource. The management of the knowledge within organizations has become a critical activity, with knowledge sharing being acknowledge as the most common knowledge management (Suppiah & Sandhu, 2012). Seidmann and Sundararajan (1998) further writes about sharing knowledge and information across organizations and how competition and contracting affect the nature of value sharing. When information is shared, an important strategic issue is the level of information sharing. Seidmann and Sundararajan (1998) notices three observations of consequences when sharing information. First, the returns from information sharing tend to be decreasing in the amount of information being shared. Secondly, the sharing of information adds value through improved operational efficiency and can affect a dimension of the buyer-supplier relationship and the bargaining power of the two parties. Thirdly and lastly, the nature of the information shared may affect the competitive position of the buyer or supplier with other industry rivals (Seidmann & Sundararajan, 1998). Another issue can be the control. There is a limit to the gains one can achieve from sharing organizational information. When it comes to a buyer- and supplier relationship, as it is when collaborating with waste flows and services that handles waste material, there can be a reluctance to share more than operational information (Seidmann & Sundararajan, 1998). However, the level of partnering can increase when sharing information when providing a higher level of product specific information or production information. Suppiah and Sandhu (2011) argues that organizational culture and behavior can be an important factor that can influence the willingness to share knowledge and information. Meaning that the behavior within the company is determined more by its culture than it is directives from the management.
Industrial and urban symbiosis in Malmö
Five of the united nation seventeen global goals for the year 2030 are affordable and clean energy, decent work and economic growth, industry, innovation and infrastructure, sustainable cities and communities and finally, responsible consumption and production. Through using an industrial symbiosis strategy, a city can reach these goals according to Malmö City and Delad energi (2020). They argue that it has to be possible to produce, consume and act sustainably both at a system level and on an individual level. To do so we have to find new ways of sharing, renting, reusing and recycling (Delad energi, 2020). One of the existing examples in Malmö of a collaboration towards an industrial symbiosis, is between a water treatment plant and an electricity company. Where the electricity company harvests the heat from the water that is being treated and uses that heat for district heating purposes. Even
14
so, there have been found a lot more examples of possible collaborations to maintain an industrial symbiosis strategy in Malmö, and specifically in the industrial harbor. The problem with many of the companies in Malmö, is that they all have a lot of residues from their facilities and they have needs and wants for collaborations towards an industrial symbiosis. They just do not know how to find potential waste flows and collaborations, according to Afry’s pre-work analysis. Multiple interviews have been held with both bigger and smaller actors in Malmö during Afry’s pre-work, and it was shown that an interest for a digital platform to connect potential companies have been great.
15
Influential examples
Kalundborg Symbiosis
In 2006, an article was published about an ongoing project in industrial symbiosis in Kalundborg, Denmark (Jacobsen, 2006). The project evolved into an evolutionary process where a number of by-product exchanges became a web of symbiotic interactions by five different companies within the same area (Jacobsen, 2006). The five included companies were a power plant, an oil refinery, a biotech and pharmaceutical company, a plasterboard producer and a soil remediation company. The material flows from these companies included water, solid waste and energy exchanges. Specifically, the water and steam-related exchanges is important for this symbiosis. Where the wastewater and cooling water from the oil refinery are reused at the power plant. The wastewater for secondary purposes and the cooling water for boilers that are producing steam and electricity and is used for the desulfurization process. In which it produces gypsum for the plaster factory.
Figure 2. Chart over the waste flows in the Kalundborg symbiosis (Jacobsen, 2006).
The industrial symbiosis arrangements made it possible to replace and diversify the intake of water to the power plant and to optimize the energy efficiency of the facility (Jacobsen, 2006). This also made it possible to replace the groundwater with surface water, surface water with cooling water, and cooling water with wastewater. According to the Kalundborg website (Kalundborg symbiosis, 2020), it is the world’s first industrial symbiosis, and there are now nine companies involved in the symbiosis, where one
16
company’s residue becomes another company’s resource. Benefitting both environmentally and economically (Kalundborg symbiosis, 2020).
Digital tools for Industrial symbioses
The tools I have chosen to evaluate are the best-known examples for Industrial symbiosis and material exchange. Most of them are projects that existed for a few years, and only one tool was existing in Sweden.
3.2.1 FISSAC
Fissac is a management software tool for Industrial Symbiosis that is able to support decision making in material flow analyses and industrial clustering (Fissac, 2020). It was a project that ran from September 2015 until February 2020. The Fissac project aims to involve stakeholders at all levels of the construction and demolition value chain to develop methodology and a software platform to facilitate the information exchange that supports an industrial symbiosis (Fissac, 2020). The fundamental aim of the software platform is to demonstrate and maximize environmental, social and financial benefits of industrial symbiosis networks and to support a circular economy. The platform can identify opportunities, create contact between companies that have an industrial symbiosis potential, provide lists of solution providers, design industrial symbiosis networks, perform feasibility assessment and assess the networks with an environmental, economic and social point of view (Fissac, 2020). This is a tool that is free to use, and can be used by industrial symbiosis experts and by observers outside of the involved companies.
Figure 3. Fissac home page (Fissac, 2020).
This tool has many functions and each function have their own tutorial video. Such as creating a new flow, editing a flow, add a unit process, adding a system model, add facility and network and finally, how to use analysis mode. As an outside observer I find this very complex, and it has
17
too many functions. However, the tool provides a simple overview of the registered flows divided in classifications and units. Such as mass, energy, area, water, air, volume etcetera. Whilst providing a search and filtering function of the flows. Shown in the picture below. Further evaluation of this tool will be acknowledged in the interview phase.
Figure 4. Fissac flow overview (Fissac, 2020).
3.2.2 eSymbiosis
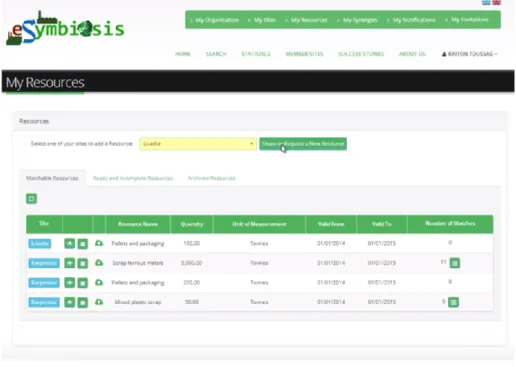
Cecelja et al. (2015) introduced a paradigm for industrial symbiosis using semantics to model industrial symbiosis flows, enabling technologies and to systematize the development of a matching service for companies (Cecelja et al., 2015). This was done using a system engineering approach using tacit knowledge from industrial symbiosis experts and explicit knowledge from industrial symbiosis participants (Cecelja et al., 2015). They argue that an industrial symbiosis strategy relies on manual interpretation of data in the course of face-to-face communication and case-by-case analysis by the users. The users access and interpret data collected from industry, combining them with other data that is stored in databases that are built to monitor the industry activity and databases that offers access to case studies (Cecelja et al., 2015). The eSymbiosis service was a project that was active between 2010 and 2014, that resulted in a knowledge-based service that had the aim to promote, demonstrate and advance industrial symbiosis in Europe (eSymbiosis, 2020). The main functions of the web service are company registration of their functionalities and their possibilities for synergies, and the output from this information is a company match making (Cecelja et al., 2015). Cecelja et al. (2015) presents a case example where an aluminum casting company explores ways of disposing aluminum waste. The manager of the company registers the company with the eSymbiosis service by creating a company profile, and the type and details of the resources for disposal (Cecelja et al., 2015).
18
Figure 5. Organisation profile input (eSymbiosis, 2020).
The second step includes providing the service with details about the waste. These details are registered through using available classifications from a given list in the system. The system then reviews the information and matches it based on the description and the property (Cecelja et al., 2015).
19
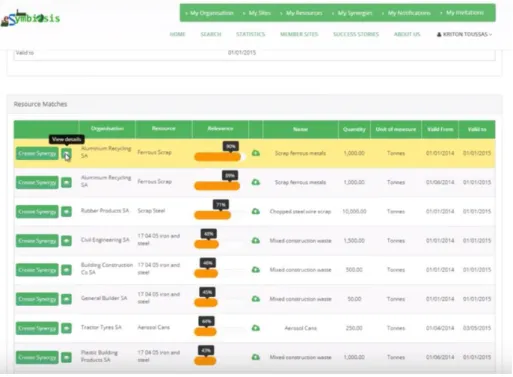
Figure 7. eSymbiosis creates possible matches (eSymbiosis, 2020).
Since this project does not exist anymore, all I can access is a tutorial video from the eSymbiosis website. It is a text-based tool and the match making service provides relevance for synergies in the form of percentage. The user can then select which company they want to create a collaboration with and proceed with sending messages to each other through the tool, and finally register a new synergy as “complete” in the tool. Registering existing synergies in the tool seems to me like a way to keep statistics of the new synergies created with the help of this tool, and not a useful function aimed for the user.
3.2.3 Loop Rocks
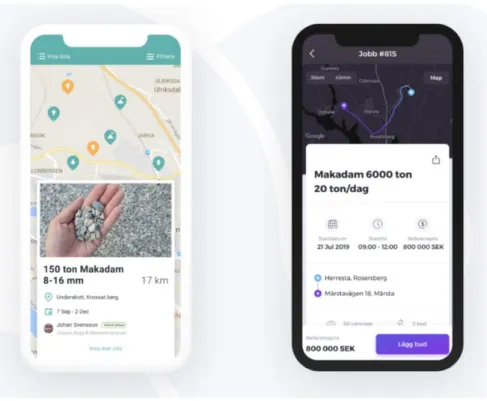
Loop Rocks was a project for maintaining a material circularity within the construction industry. It is a digital marketplace for stone and aggregate material (Loop Industries, 2020). The project was owned by the construction company NCC together with Loop Industries, and unfortunately, has now been cancelled. According to an article in the Swedish magazine Miljö & Utveckling in 2019, the project was cancelled due to timing and the lack of profitability (Lindholm, 2019). The project was supposed to create a smarter way of processing soil, stone and aggregate. Both between companies and between private actors.
20
Figure 8. Loop Rocks platform (Loop Rocks, 2020).
This tool is the only known used in Sweden, and according to interviews with E.On. and SYSAV, they had knowledge of it but was primarily active in the Stockholm region. It was not focused on creating collaborations, it was rather a tool for selling the material and having the buyer pick it up. The negative aspect of this is the lack of opportunities for relationship building. It is a one-time collaboration and nothing that sustains.
3.2.4 Excess materials exchange
Excess materials exchange is a closed web service for paying customers that, according to their website, are a tool that can play a part in creating a more viable planet (Excess materials exchange, 2020). They want to do that by showing the financial and ecological value of waste materials and by-products. At a Tedx talk, Maykee Aimée Damen presents the technology as a dating site for waste and secondary-materials, and as a technology where they match supply and demand of materials and their highest value of reuse option (Damen, 2020). The aim with this technology is to show that there is wealth in waste and to minimize the amount of waste immensely (Damen, 2020). This is achieved in four steps. By resources passport, tracking and tracing, valuation and matchmaking (Excess materials exchange, 2020). The resources passport is a modular format which gives an overview of the composition, the origin, the toxicity or deconstructability of the waste material or product (Excess materials exchange, 2020). Through tracking and tracing identifiers like barcodes, QR codes and chips, they match physical materials to their digital twin in the Resources passport, following the material through their life cycles. Then, the maximum potential is valued and the financial,
21
environmental and social impact is calculated for the costumer. They then create a matchmaking between companies in order to find unique and innovative solutions, and provides them with a link to continue their collaboration (Excess materials exchange, 2020).
Even though they try to explain how it works, to me as a reader it is still unclear. It is unclear how this web service operates and how they match companies based on their specific waste products, how they track the materials and calculates the potential business matches. It seems to me a bit too complex and since it is a service for paying customers, it cannot fit every company. It is hard to understand and to get an interest in the service when you can’t test or get an overview of it.
3.2.5 SHAREBOX
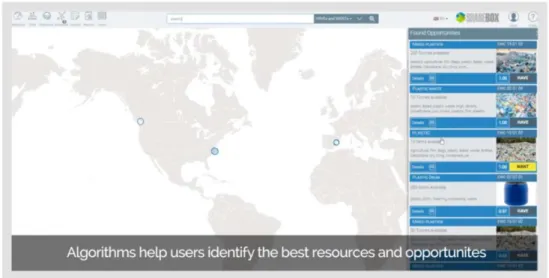
Sharebox presents their solution for resource efficiency on their website. Their approach centers on workflow that covers from the identification of new symbiotic synergies through optimized connections among companies and organizations in established symbiotic relationships (Sharebox, 2020). Sharebox will provide plant operations and production managers with the reliable information that they need in order to effectively and confidently share resources, such as plant, energy, water, other residues and recycled materials, between companies (Sharebox, 2020). The online tool functions as a management tool for Industrial symbiosis and as an anonymous marketplace for companies to trade waste materials and by-products. The companies share the information about what kind of resources they have, and algorithms based on artificial intelligence helps the users identify the best opportunities for collaborations and evaluates opportunities for water treatment and energy conversion technologies. The companies can then choose to communicate through the platform while still in control of the confidentiality of their company data (Sharebox, 2020).
22
This tool works as a matchmaking tool for companies and provides examples and opportunities for collaborations. As I understand it from the tutorial video, the user can then choose from these examples and proceed from there. From what I can see from the website it seems to be better designed visually than other tools. Providing a map function for overview and a clear structure. Nevertheless, the map overview is a map over the whole world. Therefore, it does not provide any geographical proximity between companies. This tool offers complete control over the shared company data though providing privacy settings. The tool calculates the costs of a waste material or a by-product and the companies can communicate through the tool as well.
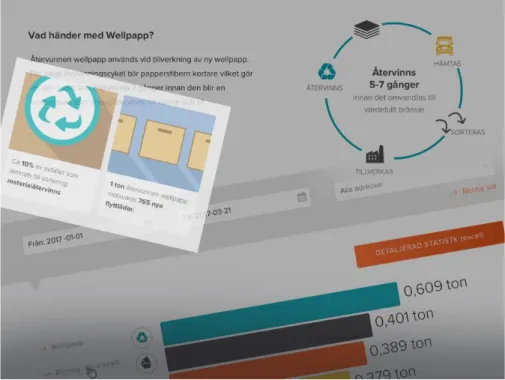
Renova digital platform
InUse (2020) published on their website a design solution that is called the Renova digital platform. It is a customer portal that provides businesses with tools to use for operational and strategic sustainability work (InUse, 2020). It is presented through a Vimeo video as a portal that encourage behavioral change when it comes to waste management (Finalist 2019: Renova portal, 2019). The portal helps to put numbers from an excel sheet into something that is easy to understand and can be used on a daily basis (Finalist 2019: Renova portal, 2019).
Figure 10. The Renova customer portal (InUse, 2020).
I proceeded with a meeting with two of the designers for the portal, in order to get to understand how it works and how it is designed. The portal transform text into simple and understandable statistics about a company’s waste and recycling. They told me that it is a tool for managing your waste pick-ups, the
23
amount of waste and what kind. Through a solution like this, companies can save time and money by sorting as much waste as possible before it goes to recycling and they have easier access to the recycling pick-up service. They as well have easier access to their own waste statistics and the tool provides opportunities to get better at waste management and therefore, creating an environmental benefit. The portal is also a tool for learning as it presents the impact recycling has and what the material are being used for in a later stage. The portal’s design is focused on simplicity with a lot of color-classifications, illustrations and categorizations to make it more visually pleasing since the designers did not want to use a lot of text and real pictures of waste and waste bins for example.
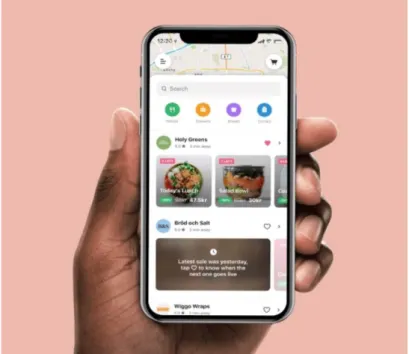
Karma
I have as well chosen to look at Karma as one example of a smaller scale circularity between companies and private actors. Karma (2020) is a digital solution that aim to reduce the food waste from restaurants, cafés and grocery stores. On their website, Karma (2020) writes that the food industry is unsustainable in its attitudes towards waste. Karma wants to change this whilst turning it into a business opportunity. Their solution is a connection of the surplus food from retailers to the consumers for a lower price. This results in great food for less and the business receive an additional income and maximizing their resources. All whilst reducing the food waste (Karma, 2020).
Figure 11. Karma application (Karma, 2020).
The Karma app notices the user’s locations and provide an overview of restaurants, cafés or grocery stores close by that have left-over food to sell at
24
a cheaper price. The seller presents their dishes and what time the user can pick up the food. The user then pays for the food through the app.
25
Methodological approach
As an interaction designer, I am aiming towards creating a bridge between Transition design and Industrial Symbiosis. To achieve this, I have been using Research through design, according to Gaver (2012), as an approach.
Research through design
Research through design, according to Gaver (2012), can be whenever a practitioner evaluates and describes their influences for a specific design, reflects on their importance and similarity and discusses their decisions. Another example can be when practitioners borrows conceptual perspectives from other disciplines. Borrowed theories are often used to inspire new designs or to articulate an existing one (Gaver, 2012). The knowledge is therefore, found in the whole design process. According to Gaver (2012), design is an activity that involves many different decisions, and dealing with different kinds of artefacts and factors situated within a specific circumstance and production. Design, and research through design, can be performative, generative and suggestive. Creating what might be instead of what it is, and to create the right thing. It is to create theories that are sometimes right (Gaver, 2012).
In this thesis project, this will be achieved through studying alternative design solutions, performing field research and user interviews, customer journey mapping, flowchart design, prototyping and usability tests. Whilst using theories from Transition design and Industrial symbiosis.
Interviews
Alan Cooper (2014) writes about interviews with subjects of matters. The authorities on the domain within the product will operate. These can be trainers, managers, consultants or other experts (Cooper, 2014). They can often provide valuable perspectives on a product and its users, but it is important to know that they can have a skewed perspective on the subject since often are very invested in the area (Cooper, 2014). If you are designing for a complex or specialized domain, such as Industrial symbiosis, interviews with subject matter experts will be necessary for guidance and a good way for gaining information about the industry and its regulations. Interviewing potential users for a design is essential for getting to know the user’s personal view on a design or product, and lets us know the user behaves and thinks about things (Cooper, 2014). Important areas to learn more about are the context of how the product will be used, their needs, current tasks and behavior, their goals and motivations, their expectations and potential problem and frustrations in their current situation (Cooper, 2014).
26
Service design methods
4.3.1 Customer journey mapping
Accordning to Stickdorn and Schneider (2010) a customer journey map provides a structured visualization of a service’s user experience. The touchpoints where a user interacts with a service is often used to construct a journey, and often includes the emotions of the user that is interacting with that service (Stickdorn & Schneider, 2010). The touchpoint in a service can be many things such as face to face contact between individuals, virtual interactions with a website or physical trips to a certain building. A customer journey map provides an overview of the factors that are influencing a user experience, and is constructed from the user’s perspective (Stickdorn & Schneider, 2010).
Flowchart
According to Visual Paradigm (2020), a flowchart is a graphical representation of steps. It was originally used in computer science as a tool for representing algorithms and programming logic. Now it is often used to visualize processes and the structure of problems and tasks, and it can be used to define a project that is going to be implemented (Visual Paradigm, 2020).
Prototyping
Sharp et al. (2015) explains a prototype as a manifestation of a design that a potential user and stakeholders can interact with and explore its suitability. A prototype often emphasizes on a set of characteristics and de-emphasize others (Sharp et al., 2015). Prototypes are useful when discussing or evaluating ideas with stakeholders and acts as a communication device among team members (Sharp et al., 2015). They can also be used as a way to test out the technical feasibility of an idea or to clarify requirements (Sharp et al., 2015).
Usability testing
A usability test can quickly reveal an enormous amount of information about how people use a prototype (Kuniavsky, Goodman & Moed 2012). The tester of a prototype should typically be someone who fits the target group for the product that is being tested. Through usability testing the researcher can see whether their assumptions about the how people use the design are true or false through presenting series of tasks to perform on the prototype. The successes, misunderstandings, mistakes and opinions are then analyzed (Kuniavsky et al., 2012). Based on the gathered information, the common issues and observations are compiled and used for making iterations on the prototype (Kuniavsky et al., 2012).
27
Design process
Interviews
5.1.1 Field research interview
For the first part of the interview stage I chose to involve a waste water engineer in Stockholm, and asked them a few questions regarding the water purification process, and what their thoughts are on industrial symbioses. The interview was held through an e-mail connection. The engineer explains that they work with pumping stations, sewer plants and water treatment plants in the municipality. Where they use gray water, meaning water from sinks and showers, and drinking water. The engineer further explains that the drinking water comes from ground water in the area and from surface water from lake Malar processed in another water treatment plant. Ground water is the water that is extracted from beneath the earth’s surface, and surface water from lakes, rivers or wetlands. Shortly a water treatment process consists of the black water, meaning water from toilets, and grey water that are pumped through pumping stations to the water treatment plants where it gets cleansed through being put though a grid where paper, cloths and other bigger objects gets filtered out. After that process chemicals are added to the water to separate sludge from the water. By doing this, the clean water can be sent out, in this case to the Baltic sea, and the left-over sludge is being treated in the facility in order to extract as much water as possible, in order for it to be as light and concentrated as possible when being transported away from the facility.
When asked about the knowledge of industrial symbiosis from an inside perspective, the engineer does not have much knowledge about it, and also explains that the water treatment plant is not placed nearby any other facilities that could possibly benefit from such a strategy. On the other hand, the engineer explains that the sludge could previously be used and bought as fertilizers on crops, but today the sludge needs a specific certificate in order to be used as fertilizer, and is instead brought out as waste.
5.1.2 Interviews about existing tools
With the purpose of getting to know the field more, and to get to know which kind of tools for industrial symbiosis that have existed or exist, I contacted a researcher in industrial symbiosis from Linköping University, Murat Mirata, and as well two master students in civil engineering in energy and environmental management with a master in sustainable development. These interviews were held partly through e-mail contact and partly through a teams-meeting call.
Mirata’s opinion and experience of digital tools for helping an industrial symbiosis were limited but still valuable. He had tried to use two tools; eSymbiosis and FISSAC without success. Claiming that the tools were too
28
difficult to use and that he could not find the right industry code, to name one of the difficulties. The researcher continued by explaining that he had an inherent bias against tools that claim to be able to identify synergy possibilities, and instead believes that information and communication technology (ICT) systems should support the community in order to transfer knowledge and to encourage innovation (Mirata, email communication, April 2, 2020).
The two master students are currently working with mapping out methods for finding new synergies between different industries. Thus, they had some experience with using and analyzing different existing tools for industrial symbioses. Primarily FISSAC. Their general opinion was that it is too time consuming and too difficult to learn how to use it. They mentioned that FISSAC claims to be a complete tool to use, but fails to engage users and actors which is an important part in maintaining a collaboration. They also noticed that the tool focuses on bigger companies, which means that synergies between smaller companies gets lost. Their two main outtakes from their work and working closely with different companies was, firstly, missing in the digital tools today is the importance of communication and contact between the companies involved. Many times, even if there is a collaboration of some sorts and a close proximity of the companies, there is still no clear way of contact between the two. Secondly, the lack of time for using a complex tool where you have to learn how to use and manage it. Since the tools often need a lot of information input in order to work properly. They finished by stating that marketing and a clear purpose are important for companies to continue using it.
5.1.3 User interviews
The intended users for the tool will be industries and companies located foremost in the industrial harbor of Malmö. Afry had previous been in touch with VA syd, SYSAV, E.On. and Copenhagen Malmö Port, who are four important actors in the harbor and in Malmö, and had previously expressed interest in developing their collaborations with other companies to find new potential synergies. Therefore, it was important for me to contact these companies in order to know their needs and wants, and how a digital tool could possibly assist with that. All interviewees were potential users of the platform within the company, and all had great understanding of how their company currently works with sustainability and waste flows. All interviews, except one, were held though video meetings together with one colleague from Afry. Interview questions found in Appendix I.
5.1.3.1 E.On.
E.On. is an electricity company with a focus on delivering sustainable energy. E.On. explained that 60% of their production comes from cooperation and taking advantage of waste products and flows, such as water, waste material from SYSAV, with a carbon company creating district heating, biogases and so forth. An important aspect for E.On, since they are not handling tangible
29
materials, are the infrastructure. Which means that the location and proximity of connected companies are very important in order to transport electricity, heating, biogases etcetera. They continued by explaining that the district heating system for example, is a sensitive construction. It includes confidential information about where and how their district heating system is located and cannot be shared on a public platform.
Regarding a digital platform, they saw the potential in using a map overview of the neighborhood showing existing companies and their resources. As a way for the City to use when planning where new companies could establish, based on the current infrastructure. Interesting to see about a waste resource from another company would be type, amount, certificates and continuity of the resource. Existing collaborations would be less interesting, since that could mean that it can become an overview of who pays and who brings in the money in a waste resource collaboration, which can easily turn into confidential information for companies.
5.1.3.2 VA syd
VA syd is a waste water company that handles all types of water, specifically black water in the industrial harbor. Today they have a collaboration with E.On. who takes care of residual heat and biogases. Potential flows coming from VA-syd could be residual heat, sand and different levels of purified water. They continued by explaining that cooling for different processes and chemicals for purifying water could be potential needs for collaborations. The proximity and infrastructure are very important for this company, since potential collaborators need to be connected to the water pipe network, and installing new pipes can be costly. They explained that if they found a need and interest for a flow they could also create new flows. Such as purifying water or sand into the different levels of need.
Regarding the digital platform, the company expressed the need for communication outside of the platform, but a platform could help getting in contact with the right employee, by presenting the department, job title and name of important employees in other companies. Noting that it will have to be up to date with existing flows and also with contact information. When talking about potential confidentiality issues on a public platform, they did not see any restraints since they already are a public service, and they need to be transparent with their business and processes.
5.1.3.3 SYSAV
SYSAV is a waste management company with a sustainable way of working. Currently they have a standing collaboration with E.On. through district heating. Furthermore, they are selling waste metal to foreign companies and are planning on a collaboration with VA-syd with water, heat and biogases. During the interview, they were very positive to using a tool like this and as well interested in seeing how other companies work with residual flows. In the contrary to the other interviewed companies, they had tried Loop Rocks as a tool for a small period of time. They saw a benefit in showing possible
30
logistics and transport on a digital platform, since they are handling a lot of different materials. Specifying the quality of a specific waste material is important to publish. Similar to VA-syd, they preferred to be able to send a notice of interest though a platform, and then handle the dialogue themselves. Like VA-syd, this is also a public service, so they had no restrictions regarding what data to show on a platform. They found that a public platform could be useful in marketing purposes by marketing the way they work with sustainability and recycling materials. Hopefully inspire other companies to do the same and re-thinking their handling of waste materials and by-products.
5.1.3.4 Otto bygg
I continued the process with contacting smaller industries and companies in order to understand their need for a service like this. Otto bygg is a construction firm. During the interview and though previous e-mail contact I understood that they already have a strong focus on sustainability and waste minimizing. They are strictly working towards a goal to minimize waste and to create a circular economy. Meaning that they, the architectures and builders, need to thoroughly plan their material orders for a construction site. If there is any type of waste, they use it at the next site.
Since they already have a working system and do not have a lot of pure waste, and since they need to plan their way of working and what materials to use about six months ahead of a construction, they did not see a great need for a platform showing continuous waste and resource flows.
5.1.3.5 Betongindustri AB
Betongindustri AB is a company that strives to create concrete for a climate neutral construction. Their main waste materials are sand and water. They currently have a collaboration with a company that picks up waste concrete and turns it into concrete for roads. When creating concrete, they reuse their own water, storing it in pools. They saw a potential for new collaborations in using demolition concrete, district heating and heat from biogases.
Most important for them to show on a public platform are logistics possibilities and the quality of the different materials, such as sand, gravel and water, since it is crucial when making concrete.
5.1.4 Conclusions
The conclusions gathered from all user interviews regarding the use of a digital platform were the following. There is no need for “match making” between companies or to show existing collaborations as previous tools have done. The platform should instead provide an overview of existing flows in an area. Specifically, a map overview can be used for showing important information about infrastructure, possibilities for logistics and for new companies to establish. They found that there is a need for balance in the description of the waste flows. It cannot be too complex but not too simple either. As there is a need to specify the quality of each waste materials. Such
31
as what type and quality of plastic, metal, water and sand etcetera. A filtering and search function could be useful, which means there have to be categorizations and classifications made on the platform. The preferred way of contacting other companies is through own e-mail or telephone, but it could still be useful to send a quick notice of interest through the platform. This is handled through one main contact person within each company, that handles the first contact and distributes the contact information further if needed.
Customer journey mapping
The purpose of the digital platform is that it needs to facilitate a social process that exists outside of the platform. Therefore, I created a customer journey map. The map visualizes a company’s experience before, during and after they have interacted with the platform. It shows their actions, touchpoints and experience including simple emotions. I developed this based on the user interviews, showing what factors that are influencing their experience, their needs and the outcomes of establishing a new collaboration. The customer journey map shows the experience from the company’s side, and not the individual person’s experience, since it can be difficult to map out who in any company will be in charge of the industrial symbiosis collaborations and therefore, who will use this tool. Based on knowledge from the interviews, there is often not a specified job title working with this, and neither is there any existing tools that have been used in a similar manner, so there is a lack of experience. Therefore, the map shows the company’s need for more collaborations and synergies supporting Industrial Symbiosis with explaining that they have a company goal to minimize their waste, but they do not know how to find new collaborations.
32
In the Customer journey map (Figure 12) the company gets aware of the platform through marketing from Afry and Malmö City, and through the platform they get an overview of what kind of flows, waste materials and by-products exist in their area. When an interesting synergy have been found, the company can send a notice of interest. The other company can then choose reply if they also are interested and a connection have been established. The two companies sign agreements for further collaboration which ends in contributing to a better environment and to a circular economy whilst saving money and contributing to creating a community.
Flowchart
Since the area is complex and working with companies as the main user for this platform, and about data that needs to be processed and published on a public platform, I therefore, proceeded to develop a flowchart. This was useful for defining what main functions the tool will need to have, in which steps the platform will need information input and what kind of information will be needed.
Figure 13. Flow chart over main functions.
The Flowchart visualizes the log-in process and shows the main components of the platform by showing the menu and the content in each page. The home page or overview page, page for further contact information, managing flows and resources, managing account and company information, about the platform, and a button for logging out.
33
The service will be free to use, but companies will need to register their account information in order to access all functions. As a free service, it will be available to both bigger and smaller companies. The log in process is important because in order to contact other companies, there need to be a registered contact person for your own company. This is something companies will need to specify when reregistering an account. If you are a visitor and not logged in through a registered account, it is possible to see a restricted version of the map overview and its registered flows and resources. Creating a flowchart specifically helped me narrow down and sketch out what kind of information input will be needed in registering a company account and registering waste flows. For an account the most important would be a name, address, contact information and a small introduction in free text. This is optional and the companies can choose if they want to publish this information or not. Same with the waste flows. The user will name the flow, chose what kind of unit, type, classification, cost and write additional information if needed.
Prototype
The Hi-fi prototype was made in Figma. I chose to create a web platform because there is an easier access to it. This platform will be responsive, and therefore, functional on a mobile phone as well. The purpose of the platform is to show an overview of waste flows and materials in the industrial harbor of Malmö, creating an easy connection between companies that had not been connected before. As well to create a knowledge within companies how to work sustainable with their company’s waste and residues. To be able to do so, it has been important to notice the restrictions and considerations when publishing organizational information on a public platform, and had to map out what main functions the platform needs to have, and to create a base for Afry’s continuous work with developing this platform.
I used the material that Afry had from their research studies along with material from the interviews to create a few examples of flows that can or do exist in the area. Since the target group speaks Swedish and will use this platform in Swedish, I made the prototype in the same language. Link to the Figma Prototype in Appendix II.
34
Figure 14. Examples of flows for the prototype.
I proceeded with building the foundations for the prototype and its functions in Figma, and continued with adding the details in the interaction and layout. Like it is explained in the flowchart and the customer journey map, the user can log in or register an account, explore the overview with companies and their waste flows, send notices of interest, add and manage their own flows and needs, use the contact form overview and read more about the vision for the platform. The overview consists of a map of the industrial harbor. The map can provide an overview of the infrastructure and creating opportunities for city planning, and is also a way for users to get to know their neighborhood better. When not logged in, the user can only access a shorter information about the existing flows, and no company information. In the full overview the companies are visualized as different types of icons pinned on the map, weather it is a company, a facility or an industry. The waste flows, such as water, sand, heat and wood residues, are visualized as an icon next to a company icon. If the waste flow is not specified or categorized as “other”, an icon with three dots are displayed instead. The waste flow needs are shown through a plus sign icon, since it is something they want to have. When hovering over the company or industry icon, the user can read more about the company. When pressing the waste flow icons, the user can see the specifications. Such as amount, classification, type or the ability to provide logistics. The user then has the choice to send a notification of interest through the flow information box. This notification goes directly to the registered contact for the significant company. If both companies are interest in a collaboration, further dialogue will happen and sharing more information with each other in order to proceed with negotiations and contract signing.
35
Figure 15 & 16. The overview before loggining in and after.
As Cohen-Rosenthal (2000) writes, the social process is important when trying to build an Industrial symbiosis network, and a digital match making solution cannot help with that. It is about the ways humans make choices, their willingness to seek new connections and to explore the possibilities of the world (Cohen-Rosenthal, 2000). Tonkinwise (2020) adds to this by arguing that important for change for transition, is the social connectivity, investment and willingness. Therefore, I wanted to highlight the fact that the companies have to create the contact themselves and the platform is only supposed to show the possibilities, not create contacts for them. The purpose of creating an overview likes this, is to make it possible for the user to explore the neighborhood, learn more about their industrial neighbors and the freedom to make own decisions. To make it easy to create the first contact with another company, I added the possibility to send a notice of interest through the description of the waste flow. This will be sent directly to the registered contact within that company. As an additional function in the platform I added a page for seeing specific contact information within all registered companies. Listing employees name, title, a description of their area of responsibility, and a link to a contact form.
36
When registering a new account, the user should write their name, address, information about the main contact person and write a short description of their company. Even though this information is needed, they can choose if they want to display this information on the public platform or not by choosing yes or no to the question if the information is confidential.
Figure 19. Registering a new account.
If a user does not want to publish their information, the visualization of that company on the overview map will differ from the rest. Instead of an introduction shown about the company, the user will instead be encouraged to send a notice of interest to the company through their registered waste flows in order to get in contact with them. Shown in Figure 18 below. As Seidmann and Sundararajan (1998) writes, there is a strategic level to the level of information an organization can share, and competition and contracting can make it difficult to share all the details about a specific waste flow. Since it is about buying and selling your companies waste flows and/or services there need to be a balance and a certain amount of choice when writing the information about a waste flow. Therefore, all input on the platform is optional, and a company can specify or explain further in the description of the flow.
37
Figure 20. Company that do not want to share their information shown on the map.
Lastly, when the companies register waste flows, the need for balance in the information input is crucial. Many previous digital tools created for industrial symbiosis have been, according to user interviews, too crowded with information and no room for writing own specifications. When I created the flowchart, I thought I wanted to include cost in the specifications, but decided not to. Much because many of the users in the interviews didn’t see a need for specifying it and it can be hard to put a price on it before negotiations have been made and a collaboration have been established. They can instead choose if the information is confidential or not, adding a custom name to the flow, choosing what kind of unit, type and classifications from a categorization lists, specifying the amount and writing a short description of the flow. They as well can check a box if they have the ability to manage logistics for the waste flow.
38
Usability tests
To get a wide range of input I tested the prototype with the students from Linköping University and VA-syd that previously have been involved, together with a person from Malmö City that is a potential stakeholder for the platform.
5.5.1 Students
The overall impression from the students were that they liked it and it seemed easier to use compared to other tools they have tried and analyzed in their work. Regarding the confidentiality options in the prototype, they thought it was a good idea, but requested that if companies did not want to show their name or location it could be displayed in a separate map or in a different part of the map, but to make it clear that the user still would be sure they are in the immediate area. As a solution for easy communication on the platform the suggested an open forum where companies can ask open questions and anyone can answer, and agreed that the ability to send notifications was useful.
5.5.2 VA-syd
The user test with VA-syd was held with one person who had previously been involved in the research phase. The most important interface problem whe noticed was the icons for the needs. She proposed that these could be the same icons as the flows, but with a different color or shape. She explained that if she were to use this platform, she would be interested in seeing other companies needs and wants in a simple way, and that she would actively look for companies that was looking for a water collaboration. She specifically liked that you do not have to fill in much in order to publish flows or needs, and liked that you could specify them how much you wanted through writing your own text. VA-syd as well expressed that they want to be able to show that one flow can be transformed into another if enough interest exists. They can purify water or sand to the level that the collaborating company have a need for. This is therefore not an existing flow, but is a flow that can be created or modified. This is something they can specify in the free text of each flow. Regarding the filtering function and that the flows are divided into mass, energy, water, air and volume might be a little confusing. She mentioned that water, for example, could fit in under mass, volume and water. On the other hand, she explained that it is necessary to divide it into categories and not using only text, since sand, for example, can be explained as sand or gravel, and can be difficult to find in just a search bar. Lastly, the possibility to send a notice of interest was a simple and quick way to contact other companies.
5.5.3 Malmö City
Malmö City have been involved previously in the prework that Afry had done, and are continuously trying to work actively with promoting industrial