This is an author produced version of a paper published in Universal Access
in Human-Computer Interaction: Access to Today's Technologies : 9th
International Conference, UAHCI 2015, Held as Part of HCI International
2015, Los Angeles, CA, USA, August 2-7, 2015, Proceedings, Part I. This
paper has been peer-reviewed but does not include the final publisher
proof-corrections or journal pagination.
Citation for the published paper:
Ohlin, Fredrik; Olsson, Carl Magnus; Davidsson, Paul. (2015). Analyzing the
Design Space of Personal Informatics : A State-of-practice Based
Classification of Existing Tools. Universal Access in Human-Computer
Interaction: Access to Today's Technologies : 9th International Conference,
UAHCI 2015, Held as Part of HCI International 2015, Los Angeles, CA, USA,
August 2-7, 2015, Proceedings, Part I, p. null
URL: https://doi.org/10.1007/978-3-319-20678-3_9
Publisher: Springer
This document has been downloaded from MUEP (https://muep.mah.se) /
DIVA (https://mau.diva-portal.org).
Analyzing the Design Space of Personal Informatics: A
State-of-practice Based Classification of Existing Tools
?Fredrik Ohlin1,2, Carl Magnus Olsson1,2, and Paul Davidsson1,2
1
Department of Computer Science Malm¨o University, Sweden
2
Internet of Things and People Research Center Malm¨o University, Sweden
{fredrik.ohlin, carl.magnus.olsson, paul.davidsson}@mah.se
Abstract. We are presently seeing a rapid increase of tools for tracking and ana-lyzing activities, from lifelogging in general to specific activities such as exercise tracking. Guided by the perspectives of collection, procedural, and analysis sup-port, this paper presents the results from a review of 71 existing tools, striving to capture the design choices within personal informatics that such tools are us-ing. The classification system this creates is a contribution in three ways: as a standalone state-of-practice representation, for assessing individual tools and po-tential future design directions for them, and as a guide for new development of personal informatics tools.
Keywords: personal informatics, quantified self, state-of-practice, design choices, classification
1
Introduction
The field of personal informatics, although unified by a common theme of individu-als recording and analyzing personal data, remains quite heterogeneous as to why and how this is done. This is especially clear when looking at the broad spectrum of tools used in personal informatics practices. On one end of the spectrum, we find general purpose tools such as pen, paper, and spreadsheet applications [23]. These tools allow for logging and analysis of most kinds of data but are not designed for any one type of logging or analysis, and thus require significant effort from the user. On the other end of the spectrum, we find highly customized tools designed by expert users themselves (cf. [7]). These are very particular to the individuals who created them, and trade a higher up-front time investment for increased customizability, possibilities for insight, or simpler everyday use.
Motivated by the heterogeneity as to why and how individual recording and analysis of personal data, this paper presents an analysis of current personal informatics tools.
?
In Proceedings of the 9th International Conference Universal Access in Human-Computer Interaction, held as part of HCI International 2015, Los Angeles, CA, USA, August 2–7, 2015. Authors’ manuscript. The final publication is available at link.springer.com: http://dx.doi.org/10.1007/978-3-319-20678-3 9
As the range of available tools continues to grow, it is becoming increasingly difficult to compare and contrast the available alternatives. This is not only a concern for end user adoption of appropriate tools – it also holds concerns for the design of and research on digital tools supporting personal informatics.
Establishing a common understanding of the field, determining the state of the art, and identifying areas of opportunity, all depend on having clear descriptions of key features of the design space. Consequently, there is a prominent need for a consistent vocabulary which establishes a common frame of reference for both analysis and de-sign within personal informatics. We thus use our analysis to define a classification system of digital personal informatics tools that describes key similarities and distinc-tions among them. This classification system is a contribution in three ways. One, as a standalone state-of-practice representation of aspects that presently are emphasized in personal informatics tools, two, as a catalyst for assessing individual tools and potential future design directions for them, and three, as a guide for new development of personal informatics tools.
2
Central Aspects of Personal Informatics
Personal informaticsis the primary term within academia to describe activities aimed at self-understanding through collection and analysis of personal data. As part of personal informatics, we include terms that are used synonymously such as quantified self, self-surveillance, self-tracking, and personal analytics [23]. While personal informatics is certainly related to lifelogging it does not capture the whole of personal informatics as lifelogging could be viewed as the act of logging, rather than including potential interest in informing and adapting behavior based on the analysis of the logged data.
In examining the available research on personal informatics, there is a general con-sensus as to what the field is, regardless of the term used for describing the area. The available descriptions are focused on describing the practice of personal informatics, however, rather than what makes up a personal informatics tool. The oft referred to def-inition by Li et al. [23, p. 558] is representative of this: “We define personal informatics systems as those that help people collect personally relevant information for the pur-pose of self-reflection and gaining self knowledge. There are two core aspects to every personal informatics system: collection and reflection.” Recent research [32, 38, 29, 22] also regard regard collection of data and analysis of this data that promotes reflection as central aspects. This always yields participatory personal data [36] which is data accessible to the subject it describes. We also see that these practices are distinct from tracking that is not managed by the individual [4, 36].
Furthermore, procedural support can be argued as a third central aspect of support that has been left largely implicit so far. Such procedural support dictates ways that the tool drives, controls, shapes, or otherwise strives to affect the personal informatics practice. The goal with such procedural support is to promote engagement, motivation, or goal commitment and fulfillment. As an example of procedural support, the study by Bentley et al. [3] observed that tool-provided interjections in the form of smartphone notification promoted engagement through a significantly increased user logging fre-quency.
Procedural support can take many shapes in personal informatics tools. Rewards provided by the tool, such as performance-based badges, have been found to influence people’s behavior [16]. In such cases, the tool has built-in notions of what constitutes appropriate or beneficial behavior, quite similar to the design goals found in persuasive computing (c.f. [15]). The overlap is apparent in some cases – such as when Fritz et al. [16] refer to fitness trackers as both being persuasive technology and personal infor-matics tools. The design of personal inforinfor-matics tools has also been suggested to benefit from lessons from persuasive technology [23]. There can however be a conflict between promoting a specific type of behavior, and embracing the “reflective capacities” [4] of users – and individual agency may be denied through restrictive technologies [32].
3
Classifying Personal Informatics Tool Support
3.1 Procedure
In this study, our scope is to explore digital tools that have been designed specifically to support personal informatics. This implies that we have limited ourselves to tools that have explicit functionality for data collection and analysis (thereby e.g. excluding pure visualization tools), as well as support continuous use (thereby e.g. excluding snapshot analyses). The selection of tools for analysis was made by combining the public list from personalinformatics.org [28] with tools the authors already had experience with. This resulted in 71 current and accessible personal informatics tools that were studied further.
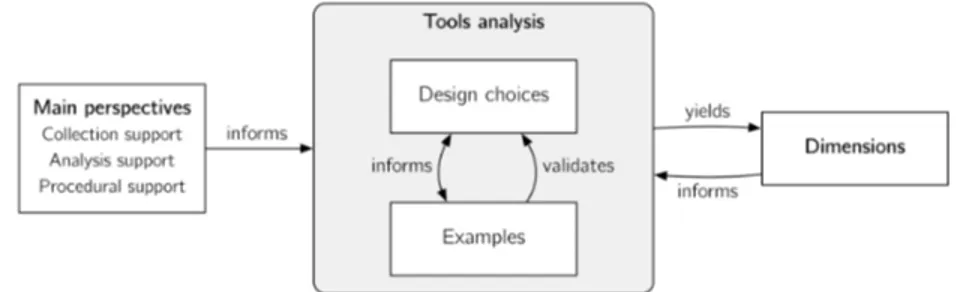
Fig. 1. Approach to generating the classification system
To form our classification system, we analyzed individual tools according to the open coding technique often used in grounded theory research [9]. This meant that we started from the central aspects of personal informatics acting as perspectives on our analysis of tools. This analysis was an iterative processes (Fig. 1), wherein specific examples from tools enabled the identification of design choices in these tools. Similar design choices were then grouped into overarching dimensions. Emerging dimensions then informed further analysis of tools, resulting in additional refinement of design choices and examples, which subsequently yielded additional dimensions, and so forth. This iterative process was repeated until the dimensions reached a stable state, in the sense that further examples did not yield additional design choices or new dimensions.
3.2 The Classification System
The process of analyzing specific personal informatics tools resulted in classification system containing nine dimensions with a total of 53 design choices. These are summa-rized in Table 1 and described below with example from well-known tools. Relying on more well-known tools is a purposeful choice as these are more likely to be known by readers also.
Selection of data to collect. Control over which data to collect varies among current tools. In the most flexible of tools, this selection is completely user-defined. An exam-ple of this can be seen in DailyDiary [10], which prompts users on any custom-defined question. On the other extreme, the selection of data may be predefined in tools that al-low for no customization – such as collection by hardware sensors (e.g. Withings Smart Body Analyzer [42]) . It should be noted, however, that updated display of collected data may give users a different experience, even though the underlying data is the same. There are also variants on user-defined selection which place some additional con-straints on how data selection is made. With predefined data types, the user freely names what is being collected, but maps it to a particular data type supported by the tool. The Reporter application [30] exemplifies this in using the selected data type to customize the entry and visualization screens. Tools may expand upon this by providing user-selectablelist of options which are preconfigured with name, unit, scale, and so forth. In the case of T2 Mood Tracker [39], the user-selectable list is furthermore customiz-able, in effect yielding a combination with the predefined data types. Additionally, tools may support sharable configurations, where configurations not included in the tool it-self can be imported, possibly saving some user effort. In rTracker [33], users can im-port and share ‘trackers’, which can be quite sophisticated, e.g. by including data points calculated based on previous entries.
Temporality of collection. There are four basic types of temporality in the collection of data: continuous, session-based, single entries, and post hoc edit. Continous col-lection is ongoing, requiring no interaction to maintain. Location logging applications such as Moves [26], along with fitness trackers that are always-on, fall in this category. Session-basedcollection implies that data is collected over a period of time delimited by an explicit (and often manually controlled) start and stop. Exercise tracking applications such as RunKeeper [34] are typical examples of this, with collection only occurring dur-ing each specific traindur-ing sessions. Sdur-ingle entries are made at one particular moment in time, as in self-survey applications such as Reporter [30]. Post hoc edit differs from the other three types, in that it concerns modification of already entered data. In Jawbone’s UP Coffee [20] application, this enables batch collection of several entries, which can then be backdated through the edit feature. The post hoc edit may also be used to allow users that have forgotten to turn on for instance a fitness tracker, the chance to enter estimated activities as such omissions may otherwise prevent users from reaching goals they have set due to a handling mistake during use of the tool.
Granted, in some cases it may be difficult to distinguish between the types of tempo-rality. Some tools that ongoingly (e.g. several times a day) prompt the user for manual entry are in effect providing procedural support to collect single-entries either in a con-tinuousor in a session-based manner.
Support during manual entry. Tools that rely on manual entry from users can provide various forms of support for this step. Although in some cases, no support is given, such as with your.flowingdata. This tool relies on direct messages via Twitter for collection, which inherently is free form text, separate from the tool’s user interface. A simple form of manual support is previous entries shown, exemplified by Joe’s Goals [21] where the collection and analysis user interfaces are one and the same. Other tools support re-entry, either by making previous entries selectable (e.g. Reporter [30]) or by suggesting previous entries through autocomplete (e.g. Toggl [40]). Another form of making manual entry easier is inline calculator, where simple arithmetic operations are added to number inputs (e.g. Loggr [24]).
Different types of data can also be shown to assist the user in their manual entry, possibly increasing the validity of the entry. The mood tracking application Expereal [12] exemplifies two such forms of support, by showing both a personal aggregate and a collective aggergate as the user is asked to input the current mood. Another form of support is automatic calculation of derived value, where part of the recorded data is calculated based on manual input and displayed to the user. Such calculations could conceivably be done as part of later analysis also, but tools such as rTracker [33] include the results of the calculation in the collection stage as an aid for manual data entry. Data collection control. The control over initiating data collection differs greatly be-tween tools, and inherently carries qualities of procedural support depending on the design choice made. Tools such as e.g. i.strive.to [18] rely on user-initiated collection, placing the responsibility solely on the user. To alleviate some of the potential down-sides of user-driven collection, such as the risk of forgetting collect on, other tools provide procedural assistance. Scheduled notifications remind the user at predefined intervals or times, and in the case of rTracker [33] the user can configure multiple no-tifications of each type. Randomized nono-tifications also remind the user, but varies the exact times. In the case of Reporter [30], this is described as a feature that facilitates more accurate data through random sampling. Some tools also analyze user data to trigger behavior-determined notifications. RunKeeper [34] exemplifies a simple form of this through push notifications in the form of “Lets work out! You thought this was the perfect time a while back. . . remember?”. Furthermore, RunKeeper also supports social notifications, where the user is prompted to engage in an activity based on the explicit request of a contact. Finally, tools may use fully automatic collection, such as what the location logging application Saga [35].
Form of goal setting. The form of goal setting is a central concern to tools that strive towards behavior change, and dictates how the tool handles how user goals are created. With manual goal setting, goals are handled separately from the tool, meaning that it does not provide any explicit support (e.g. Loggr [24]). One form of support is prede-fined goal types, where the tool provides a list of goals it supports tracking towards, and lets the user select among them. Fitness and activity trackers commonly have these, such as running a particular distance over a fixed period (e.g. RunKeeper [34]). Some tools provide personalized goals, where the achievement for reaching a goal is deter-mined based on previous user data. When starting Breeze [5], as an example, it uses the step count data already available through the smartphone to generate a user-specific daily step goal (which also continues to update).
Another form of goal setting is through crowdsourced goals, where goals defined by others are available for the individual user to adopt. This is the core model of Coach.me [8], which also uses shared goals as social objects around which the users can interact. Default goalsare also visible among the reviewed tools, to which the user is automat-ically committed to rather than actively reflecting on and subscribing to specific goals. An example of this is Fit Simply [13], which by default includes and tracks a series of challenges of (designer defined) increasing difficulty. Expert plans, such as the “profes-sional training plans” of Garmin Connect [17], is also a form of goal setting, wherein a sequence of steps or targets are prescribed.
Table 1. Design choices in current personal informatics tools
Dimension Design choice Example
Selection of data to collect
User-defined DailyDiary [10]
User-defined (pre-defined data types) Reporter [30] User-defined (quantitative only) Loggr [24]
User-selectable (from predefined list) T2 Mood Tracker [39]
Sharable configurations rTracker [33]
Predefined Withings [42]
Temporality of collection
Single entries Reporter [30]
Session-based RunKeeper [34]
Continuous Move [26]
Post hoc edit Jawbone UP Coffee [20]
Support during manual entry
No support your.flowingdata [43]
Previous entries shown Joe’s Goals [21]
Re-entry (selectable) Reporter [30]
Re-entry (autocomplete) Toggl [40]
Inline calculator Loggr [24]
Personal aggregate shown Expereal [12]
Collective aggregate shown Expereal [12]
Automatic collection of derived value rTracker [33]
Data collection control
User-initiated i.strive.to [18]
Scheduled notification rTracker [33]
Randomized notification Reporter [30]
Behavior-determined notification RunKeeper [34]
Social notification RunKeeper [34]
Table 1. Design choices in current personal informatics tools (continued)
Dimension Design choice Example
Form of goal setting
Manual Loggr [24]
Predefined goal types RunKeeper [34]
Personalized goals Breeze [5]
Crowdsourced goals Coach.me [8]
Default goals Fit Simply [13]
Expert plans Garmin Connect [17]
Data analysis control
User-driven ChartMySelf [6]
Notification to check status Breeze [5]
Self-contained achievement notification Fitbit [14] Self-contained data notification Jawbone Up [19]
Goal-keeping notification Basis [1]
Periodic report Basis [1]
Form of comparison
None rTracker [33]
Top list Fitbit [14]
To projection Beeminder [2]
To facets of data Strava [37]
According to user-defined categories Toggl [40] According to automatic categories Mint [25]
Subject(s) of comparison
To self Drinking Diary [11]
To specific other RunKeeper [34]
To group Strava [37]
To collective aggregate Saga [35]
According to detailed demographics Fitbit [14]
Appraisal
None (raw data displayed) rTracker [33]
Relative data Withings Health Mate [41]
General encouragement Basis [1]
Social encouragement Strava [37]
Abstract score (fixed) Nike+ [27]
Abstract score (customizable) RescueTime [31]
Data analysis control. Analysis in personal informatics has traditionally been user-driven, in that the user has responsibility in engaging with the collected data. Many tools fall into this category, such as ChartMySelf [6], which can track many kinds of data, but relies on users actively seeking out the analysis interface. Some tools take on part of the responsibility, and provide notifications to check status. Breeze [5] does this through push notifications in the form “Morning! Curious how yesterday went? We can shed some light!”.
Other tools go further and include pertinent information in the notifications them-selves. Jawbone UP [19] provides self-contained data notifications, e.g. “You got 8h 31m of sleep last night, 106 % of your goal”, while Fitbit [14] provides self-contained achievement notifications, e.g. “Nailed it! You met your step goal for today.” These enable the user to get a status update without any further interaction with the tool. Goal-keeping notificationsare similar, but proactively focused. Basis [1] supports these
through alerts if the user must hit a daily target to meet a weekly goal. A periodic report is more detailed than a notification, but is still a self-contained representation of some aspect of user data. The Basis weekly sleep email report exemplifies this.
Form of comparison. Personal informatics tools can support comparisons in different ways. A tool can have no comparison support, meaning that it provides no such func-tionality beyond displaying the collected data (e.g. rTracker [33]). Other tools allow for comparison according to user-defined categories. Toggl [40] is one such example, where entries belong to projects which themselves can belong to clients, i.e. a clas-sification used for subsequent analysis. There are also tools that support comparison according to automatic categories. This is typified by Mint [25], which classifies ex-penditures of the user, placing them automatically into categories.
Data can also be compared to projection – a core feature of Beeminder [2]. This al-lows the user to evaluate how current performance will progress. Some tools break down data to support comparison of facets. In Strava [37], user are automatically compared according to overlapping “segments” (where the user can also create new segments which affect future comparisons for others). Complete activities or entries can also be compared in top lists, exemplified in Fitbit [14] through a seven day steps leaderboard. Subject(s) of comparison. Not only the form of comparison is relevant to consider, however, as a separate dimension of comparison concerns with whom the comparison is made. A tool may support comparison to self, such as Drinking Diary [11] does when listing several personal averages (last 7 days, last 100 days, etc.) alongside current val-ues. Another design choice exemplified in RunKeeper [34] is comparison to specific other, where “compare friends” is an option in the reports page. There is also compar-ison to groupwhere a specific set of people are included. This is visible when viewing a “Club” in Strava [37], for instance, as members are automatically compared based on multiple aspects. Tools may also support comparison to collective aggregate, concern-ing e.g. a generalized average. Saga [35] does this by providconcern-ing a comparison with its “average user” over aspects such as “Time spent in transit each week”. Finally, com-parison according to detailed demographicsallows for very specific comparisons. This is a feature of Fitbit’s [14] premium service, which can give insights such as “You are in the 33rd percentile of all men and women aged 35 to 44 who are overweight”. Appraisal. The appraisal dimension concerns ways that the performance visible in the user data is evaluated or judged. In instances where when raw data is simply displayed, as e.g. rTracker does, the design choice is to use no appraisal. Relative data is a form of appraisal where the current data is evaluated based on previous performance. The Withings Health Mate app [41] does this in the form of “:( Taking only 6235 steps is the least active you’ve been on a Wednesday”, where the sad smiley makes the desirable direction visible. Some tools provide general encouragement not directly referencing user data, i.e. are based on predefined designer interpretation of what is in the best interest of the user. With Basis [1], when completing a weekly habit (i.e. a recurring goal), it remarks “Keep on keepin’ on; clearly it’s paying off”. The risk involved here is obviously that the predefined interpretation of what is good may not be as relevant to all users. Other tools, such as what Strava [37] uses through its activity feed, allow for social encouragement, where other users give positive feedback (e.g. by giving a “like” or “kudos”).
Furthermore, evaluation of user data may be according to an abstract scoring sys-tem. One variant of this, fixed abstract score, is represented by Nike+ [27] which uses “NikeFuel” as a portable measurement of physical activity. We consider this as fixed because it is entirely determined by the tool (and in the NikeFuel case even according to a secret algorithm). Another variant is customizable abstract score, represented by RescueTime’s [31] “Productivity Score”, which classifies user activities according to predefined but customizable categories, yielding a 0-100 score.
4
Discussion of Implications
In the previous section, a total of nine dimensions and 53 design choices found in cur-rent personal informatics tools – indicating how user practices are enabled, constrained, and shaped presently. It has previously been recognized that personal informatics places a strong emphasis on personal reflection [23, 32, 38, 29, 22]. Aligning intentions of the individual with the design intentions inscribed in the tools is therefore particularly im-portant within personal informatics tools. Failure to do so is likely to cause disruption in the self-reflection process, thus causing breakdown in the central purpose of the tool use. The classification system described in this paper represents a contribution towards the design of personal informatics tools by outlining the current design space. In itself, the examples provided may also act as inspiration for researchers that are considering which tools to use in their own inquiries.
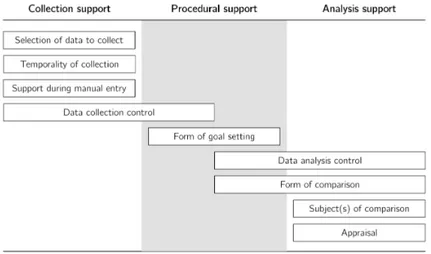
Fig. 2. Relating the classification system to the main perspectives
Three perspectives set the outer boundaries for the design space of personal infor-matics: data collection support, procedural support, and analysis support. As evident in the examples of the previous section, the specific dimensions within these perspectives - depending on the design choices made - may result in the dimensions starting to over-lap the perspectives (Fig. 2). Notably, data collection control and data analysis control contain examples of tools actively driving the personal informatics process, i.e. clearly have procedural elements. With design choices such as goal-keeping notifications and
behavior-determined notifications, a tool may proactively look to engage with the user to affect the user behavior rather than simply monitor or analyze it. While such design choices are explicitly trying to affect user behavior, procedural support can also be more subtle. By supporting or promoting a certain form of goal setting such as Breeze’s [5] automatically suggested personalized goals, a tool can also look to shape user behavior. Similarly, by supporting a particular form of comparison, a tool emphasizes aspects of the personal informatics practice and may push user behavior towards these, similar to Strava’s [37] segments.
An important way of evaluating design choices in personal informatics is the type of engagement with personal data that is promoted. As an example, consider a traditional pedometer which simply displays the number of steps since last reset. One can argue that just being aware of this number promotes a certain kind of engagement, in that the user now has potential to engage with the data though the choices of if, how, and when, remain with the user. The traditional pedometer does not contribute with any form of appraisal, comparison, or procedural support. In contrast, current fitness trackers may make such contributions in very nuanced ways. This ranges from making the numbers of steps relative (e.g. to the previous day or an average), to driving data analysis (e.g. actively notifying of progress during the day) or doing tracking and evaluation on a meta level (e.g. providing points for using various aspects of the tool).
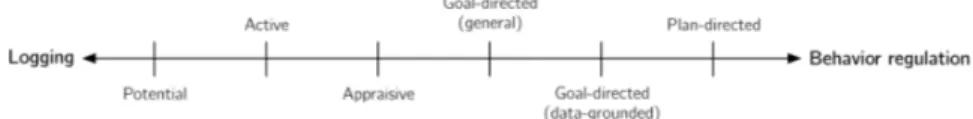
At a basic level, designers must consider the intention of a tool and whether it should promote a specific kind of behavior from the user. Placing logging on one end of a construct and behavior regulation on the other, a continuum for the identified types of engagement with informatics data may be outlined (Fig. 3). On the scale this creates, a classic pedometer would be placed as supporting logging, while a smart and proactive fitness tracker with training programs to follow would rate highly in the supporting behavior regulation.
Fig. 3. Types of engagement with personal informatics data
A further observation that can be made is for the potential conflict between con-venience and flexibility. Previous research has shown that enthusiasts and expert users often rely on custom tools [7], and conscious evolution of practices is a key theme in the enthusiast community [4]. Many of the tools included in our analysis are however activity-specific and quite inflexible – in effect examples of restrictively designed tech-nologies. Such design may lead to denying user agency and control over what and how to track (cf. [32]) Taking a restrictive approach may however be understandable since this may increase product clarity and initial ease of use, something that may be harder to achieve in fully generic and customizable tools.
Striking a balance in the conflicting design ideals of convenience and flexibility may be one of the harder design decisions to take, simply as there are no dominant best practices. Early attempts to address this include design choices such as sharable
con-figurations, i.e. where a user can configure and share a tracker suitable for some metric (exemplified by rTracker [33]). Another attempt is appraisal according to customizable abstract score(exemplified by RescueTime [31]), which initially is completely system-driven but can be customized as personal needs emerge. Exploring new forms of such gradual personalization mechanisms – that embrace the user engagement indicative of personal informatics (cf. [4]) – is a promising future development.
5
Conclusions
In this paper, we have proposed a classification system for design choices within per-sonal informatics that is based on an analysis of current perper-sonal informatics tools. The classification system thus holds an in-practice use emphasis, and may be used as a standalone state-of-practice representation, for assessing individual tools and potential future design directions for them, and to guide new development of personal informat-ics tools. The overall results furthermore have implications for personal informatinformat-ics in showing that end-user practices may be enabled or restricted through the selection of particular design choices.
Future research direction of this work includes establishing design considerations and similar guidelines that promote improved flexibility in personal informatics tools, as well as improved responsiveness to needs of the individual user. We believe this involves further studying procedural support primarily, as this perspective is currently dominated by the goal-setting dimension, with few examples of individualized and tai-lored behavior support.
Acknowledgements. This work was partially financed by the Knowledge Foundation through the Internet of Things and People research profile.
References
1. Basis, http://www.mybasis.com 2. Beeminder, https://www.beeminder.com
3. Bentley, F., Tollmar, K., Stephenson, P., Levy, L., Jones, B., Robertson, S., Price, E., Catram-bone, R., Wilson, J.: Health Mashups: Presenting Statistical Patterns between Wellbeing Data and Context in Natural Language to Promote Behavior Change. Transactions on Computer-Human Interaction (TOCHI) 20(5) (Nov 2013)
4. Boesel, W.E.: What is the Quantified Self now? (May 2013),
http://thesocietypages.org/cyborgology/2013/05/22/what-is-the-quantified-self-now/ 5. Breeze, http://breezeapp.com
6. Chartmyself, https://www.chartmyself.com
7. Choe, E.K., Lee, N.B., Lee, B., Pratt, W., Kientz, J.A.: Understanding quantified-selfers’ practices in collecting and exploring personal data. In: Proceedings of the SIGCHI Confer-ence on Human Factors in Computing Systems. pp. 1143–1152. CHI ’14, ACM, New York, NY, USA (2014)
8. Coach.me, http://www.coach.me
9. Corbin, J., Strauss, A.: Grounded Theory Research: Procedures, Canons, and Evaluative Cri-teria. Qualitative Sociology 13(1), 3–21 (1990)
10. Dailydiary, https://www.dailydiary.com 11. Drinking diary, http://www.drinkingdiary.com 12. Expereal, http://expereal.com
13. Fit simply, http://www.fitly.io 14. Fitbit, http://fitbit.com
15. Fogg, B.J.: Persuasive Technology. Morgan Kaufmann (2003)
16. Fritz, T., Huang, E.M., Murphy, G.C., Zimmermann, T.: Persuasive technology in the real world: a study of long-term use of activity sensing devices for fitness. In: Proceedings of the SIGCHI Conference on Human Factors in Computing Systems. pp. 487–496. CHI ’14, ACM, New York, NY, USA (2014)
17. Garmin connect, http://connect.garmin.com/ 18. i.strive.to, http://i.strive.to
19. Jawbone up, https://jawbone.com/up
20. Jawbone up coffee, https://jawbone.com/up/coffee 21. Joe’s goals, http://www.joesgoals.com
22. Khovanskaya, V., Baumer, E.P.S., Cosley, D., Voida, S., Gay, G.: ”Everybody knows what you’re doing”: a critical design approach to personal informatics. In: Proceedings of the SIGCHI Conference on Human Factors in Computing Systems. pp. 3403–3412. CHI ’13, ACM, New York, NY, USA (2013)
23. Li, I., Dey, A., Forlizzi, J.: A stage-based model of personal informatics systems. In: Pro-ceedings of the SIGCHI Conference on Human Factors in Computing Systems. pp. 557–566. CHI ’10, ACM, New York, NY, USA (2010)
24. Loggr, http://www.loggr.me 25. Mint, https://www.mint.com 26. Moves, https://www.moves-app.com 27. Nike+, http://nikeplus.nike.com
28. Personal informatics tools, http://www.personalinformatics.org/tools/, retrieved 2014-06-06 29. Pirzadeh, A., He, L., Stolterman, E.: Personal informatics and reflection: a critical exam-ination of the nature of reflection. In: CHI ’13 Extended Abstracts on Human Factors in Computing Systems. pp. 1979–1988. ACM, New York, NY, USA (2013)
30. Reporter, http://www.reporter-app.com 31. Rescuetime, https://www.rescuetime.com
32. Rooksby, J., Rost, M., Morrison, A., Chalmers, M.C.: Personal tracking as lived informatics. In: Proceedings of the SIGCHI Conference on Human Factors in Computing Systems. pp. 1163–1172. CHI ’14, ACM, New York, NY, USA (2014)
33. rtracker, http://www.realidata.com/cgi-bin/rTracker/iPhone/rTracker-main.pl 34. Runkeeper, http://runkeeper.com
35. Saga, http://www.getsaga.com
36. Shilton, K.: Participatory personal data: An emerging research challenge for the information sciences. Journal of the American Society for Information Science and Technology 63(10), 1905–1915 (Sep 2012)
37. Strava, https://www.strava.com
38. Swan, M.: The Quantified Self: Fundamental Disruption in Big Data Science and Biological Discovery. Big Data 1(2), 85–99 (Jun 2013)
39. T2 mood tracker, http://t2health.dcoe.mil/apps/t2-mood-tracker 40. Toggl, http://toggl.com
41. Withings health mate, http://www.withings.com/health-mate.html
42. Withings smart body analyzer, http://www.withings.com/smart-body-analyzer.html 43. your.flowingdata, http://your.flowingdata.com