Full Terms & Conditions of access and use can be found at
https://www.tandfonline.com/action/journalInformation?journalCode=gpre20
ISSN: 1748-7870 (Print) 1748-7889 (Online) Journal homepage: https://www.tandfonline.com/loi/gpre20
The end of a trend: retraction of choice in Swedish
elderly care
Henrik Jordahl & Lovisa Persson
To cite this article: Henrik Jordahl & Lovisa Persson (2020): The end of a trend: retraction of choice in Swedish elderly care, Journal of Economic Policy Reform, DOI: 10.1080/17487870.2020.1746660
To link to this article: https://doi.org/10.1080/17487870.2020.1746660
© 2020 The Author(s). Published by Informa UK Limited, trading as Taylor & Francis Group.
Published online: 01 Jul 2020.
Submit your article to this journal
Article views: 68
View related articles
The end of a trend: retraction of choice in Swedish elderly
care
Henrik Jordahl a,band Lovisa Persson b,c
aÖrebro University School of Business, Örebro Sweden; CESifo; IZA;bResearch Institute of Industrial
Economics (IFN), Stockholm, Sweden;cKristianstad University, Department of Economics, Kristianstad,
Sweden
ABSTRACT
In 2009, Sweden launched a freedom-of-choice reform that gave municipalities the option to introduce standardized quasi-markets in social services. The reform was initially popular to adopt in home care until the share of adopting municipalities leveled out just above 50 percent. In recent years, the trend has reversed, and several municipalities have abolished their choice system. Compared with municipalities with choice systems, the abolishing municipalities are more rural with fewer inhabitants. Afixed-effects regression suggests that decreases in the market share of private providers, political shifts towards the left, and increasing costs are related to the abolition of choice systems.
ARTICLE HISTORY Received 28 February 2019 Accepted 20 March 2020 KEYWORDS
Home care; quasi-market; user choice; privatization; re-municipalization JEL CLASSIFICATION H42; L33
Policy highlights
● In recent years, an increasing number of Swedish municipalities have abolished their choice systems in home care.
● A decreasing market share of private providers, political shifts towards the left, and increasing home care costs seem to have contributed to the abolition of choice systems.
● The development emphasizes the importance of municipal discretion and questions one-size-fits-all regulation when it comes to models of municipal service provision.
1. Introduction
Since the 1980s there has been a trend towards privatization in many OECD countries. Both state-owned enterprises and municipal services have gravitated towards the private sector.1 In recent years, however, there are signs of this trend leveling out or even reversing for municipal services. Warner and Hefetz (2012) note that insourcing was almost as common as outsourcing among U.S. municipalities between 2002 and 2007. Gradus, Schoute, and Budding (2019) study service delivery in 20 Dutch municipalities from 2010 to 2018 and discover that inter-municipal cooperation and
municipality-CONTACTLovisa Persson lovisa.persson@ifn.se
© 2020 The Author(s). Published by Informa UK Limited, trading as Taylor & Francis Group.
This is an Open Access article distributed under the terms of the Creative Commons Attribution-NonCommercial-NoDerivatives License (http://creativecommons.org/licenses/by-nc-nd/4.0/), which permits non-commercial re-use, distribution, and reproduction in any med-ium, provided the original work is properly cited, and is not altered, transformed, or built upon in any way.
owned firms have expanded, while private contracting and in-house production have declined. For waste collection, Gradus and Budding (2020) show that, between 1999 and 2014, the number of reverse privatizations exceeded the number of privatizations. In light of these developments, Bel and Gradus (2018) argue that re-municipalization has yet to receive sufficient attention among scholars.2
Since the beginning of the 1990s, private service production has increased in the Swedish tax-financed service sector. The Swedish privatization has coincided with an increase in user choice. A national reform in 2009 enabled Swedish municipalities to introduce a standardized form of quasi-markets in social services.3A majority of muni-cipalities followed suit and implemented local choice systems, primarily in home care for the elderly. Since 2011, however, 14 municipalities have decided to abolish their choice system, and the private market share has stagnated at the national level.
The municipalities that have abolished their choice system have smaller populations and lower population density than municipalities that have maintained their choice system. In this sense, the abolishing municipalities are more similar to municipalities that have never introduced a choice system in home care. Our multivariate analysis suggests that shrinking private market shares, political switches towards the left, and increasing home care costs are related to the abolishment of local choice systems in home care.
2. Choice systems– a background
Choice and voucher systems are central to the concept of privatization as they constitute a market model with a higher level of marketization than the alternative of contracting-out (Savas 2000; Hipp and Warner 2008). On the demand side, consumers have the power to choose between service providers. On the supply side, service deliverers face more flexible options for market entry, production volumes, and service quality. Government support for childcare marketization has coincided with enthusiasm for parental choice in the Netherlands, the US, and Australia (Warner and Gradus2011). In Sweden, the introduction of standardized choice systems in home care has been linked to a larger private production share (Bergman, Jordahl, and Lundberg2018).
A quasi-market with user choice might improve the matching of heterogeneous consumers to appropriate deliverers, and might also raise quality and efficiency by introducing competition (Le Grand 1991, 2007; Shleifer 1998). However, asymmetric information and profit-maximizing deliverers could under certain conditions imply poor quality (Hart, Shleifer, and Vishny 1997; Lowery 1998). An efficient market need not
form for complex services if consumers are uninformed and competition is weak. Moberg, Blomquist, and Winblad (2016)find, in a sample of ten Swedish municipalities, that the information to older people about private deliverers is lacking in critical quality dimensions. Hipp and Warner (2008) analyze job training vouchers to the unemployed in Germany and the US. They conclude that there is need for a better balance between consumer choice, quality control and government oversight.
A choice system could also give rise to social segregation and unwanted di ffer-ences in access and quality, failing to align the goals of consumers, voters, govern-ment, and private deliverers (Hipp and Warner 2008). Amirkhanyan (2007) proposes four broad categories as determinants of local government decisions
regarding privatization: monetary advantages, failure of private markets, government failure, and institutional pressures. Also, increasing transaction costs may make privatization unsustainable for complex services in need of heavy regulation (Hipp and Warner 2008).
The literature on local privatization identifies fiscal stress, economic efficiency, interest groups, and, in more recent studies of social services, also ideological attitudes as the main determinants (Bel and Fageda 2007, 2009, 2017). In the most recent literature survey by Bel and Fageda (2017), contracting out is found to be more common in larger municipalities, arguably since the transaction costs related to contracting are easier to handle with larger volumes. Warner (2006) shows that rural areas in the US are less attractive to market suppliers and raises concerns about the uneven impacts of market-based policies.
Fewer studies have addressed the determinants of vouchers and privatization through choice systems. Merzyn and Ursprung (2005) examine how income and ideology were related to the support for education vouchers among voters in Switzerland. Elinder and Jordahl (2013) compare privatization in Swedish schools (within a national voucher system) and preschools (where municipalities could make discretionary decision on outsourcing).
3. Data
We use municipal-level data on the organization of home care in Sweden. The timing of the municipalities’ introduction and abolishment of choice systems was obtained from yearly accounts of the Swedish Association of Local Authorities and Regions (SALAR). SALAR also provided the data on local governing coalitions. We use data on market share of private deliverers and user satisfaction from the Swedish National Board of Health and Welfare, as well as population size, population density, age structure, income tax base, local election results, and the costs of home care from Statistics Sweden. All data are or have been available online, but when needed, we have received the back catalogue of files from SALAR or the Swedish National Board of Health and Welfare.
4. Quasi-markets in Swedish elderly care
4.1. The free-choice act and Swedish politics
Sweden’s 290 municipalities are responsible for providing elderly care to people from the age of 65. Elderly care is primarilyfinanced by a local income tax and a national grant. User fees amount to only 4 percent of total costs (SALAR2019). Among people who are 65 years or older, 8 percent receive home care, a service which in addition to medical care includes assistance with daily activities such as showering, dressing, and cleaning. The share of people 65 years or older who live in nursing homes is 4 percent (National Board of Health and Welfare2019).
In the 1980s, almost all tax-financed elderly care was produced by the municipalities. Since then, private deliverers have gradually increased their market share, initially via public procurement. In 2009, the Free-Choice Act established that municipalities can–
but need not– introduce choice systems in social services.4Deliverers that meet local standards are allowed to enter the market and consumers have the right to choose between them. The deliverers can be for-profit companies, non-profits, or municipal units.
The Free-Choice Act was introduced by the governing coalition of center–right parties (Moderates, Center Party, Liberals and Christian Democrats) in 2009. Swedish politics is dominated by the same political parties at the national and local level, although some local parties only have representation at the municipal level. During the time of study, one can generalize the Swedish political space into a right-leaning and a left-leaning block (Pettersson-Lidbom2008). The center-right coalition stated the individual’s right to
self-determination as the primary motivation of the Free-Choice Act. Efficiency, service quality, diversity, and experimentation were also mentioned in the government proposal.
4.2. Trends in adoption and abolition
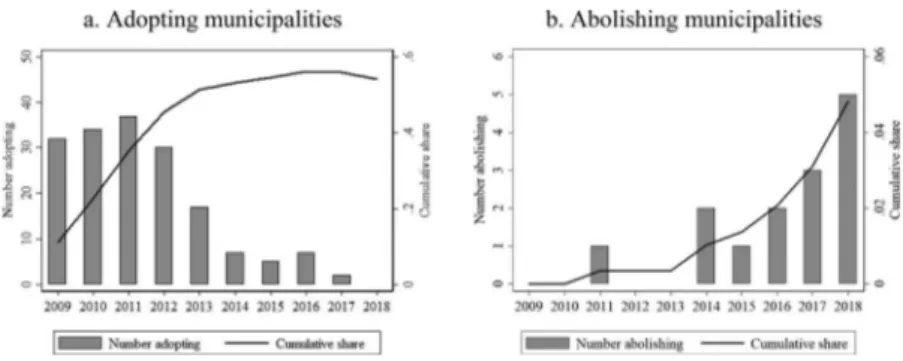
Figure 1a shows the number of municipalities that introduced a choice system in
each year from 2009, when the Free-Choice Act came into force, until 2018. The number of municipalities was over 30 in each of the first four years after the reform was introduced. The pace of reform adoption has since slowed down substantially. During later years only a few municipalities have decided to adopt, and 2018 was thefirst year without any adopting municipality. In 2018, 157 municipalities (54 percent of all municipalities) had a choice system in operation. Similarly, the share of users receiving care from private deliverers increased from 14 percent in 2009 to its peak at 18 percent in 2014, after which it has decreased slightly.
Our primary focus is on the abolition of local choice systems, and the abolition trend displays the reverse pattern of what we observed for adoption inFigure 1(a).Figure 1(b) presents for each year the number of municipalities that abolished their choice system. The number of abolishing municipalities has increased in later years, with the highest
Figure 1.Number of municipalities adopting and abolishing choice systems over time. a. Adopting municipalities. Note: Data provided by SALAR, adjusted by municipal and media sources. Total number of municipalities is 290. b. Abolishing municipalities. Note: Data provided by SALAR, adjusted by municipal and media sources. Total number of municipalities is 290.
number observed in 2018. For most municipalities, the abolition also meant re-municipalization of home care service provision.
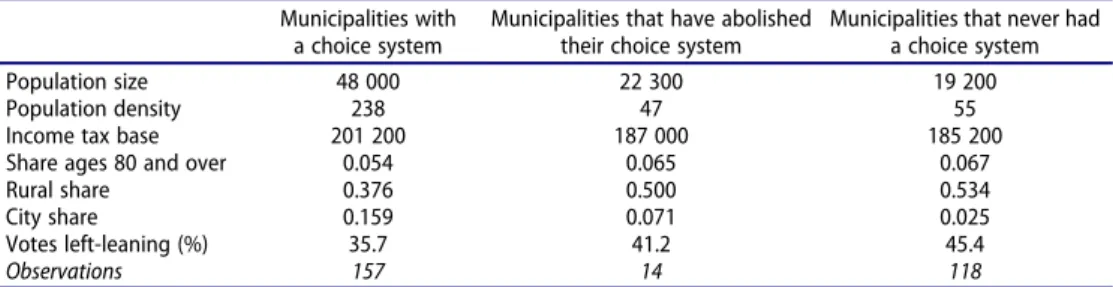
5. Characteristics of municipalities that abolish choice systems
Table 1describes three groups of municipalities: those that have a choice system in 2018, those that at some point introduced a choice system but later abolished it, and those that have never had a choice system. The group of abolishing municipalities is the smallest one with 14 observations. There are pervading differences between the abolishing municipa-lities and the municipamunicipa-lities with choice systems. The abolishing municipamunicipa-lities have smaller population, lower population density, lower income tax base, older inhabitants, and a higher vote share for left-leaning parties (the Social Democrats and the Left Party). Recall that the Free-Choice Act was introduced by the (opposing) right-leaning parties (the Moderates, the Christian Democrats, the Liberals, and the Center Party). The share of rural municipalities is also higher among the abolishing municipalities.5A striking pattern in
Table 1is that the abolishing municipalities are more similar to the municipalities that never had a choice system than to the municipalities that have choice systems.
One explanation behind the geographical and demographical pattern inTable 1is that firms prefer markets with a large customer base in order to reduce transportation costs between the consumers’ homes.
5.1. Change of political majority
According to Table 1, municipalities with relatively low vote shares for left-leaning parties are more prone to adopt and keep a choice system. One can ask whether changes from a right-leaning to a left-leaning local government can explain the abolition of a choice system.
Earlier literature has shown that local parties in Sweden prefer coalition partners that are closely connected along a left–right policy space (Bäck2003). There are three main types of governing coalitions in Swedish municipalities: left-leaning, right-leaning, and mixed. Governments are defined as right-leaning if they include variations of four parties: the Moderates, the Christian Democrats, the Liberals, and the Center Party, and left-leaning if they include the Social Democrats or the Left Party. A mixed
Table 1.Differences between municipalities with and without choice systems.
Municipalities with a choice system
Municipalities that have abolished their choice system
Municipalities that never had a choice system
Population size 48 000 22 300 19 200
Population density 238 47 55
Income tax base 201 200 187 000 185 200
Share ages 80 and over 0.054 0.065 0.067
Rural share 0.376 0.500 0.534
City share 0.159 0.071 0.025
Votes left-leaning (%) 35.7 41.2 45.4
Observations 157 14 118
Note: Data on income tax base is from 2018. All remaining variables are from 2017, except Votes left-leaning which is from 2014. The left-leaning parties are the Social Democrats and the Left Party. One municipality is excluded from the abolishing group, since it re-introduced its choice system after abolishing it.
government consists of both left-leaning and right-leaning parties. The Green Party is treated as a pivotal party that does not change the classification of the coalition. After the election in 2014, the distribution between the three types of local coalitions was fairly even: 100 left-leaning, 90 right-leaning, and 100 mixed governments.
Among the abolishing municipalities, there are four shifts from a right-leaning to a left-leaning government, four shifts (or non-shifts) from a right-leaning government to another right-leaning government, and four shifts (or non-shifts) from a left-leaning government to another left-leaning government. If the two shifts from a right-leaning to a mixed government are counted, shifts away from a more privatization-friendly govern-ment are the most common shift in the abolishing group. While a change in governgovern-ment may have been the determining factor in these municipalities, government changes towards the left still only make up a minority, ruling out a political explanation in eight out of fourteen abolishing cases. There are no cases where a left-leaning govern-ment has introduced a choice system and a right-leaning governgovern-ment later abolished it.
5.2. Private market penetration
The process of introducing and maintaining a choice system has fixed costs. Municipalities have to run an administrative system for compensating deliverers and monitoring service quality. As the provider of last resort, the municipality also needs to be ready to step in if private deliverers decide to exit. For smaller municipalities, thefixed costs of maintaining a system with few deliverers could very well exceed the benefits.
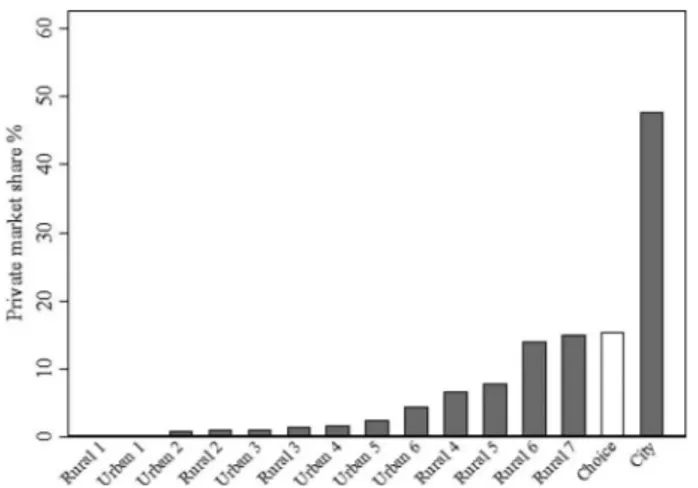
In Figure 2, we show each abolishing municipality ranked from lowest to highest according to the market share of private deliverers in the year before abolishing the choice system. For the municipalities with a zero share in the year before abolishing, we have replaced the data point with the latest non-zero value, if there is such a number.
Figure 2.Market share for private deliverers one year before the abolition. Note: Data provided by The National Board of Health and Welfare. In three cases (Rural 3, 4, and 7) a value of zero is replaced with a non-zero value from earlier years. Municipalities are classified into three categories: rural, urban, and city municipalities, according to the classification provided by The Swedish Agency for Growth Policy Analysis. The bar“Choice” represents the mean among municipalities with a choice system measured in 2017. Thefigure shows data from 14 municipalities.
According toFigure 2, one municipality (Rural 1) that introduced a choice system and later abolished it, never had any active private deliverers.6Private market shares are also low in most of the other abolishing municipalities compared to the 2017 mean among municipalities that have a choice system, which is 15.3 percent. There is only one abolishing municipality with a higher private market share than this mean – the city municipality, with a private share of 47 percent. However, this municipality in the region of Stockholm is a special case. It is the only municipality that seems to have had a determined strategy to continue working with private deliverers even after abolishing their choice system.
5.3. User satisfaction
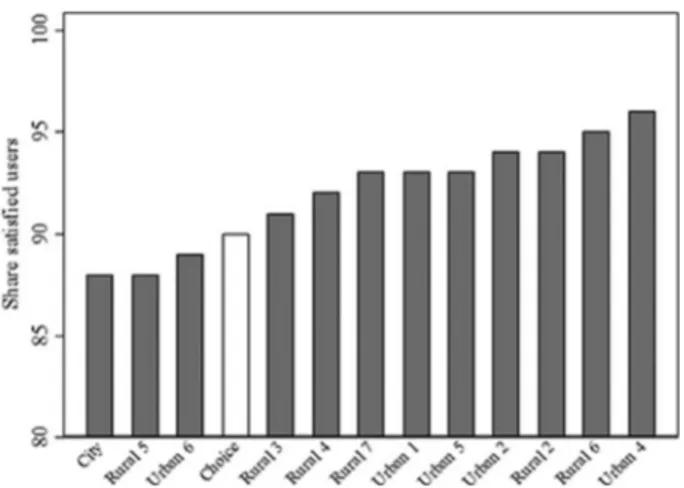
User dissatisfaction with private deliverers is a potential reason for abolishing a choice system. Unfortunately, we do not observe user satisfaction for private deliverers separately. We instead analyze user satisfaction at the municipal level, since local politicians might use abolition of choice as a way to show determination when confronting low overall user satisfaction. Alternatively, inhabitants and local politicians might attribute the previous decision to introduce choice with deteriorating home care services in general.
InFigure 3, we show the level of user satisfaction with home care at the municipal level the year before abolition. Thefigure shows a relatively high level of user satisfaction in the year leading up to abolition. The lowest value of satisfaction is 88 percent, and the highest value is 98 percent. The mean level of satisfaction in choice municipalities in 2018 (90 percent) falls short of the satisfaction level in a majority of abolishing municipalities.
Figure 3.User satisfaction at municipality level. Note: Data provided by SALAR and The National Board of Health and Welfare. Users are asked the following:“How satisfied or unsatisfied are you overall with the home care services provided to you?” Users that respond “satisfied” or “very satisfied” are included in “share satisfied users”. One of the abolishing municipalities (Urban 3) is missing from the figure since abolition took place in a year (2011) when users satisfaction was not yet being measured. Municipalities are classified into three categories: rural, urban, and city municipalities, according to a classification by The Swedish Agency for Growth Policy Analysis. The bar“Choice” represents the mean among munici-palities with choice systems measured in 2018. Thefigure shows data from 12 municipalities.
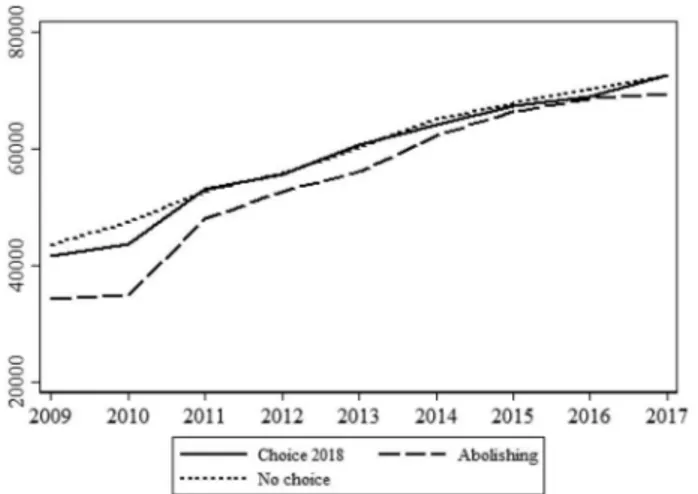
5.4. Home care costs
Figure 4, shows the development of home care costs per individual over 80 years old in the same three groups of municipalities that we presented inTable 1. We show changes over time instead of cost levels the year before abolition. The reason is that costs vary between municipalities based on population density and size in a way that makes raw cross-sectional comparisons difficult. Looking atFigure 4, municipalities with and with-out choice systems display very similar costs over time. Abolishing municipalities, however, start at a somewhat lower cost level, and display a steeper climb.
6. Multivariate analysis
In this section, we test the different explanations for abolishing a choice system in a panel data setting. Although we do not propose that the correlations we present can be confidently interpreted causally, the multivariate analysis has the advantage of using repeated observations over time, thereby differencing out any time constant municipal level variation. Bel and Fageda (2007, 2017) note that many studies trying to explain privatization use cross-sectional data and therefore do not capture the actual switch between different market models. Moreover, cross-sectional data often do not contain information about what preceded and motivated the switch, implying that the correla-tions risk being consequences rather than explanacorrela-tions.
In the regressions, we limit the sample to two election periods: the period that starts with the election in 2010, and that includes the budget years 2011–2014, and the period that starts with the election in 2014 and that includes the budget years 2015–2018. One motivation behind the restriction is data availability; there is no data on user satisfaction in earlier election periods. Furthermore, we only keep municipalities that introduced choice in thefirst election period and that either abolished choice or maintained it in the following election period. This implies that municipalities that introduced and abolished
Figure 4.Cost per individual aged 80 +. Note: Data provided by SALAR and Statistics Sweden. The group“Choice 2018” includes municipalities that had a choice system in 2018, “Abolishing” includes municipalities that abolished their choice system at some point in time, and“No choice” includes municipalities that have never had a choice system.
their choice system within the same election period are dropped from the analysis. These restrictions leave us with 89 municipalities that are observed twice, once in each election period, nine of which abolished their choice system in the second period.
The abolishing dummy constitutes our outcome variable. We collapse all explanatory variables on election period level means and run a Fixed Effects (FE) linear probability model (LPM) regression with two time periods. The regression model is as follows:
ABOit ¼ α þ IVit þ Xit þ Tt þ ci þ Uit
where ABOitis a dummy variable indicating whether the municipality abolished choice
in the second time period, α is a constant, IVit contains the variables that we are
interested in as explanatory variables: market share of private deliverers, user satisfaction, costs per individual over 80 years old, and a dummy variable that indicates whether the municipality has a left-leaning government or not. Xitcontains demographic controls
and a dummy for mixed government, Ttis a time dummy, ciis a set of municipalityfixed
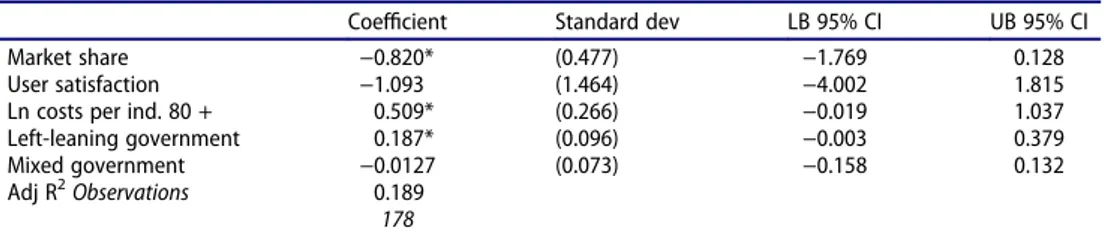
effects, and uitis an error term. We show the results from this FE regression inTable 2.
The estimate of −0.820 for market share implies that a five percentage point (the standard deviation in private market share changes) increase in the private market share decreases the probability of abolition by 4.1 percentage points.
The estimate on user satisfaction is less precise than the other estimates, and we will not comment on its size. We instead refer toFigure 3, and the related discussion, where it was shown that abolishing municipalities did not display low levels of user satisfaction in the year leading up to abolishment.
The coefficient on costs indicates that a 15 percent increase in costs (the standard deviation in cost changes) leads to a 7.6 percentage point increase in the probability of abolishing choice. In Figure 4, we showed that abolishing municipalities have experi-enced larger cost increases than other municipalities. Introducing a choice system comes with somefixed (transaction) costs, that can be a significant burden for smaller munici-palities. Additionally, the municipality loses some of its control over provision, as private deliverers typically have no incentive to hold back their supply of care hours. Increasing costs could, therefore, be an unexpected consequence of a choice system, although this is not a result that can be generalized to all remaining choice municipalities; Bergman, Jordahl, and Lundberg (2018) found that the introduction of a choice system did not affect costs.
Table 2.Panel data regressions: what determines abolishment?
Coefficient Standard dev LB 95% CI UB 95% CI
Market share −0.820* (0.477) −1.769 0.128
User satisfaction −1.093 (1.464) −4.002 1.815
Ln costs per ind. 80 + 0.509* (0.266) −0.019 1.037
Left-leaning government 0.187* (0.096) −0.003 0.379
Mixed government −0.0127 (0.073) −0.158 0.132
Adj R2Observations 0.189 178
Note: Standard errors are robust to heteroscedasticity. Nine out of the 89 municipalities are in the abolishing group. All explanatory variables are observed 2011–2017, except for user satisfaction, which is observed 2012–2018. A constant, ln total population and share of individuals over 80 years old are included in the estimation but are not shown in the table. * p < 0.1, ** p < 0.05, *** p < 0.01.
Lastly, going from a right-leaning to a left-leaning government increases the prob-ability of abolishing choice by 18.7 percentage points. This ideological effect is stronger than the effects of private market share, user satisfaction, and costs.
7. Discussion
The Swedish Free-Choice Act of 2009 was closely followed by rapid adoption of local choice systems in home care. In the most recent years, however, an increas-ing number of municipalities have abolished their choice systems and the market share of private home care has declined marginally. We contribute to the literature on re-municipalization by studying potential explanations for why municipalities retract choice systems in Swedish home care for the elderly. Retraction of choice systems is an understudied area compared with retraction of privatization via procurement.
Compared with the municipalities that still operate a choice system, municipalities that have abolished their choice system tend to be rural, with smaller population and lower population density. In these respects, the abolishing municipalities are more similar to the municipalities that have never had a choice system. The abolishing municipalities also tend to have lower penetration of private providers, and their voters are more supportive of left-leaning parties. A multivariate analysis that compares muni-cipalities over two terms of office confirms that the abolition of choice systems is related to shrinking private market shares and political shifts towards the left. Increasing costs of home care are also related to abolition, but declining user satisfaction is not. Since the number of abolishing municipalities is very small, the results from the multivariate analysis should be interpreted with caution.
An interesting question is whether more municipalities will abolish their choice system in the near future. Around 30 municipalities with choice systems had no private deliverer in 2017, and 50 municipalities had a private market share belowfive percent. A majority of the municipalities that have a private market share belowfive percent are rural. The trend reversal documented in this study provides an argument in support of the decision to make the Free-Choice Act optional. Our results indicate that the Free-Choice Act is not as attractive an option to all municipalities, especially in rural settings. Future studies could therefore focus on the market structure of privately produced home care and differences between rural and urban municipalities.
Notes
1. Clifton, Comín, and Fuentes (2006) argue that privatization in sectors such as telecommu-nications, transport and other types of infrastructure in Europe was primarily a pragmatic result of the EU integration processes, rather than being motivated on market-friendly ideological grounds. Warner and Clifton (2014) study how the internationally promoted policy of privatization is received at the local level.
2. Warner (2008) argues that reverse privatizations need not imply a return to public mono-poly, but could instead generate new combinations of markets, democracy and planning. 3. The reform was first proposed and then evaluated in the series of official governmental
reports (SOU 2008:15 and SOU 2014:2). See also Government Bill 2008/09:29. 4. See Government Bill 2008/09:29.
5. The Swedish Agency for Growth Policy Analysis classifies municipalities into three cate-gories: rural, urban and city.
6. The private share for Urban 1 is non-zero but too small to show up in thefigure.
Acknowledgements
We would like to thank Jan Wallanders och Tom Hedelius Stiftelse for financial support. We would like to thank two anonymous referees for suggestions that have improved the paper. We would also like to thank Thomaz Ohlsson at SALAR (Swedish Association of Local Authorities and Regions) for supplying data. All potential mistakes and misinterpretations are our own.
Disclosure statement
No potential conflict of interest was reported by the authors.
Funding
This work was supported by Jan Wallanders och Tom Hedelius stiftelse under Grant 2017-0158:1.
ORCID
Henrik Jordahl http://orcid.org/0000-0001-8857-6116
Lovisa Persson http://orcid.org/0000-0002-2988-6226
Data availability statement
Raw data were generated at the Swedish Association of Local Authorities and Regions, the Swedish National Board of Health and Welfare, and Statistics Sweden. Derived data supporting thefindings of this study are available from the corresponding author L. P. on request.
References
Amirkhanyan, A. A.2007.“The Smart-Seller Challenge: Exploring the Determinants of Privatizing Public Nursing Homes.” Journal of Public Administration Research and Theory 17 (3): 501–527. doi:10.1093/jopart/mul009.
Bäck, H.2003.“Explaining and Predicting Coalition Outcomes: Conclusions from Studying Data on Local Coalitions.” European Journal of Political Research 42 (4): 441–472. doi: 10.1111/1475-6765.00092.
Bel, G., and R. Gradus.2018.“Privatisation, Contracting-out and Inter-municipal Cooperation: New Developments in Local Public Service Delivery.” Local Government Studies 44 (1): 11–21. doi:10.1080/03003930.2017.1403904.
Bel, G., and X. Fageda.2007.“Why Do Local Governments Privatise Public Services? A Survey of Empirical Studies.” Local Government Studies 33 (4): 517–534. doi:10.1080/03003930701417528. Bel, G., and X. Fageda.2009.“Factors Explaining Local Privatization: A Meta-regression Analysis.”
Public Choice 139 (1–2): 105–119. doi:10.1007/s11127-008-9381-z.
Bel, G., and X. Fageda.2017.“What Have We Learned from the Last Three Decades of Empirical Studies on Factors Driving Local Privatisation?” Local Government Studies 43 (4): 503–511. doi:10.1080/03003930.2017.1303486.
Bergman, M., H. Jordahl, and S. Lundberg.2018.“Choice and Competition in the Welfare State: Home Care as the Ideal Quasi-market.” IFN Working Paper No. 1213. Stockholm: Research Institute of Industrial Economics.
Clifton, J., F. Comín, and D. D. Fuentes.2006.“Privatizing Public Enterprises in the European Union 1960–2002: Ideological, Pragmatic, Inevitable?” Journal of European Public Policy 13 (5): 736–756. doi:10.1080/13501760600808857.
Elinder, M., and H. Jordahl.2013.“Political Preferences and Public Sector Outsourcing.” European Journal of Political Economy 30: 43–57. doi:10.1016/j.ejpoleco.2013.01.003.
Gradus, R., M. Schoute, and T. Budding.2019.“Shifting Modes of Service Delivery in Dutch Local Government.” Journal of Economic Policy Reform, https://doi.org/10.1080/17487870.2019. 1630123
Gradus, R., and T. Budding.2020.“Political and Institutional Explanations for Increasing Re-municipalization.” Urban Affairs Review 56 (2): 538–564.
Hart, O., A. Shleifer, and R. W. Vishny.1997.“The Proper Scope of Government: Theory and an Application to Prisons.” Quarterly Journal of Economics 112 (4): 1127–1161. doi:10.1162/ 003355300555448.
Hipp, L., and M. E. Warner.2008.“Market Forces for the Unemployed? Training Vouchers in Germany and the USA.” Social Policy & Administration 42 (1): 77–101.
Julian, L. G.1991.“Quasi-markets and Social Policy.” Economic Journal 101 (408): 1256−1267. Julian, L. G. 2007. The Other Invisible Hand: Delivering Public Services through Choice and
Competition. Princeton: Princeton University Press.
Lowery, D. 1998. “Consumer Sovereignty and Quasi-market Failure.” Journal of Public
Administration Research and Theory 8 (2): 137–172. doi:10.1093/oxfordjournals.jpart.a024376. Merzyn, W., and H. W. Ursprung.2005.“Voter Support for Privatizing Education: Evidence on Self-interest and Ideology.” European Journal of Political Economy 21 (1): 33–58. doi:10.1016/j. ejpoleco.2004.03.007.
Moberg, L., P. Blomqvist, and U. Winblad.2016.“User Choice in Swedish Eldercare – Conditions for Informed Choice and Enhanced Service Quality.” Journal of European Social Policy 26 (3): 281–295. doi:10.1177/0958928716645076.
National Board of Health and Welfare.2019.“Statistik om socialtjänster till äldre 2018.” May 7.
Pettersson-Lidbom, P. 2008. “Do Parties Matter for Economic Outcomes? A
Regression-discontinuity Approach.” Journal of the European Economic Association 6 (5): 1037–1056. doi:10.1162/JEEA.2008.6.5.1037.
Savas, E. S.2000. Privatization and Public–Private Partnerships. New York, NY: Chatham House.
Shleifer, A. 1998. “State versus Private Ownership.” Journal of Economic Perspectives 12 (4): 133–150. doi:10.1257/jep.12.4.133.
Swedish Association of Local Authorities and Regions (SALAR). 2019. “Sektorn isiffror – Juni 2019.”https://skl.se/ekonomijuridikstatistik/ekonomi/sektornisiffror.1821.html
Warner, M. E.2006.“Market-based Governance and the Challenge for Rural Governments: US Trends.” Social Policy & Administration 40 (6): 612–631. doi:10.1111/j.1467-9515.2006.00523.x. Warner, M. E. 2008. “Reversing Privatization, Rebalancing Government Reform: Markets,
Deliberation and Planning.” Policy and Society 27 (2): 163–174. doi:10.1016/j.
polsoc.2008.09.001.
Warner, M. E., and A. Hefetz.2012.“Insourcing and Outsourcing: The Dynamics of Privatization among U.S. Municipalities 2002–2007.” Journal of the American Planning Association 78 (3): 313–327. doi:10.1080/01944363.2012.715552.
Warner, M. E., and H. J. M. G. Raymond.2011.“The Consequences of Implementing a Child Care Voucher Scheme: Evidence from Australia, the Netherlands and the USA.” Social Policy & Administration 45 (5): 569–592.
Warner, M. E., and J. Clifton.2014.“Marketisation, Public Services and the City: The Potential for Polanyian Counter Movements.” Cambridge Journal of Regions, Economy and Society 7 (1): 45–61. doi:10.1093/cjres/rst028.