MATHEMATICAL MODELS FOR REGIONAL
SOLID WASTE MANAGEMENT DEVELOPMENT
Inara Teibe
1Ruta Bendere
2Larisa Perova
3Dace Arina
41
University of Latvia, Latvia
2Waste Management Association of Latvia, Latvia
3Uzskaites sistemas Ltd., Latvia
4Latvian University of Agriculture, Latvia
ABSTRACT
The mathematical methods of waste management assessment and software for various life cycle applications are widely used as one of the decision-making support tools in waste policy. This comparatively new approach to waste management planning offers an option for investigating the life cycle impact of solid waste management processes which generate anthropogenic impact on the environment, of which the most unfavorable is greenhouse gas emission.
In the research a software application called WAMPS (waste management planning system) developed by the IVL Swedish Environmental Research Institute within the Reco Baltic 21 Tech project has been used to create a better understanding about waste management processes and their produced impact on climate change. It is the first time when WAMPS software is applied for regional domestic waste management planning for the next seven-year period in the Baltic states, in this particular case for the Piejura region, which is one of the ten waste management planning regions in Latvia. The Piejura region includes one city of national level and nine districts, with the total area of about 5,300 sq. km and the number of inhabitants 153,899. In accordance with national legislation, responsibility for waste management organization has been delegated to local municipalities.
In this study the solutions for elaboration of the Piejura region waste management strategy are based on those waste management processes which will produce the best environmental options. The main results of the research were obtained comparing various waste management scenarios in WAMPS: the existent situation in regional waste management, where more than 94% of domestic waste is landfilled; European Union framework demands according to Waste and Landfill directives; and the best technological solutions for the Piejura region based on local circumstances. The next phase of research will draw attention to the implementation and integration of the chosen technological solutions on the basis of economical solutions.
KEYWORDS
Regional, Waste management development, Mathematical methods, Software. 622
1 INTRODUCTION
Nowadays municipal waste management planning and its strategy options have been hard to fulfill without decision-making support tools, such as waste management mathematical models based on Life Cycle Assessment (LCA). LCA is a rather new approach in waste management planning. In the 1960s it covered in the energy requirements, in the 1970s pollution prevention (Rebitzer, 2006), and at present it stretches into various application methods.
The main advantage of the LCA approach is that of improving understanding of every waste management activity. Barton (1996) pointed out that waste management strategy had to comply with “waste hierarchy,” that is, to increase waste treatment capacity at the top of the waste hierarchy and reduce waste disposal at landfills. Generally waste management software calculates projected greenhouse gas (GHG) emissions and other pollution in air, water and land associated with waste management activity and processes, such as waste collection and transportation, transfer to stations, distributions between compost facilities, recycling and recovery facilities, combustion and disposal at landfills.Different waste management options have different amounts of C2H4, SO2, O2, NOx and CO2 emissions, as well as energy consumption and waste treatment streams. On his part, Carlson (2005) drew attention to the fact that economical analysis, called Life Cycle Costing (LCC), is often used in combination with LCA within the same waste management system boundaries. In this case investment costs, operative costs, decommissioning costs, and sales revenues have been calculated at current price value.
Beigl (1998) pointed out that the amount and composition of municipal waste is the basic information needed for planning, operating and optimizing waste management systems. Therefore, the input data quality and continuity is of utmost importance. Municipalities or regional organizations regularly have to obtain territorial information on existing waste sources and their location, amounts and composition of waste, sorting sources and waste fractions, waste producers’ habits, and they have to follow up on waste reducing progress. According to Carlson (2005) there are three main principles that determine how to use waste management software: 1) the possibility to gather necessary data, 2) the knowledge of the decision maker’s preferences, and 3) the conformity of the decision maker’s preferences with the methodology (Carlsonreich, 2005).
Many waste management planning tools have been created as a result of project activity with the support of different financial foundation. Some of these products are available to public, but the main drawback to this software is that it is often hard to find methodology and coefficients which have been used in waste management calculation processes.
The Environmental Protection Agency (EPA) has launched various applications from voluntary programs for waste planners to reduce and recycle at the source, for example, Waste Wise and Pay-As-You-Throw, and also report of GHG reductions through the Waste Reduction Model (WARM), Recycled Content (ReCon) and the Durable Goods Calculation (DGC) software. To access these tools: http://www.epa.gov/
Another application was undertaken by the World Meteorological Organization (WMO) and the United Nations Environment Program (UNEP) at the Intergovernmental Panel on Climate Change (IPCC) in 1988, where one of the activities was the work done on methodologies for the National Greenhouse Gas Inventories, which are known as the 2006 IPCC Guidelines for National Greenhouse Gas Inventories. Over 250 experts worldwide provided their expertise, knowledge and cooperation to develop these guidelines. For more information visit:
The Swedish Environmental Research Institute (IVL) has developed a software application, Waste Management Planning System (WAMPS), as part of the Reco Baltic 21 Tech project - Towards Sustainable Waste Management in the Baltic Sea Region. In order to compare the environmental performance of different types of waste management systems, the users are able to carry out calculations via a Web interface. WAMPS online: https://wamps.ivl.se/
2 WASTE MANAGEMENT SYSTEM
In order to implement and manage the centralized waste management system, the Parliament of Latvia accepted in 2005 the State Waste Management Plan for 2006 to 2012, whereby the territory of Latvia was divided into ten regions: Viduskurzeme (central Kurland), Ventspils, Liepaja, Piejura (Jurmala - Kandava), Dienvidlatgale (south Latgale), Zemgale, Austrumlatgale (east Latgale), Ziemeļvidzeme (north Vidzeme), Maliena (Aluksne – Balvi), Vidusdaugava (mid-Daugava), Riga and its suburbs. Each one has their own regional waste management plan and sanitary landfill. On the whole, according to national statistics, the total amount of landfill solid refuse in 2010 was around 634,000 tons and the largest part of that, 94.3% or 603,000 tons, consisted of unsorted household refuse and from other sources that produce similar waste material. Half of the produced household waste in Latvia has been disposed of at the Getlini Eko landfill.
The waste management planning (WMP) region of Riga and its suburbs differs from the other WMP regions completely. Therefore, in this paper the authors pay attention only to rural WMP regions and a particular region - Piejura (see Table 1).
Table 1. WMP regions and collected municipal waste per capita in 2010.
Waste management planning region Area, km2 Number of inhabitants Collected municipal waste per capita, t Ventspils 4,474 85,000 0.323 Ziemelvidzeme 10,146 178,275 0.232 Malienas 7,040 80,510 0.120 Vidusdaugava 8,646 129,084 0.192 Austrumlatgale 5,518 107,095 0.197 Piejura 5,304 155,595 0.345 Liepaja 4,741 139,541 0.245 Viduskurzeme 1,683 28,705 0.198 Zemgale 4,624 181,172 0.237 Dienvidlatgale 6,927 203,269 0.241
There are eleven priority waste flows defined by the European Commission: municipal waste, packaging waste, hazardous waste, end-of-life vehicles, health care waste, electrical and electronic equipment waste, oil waste, construction and demolition waste, sewage sludge and tires (European Commission, 2003). In accordance with the national legislation, the local
municipality is responsible for organization of household waste management in their territory and how it meets the regional WMP requirements.
The amount of collected household per capita (see Table 1) shows the total collected household and other source refuse that generate similar waste, and it is affected by various factors, such as how economically active the local territory is, how large the incomes per household are and how high the involvement of waste producers within the waste management system is. The highest ratio for collected household waste per capita per year is in Piejura – 345 kg, and Ventspils – 323 kg. The lowest ratio is in Maliena - 120kg, and Vidusdaugava – 197 kg.
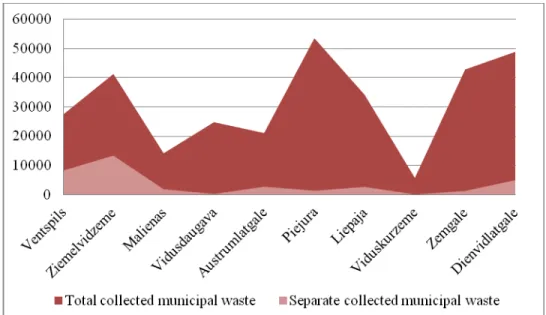
Generally, household waste collection and transportation is provided by private and municipal waste operators in Latvia, which have been chosen by means of a procurement procedure. One of the approaches is that in a particular territory (municipal or regional) only one waste operator runs unsorted household waste collection, separate waste collection and transportation to transfer stations or to the landfill. Mostly these are municipal companies. The other approach is that various waste operators, private companies or municipal, run waste collection and transportation within a regional territory under strict competition circumstances. The research results show that the best performance has been achieved by regions where mainly municipal waste operators dominate, such as Ventspils - 30% separately collected household waste and Ziemelvidzeme - 32%, see Figure 1. Nevertheless, there are five WMP regions where separately collected waste is less than 10% from the total collected refuse.
3 PIEJURA WASTE MANAGEMENT REGION
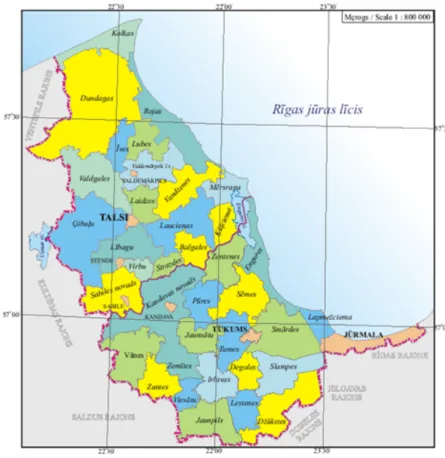
Piejura region is one of the ten waste management planning regions in Latvia located along the coast of the Gulf of Riga. The region includes one national-level city - Jurmala and nine counties (Talsi, Tukums, Roja, Mersrags, Kuldiga (partly), Kandava, Jaunpils, Engure and Dundaga), see Figure 2. The total area of the region is about 5,300 sq. km and the number of inhabitants 155,595. The population density in the counties is about 13 – 27 capita / km2, with a lower density in Dundaga (7 capita / km2) and the highest - in Jurmala (561 capita / km2). The total household waste amount of the Piejura region has seasonal influence, when in the summer time a lot of visitors are attracted to the territory; in this case it was taken into account.
Figure 2. Piejura waste management region.
The Janvari landfill is located near Talsi. There are four waste transfer stations (the distance to the Janvari landfill is given in brackets) in Jurmala (102 km), Tukums (65 km), Kandava (39 km) and Roja (35 km). In two of them, Jurmala and Tukums, composting sites have been established for green waste composting. There are about 366 recycling points for waste materials such as paper, glass and plastic in the Piejura WMP region. The distribution of these recycling points is as follows: Talsi – 34 and its suburbs – 58, Tukums – 63 and its suburbs – 67, and Jurmala – 144. On average, there is one recycling point per 420 inhabitants in the Piejura region. There are also three waste recycling centres in Talsi, Tukums, Jurmala towns, where municipal waste producers can deliver separated waste by their own resources free of charge.
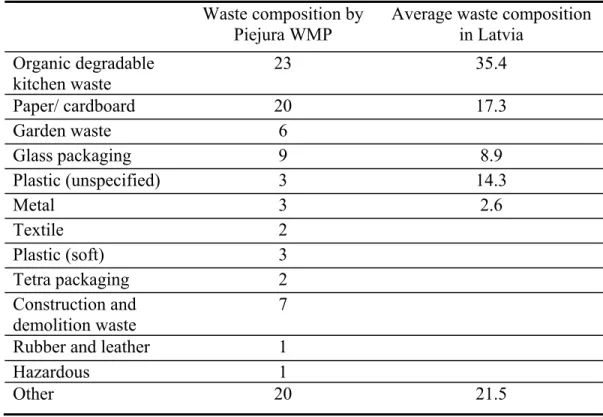
Table 2. The composition of generated household waste in Piejura WMP region. Waste composition by
Piejura WMP
Average waste composition in Latvia Organic degradable kitchen waste 23 35.4 Paper/ cardboard 20 17.3 Garden waste 6 Glass packaging 9 8.9 Plastic (unspecified) 3 14.3 Metal 3 2.6 Textile 2 Plastic (soft) 3 Tetra packaging 2 Construction and demolition waste 7
Rubber and leather 1
Hazardous 1
Other 20 21.5
In the Piejura WMP region the household waste composition is shown above in Table 2. It is compared with the average waste composition of Latvia. A conclusion can be made that there is a considerable difference in the waste fractions such as organic degradable kitchen waste and plastic waste. As the Piejura data quality is unknown, the average household waste composition in Latvia has been used for future Piejura regional waste management planning.
According to the national statistic data, about 119,191 tons were generated in the Piejura WMP region in 2010. The largest amount was produced in the household sector (36%) and a rather similar amount - 35% - in the commercial and industrial sector, less (21 %) in the agricultural sector, 2% in the construction and demolition sector, and 7% in the other sectors.
As shown before (see Figure 1), generally in Piejura WMP region about 58,605 tons or 241 kg/per capita of municipal waste were collected and 37,725 tons unsorted waste or 213 kg/per capita were disposed of at the Janvari landfill. The largest separated fraction from municipal waste was 21% metal and 12% sewage sludge, which is not typical household waste. After correction of the figures, about 94.46% of household waste was disposed of at the Janvari landfill, and about 5% of waste materials, such as paper, plastic, glass and bio- waste, was recycled.
4 METHODOLOGY
WAMPS has been applied to calculate environmental performance of possible waste management scenarios for the Piejura WMP region. This model was begun by the Swedish
Environmental Research Institute (IVL) in 2011 and is still in the testing phase. It is, however, available for public use at present. In this paper the waste management planning environmental performance results are only indicative.
WAMPS software
WAMPS is a waste management planning decision-making tool with an easy-to-use application. This software can be used to compare various possible waste management scenarios in relation with the existing background. However, its purpose is only to provide recommendations with mathematical and graphic representations. By using different waste management treatment facilities, it is possible to get different benefits from household refuse, that is, new products such as compost, paper, plastic, metal, heat, electricity and fuel (biogas). WAMPS software is most suitable for waste management system analyses from an environmental point of view in particular areas, which meets certain specific conditions. This application tool requires basic knowledge of waste management and a certain level of LCA expertise on the part of the user.
WAMPS five consecutive steps:
1) waste composition (input data for 24 waste fractions and amounts);
2) waste sorting (recycled waste material from each waste fraction at the source);
3) waste treatment (composting, anaerobic digestion, incineration, combustion, landfill); 4) waste collection (environmental performance related to waste collection);
5) waste transportation (specifies parameters affecting the environmental performance for long distance transportation).
The environmental performance of every waste management system is shown and divided into the following environmental impact categories: global warming, acidification, eutrophication, and photo-oxidant formation.
4.2 WAMPS results validity for methane emission calculations
Methane (CH4) is one of the basic components of gas emissions from solid waste disposal sites (SWDS). The 1996 IPCC Guidelines for National Greenhouse Gas Inventories describes the processes which produces landfill gas emissions from SWDS, and provides methane emissions calculation methodology. IPCC methodology is based on the first order decay (FOD) method. The method requires the use of data for amounts and composition of waste for a period or at least 50 years.
If the amount and composition of waste disposed at SWDS has been relatively constant over the previous several decades, it is reasonable to estimate CH4 emission per year by simplified (default) methodology. This methodology does not incorporate any time factors and assumes that all CH4 emissions are generated from disposed waste in the current period.
It is good practice to use the FOD method, because it reflects emission trends more accurately. In reference to the reduction of the amount of carbon deposited at SWDS, the default method could underestimate emissions and it would probably overestimate reductions. The 2006 IPCC Guidelines for National Greenhouse Gas Inventories recommends the use of FOD method for CH4 emission calculations and provides improved default data.
In this paper CH4 emission calculations have been made by using WAMPS software and the 2006 IPPC Guidelines for National Greenhouse Gas Inventories default method. The basic scenario corresponds to the existing situation, when 37,149 tons of municipal solid waste (MSW) were deposited at the Janvari landfill in 2010 without recovering any landfill- produced gases or treating the bio-waste fraction in the MSW. The two additional hypothetical scenarios - one made
up of 50% and the other with 100% - the food and organic matter is recycled through the open windrow composting methods. The results are shown below in Table 3.
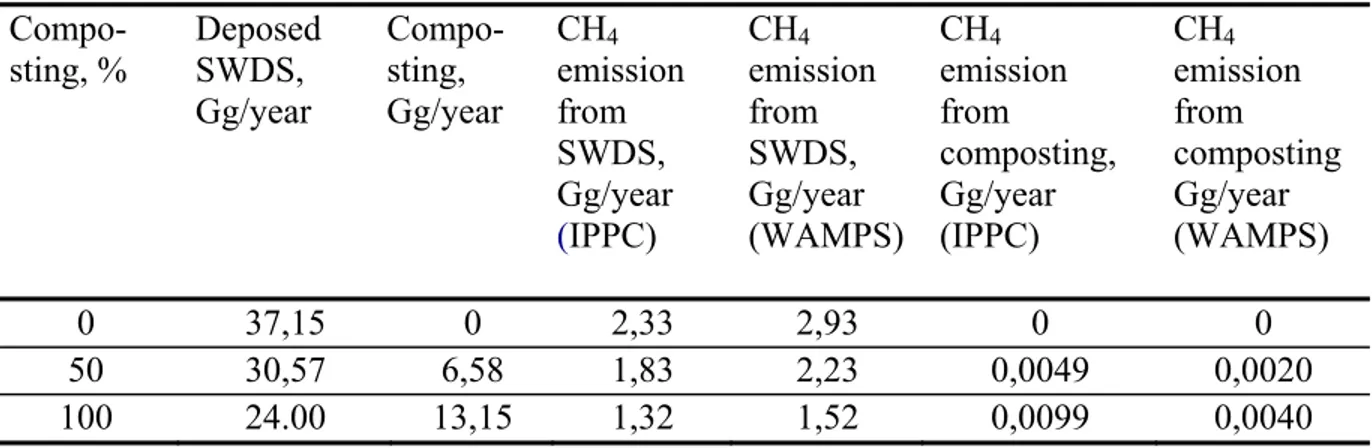
Table 3. Calculation results for CH4 emissions based on IPPC Guidelines default methods and
WAMPS. Compo- sting, % Deposed SWDS, Gg/year Compo- sting, Gg/year CH4 emission from SWDS, Gg/year (IPPC) CH4 emission from SWDS, Gg/year (WAMPS) CH4 emission from composting, Gg/year (IPPC) CH4 emission from composting Gg/year (WAMPS) 0 37,15 0 2,33 2,93 0 0 50 30,57 6,58 1,83 2,23 0,0049 0,0020 100 24.00 13,15 1,32 1,52 0,0099 0,0040
The calculated CH4 emissions in both WAMPS and 2006 IPPC Guidelines for National Greenhouse Gas Inventories have rather similar results. The emission factor due to biological treatment processes using WAMPS software is about 0,3 CH4 g/kg. This value is within the range of the CH4 emission factor given by IPCC Guidelines. Taking into account that CH4 emission factors due to biological treatment depend on the applied treatment technologies and several others emissions factor values, the WAMPS calculated CH4 emissions from composting is also
acceptable.
4.3 Waste management planning scenarios and assumptions
The average structure of deposited waste material at the landfills in Latvia has been estimated in a different research project, The Assessments of Dissolved Organic Carbon Parameters in the Landfill Waste Material (2011). The results show that a lot of waste material in general has been disposed at landfills. For example, bio-waste from 50.3 % to 51.7%; plastic 10.3% - 11.8 %; paper / cardboard 5.7% - 8 %, glass 10.9% - 19 %, textile, rubber and leather 3% - 8.6 %; and metal 2% - 4.6% [12].
In this research paper, the authors propose that disposed recycling waste materials, such as paper, glass, plastic, metal packaging and biomass, should be gradually diverted by 10%, 25% or 50% from disposal in the landfill. The GHG emissions generation from unsorted refuse will be limited with the pre-treatment method. Thereby, within a period of 10 years, CH4 emission could in Latvia be reduced from 50 Gg to 35 Gg. The environmental impact of waste collection and transportation processes has not been calculated in this case. The average composition of waste of Latvia for calculation is shown in Table 2.
According to the research results at the solid municipal waste landfill Daibe (Ziemelvidzeme WMP region), where the waste composition after the pre-treatment line has been estimated (which consists of the shredder – model of Komptech –Terminator mobile 3400S F – throughput performance up to 50 t/h, drum rpm.0-50 mm and the screener (star screen) – model of Komptech Multistar L3-Flowerdisc – throughput performance up to 180 m3/ h with screen
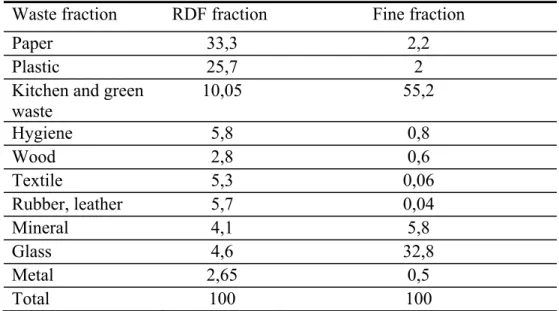
sections: 0/10...25 mm; 10...25 /60...80 mm; >60...80 mm), the average structure of the pre-treated mass is coarse fraction 18-25%, medium fraction 38-43%, fine fraction 30-36% and metal 2-3%. From all the above waste fractions only medium and coarse parts comply with the demands for refuse derived fuel (RDF) because of less humidity and hazardous components (heavy metals and chlorine). The RDF fraction is around 56-68% from the total amount. The average percentage of the refuse composition in RDF and fine fraction (% of dry mass) is shown below (see Table 4).
Table 4. The average composition of RDF fraction and Fine fraction Waste fraction RDF fraction Fine fraction
Paper 33,3 2,2
Plastic 25,7 2
Kitchen and green waste 10,05 55,2 Hygiene 5,8 0,8 Wood 2,8 0,6 Textile 5,3 0,06 Rubber, leather 5,7 0,04 Mineral 4,1 5,8 Glass 4,6 32,8 Metal 2,65 0,5 Total 100 100
After the unsorted waste mechanical pre-treatment process, RDF material will be delivered to the combustion facility in Broceni JSC, and the fine fraction will be treated in the biocell and disposed at the landfill after the stabilization process. It is assumed that 30% of landfill gas is recovered both in the bio-reactor and in the landfill, out of which 40% is produced as energy and 60% as district heating.
5 RESULTS
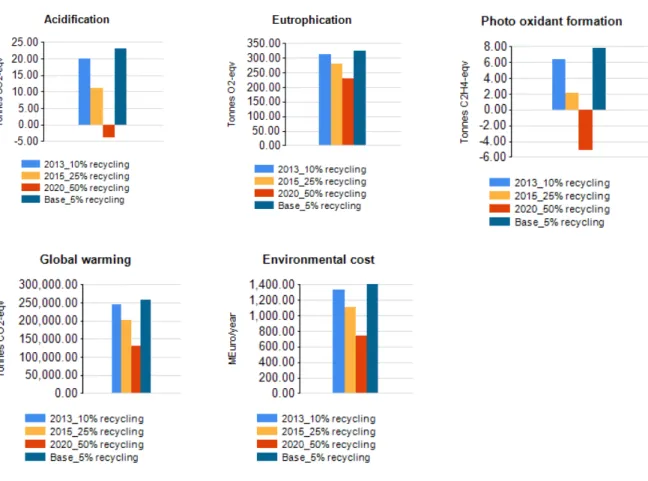
The results of the Piejura waste management strategies and their environmental performance is shown below in Figure 3.
Global warming is related to emissions of GHG to air. GHG is emitted within municipal waste management treatment and disposal processes at the landfill. Mainly these are generated emissions such as NO and CO2 from the combustion process, CH4, N2O, CO2 from the landfill process, and generally CO2 from the transportation process, but not in this particular case [10]. Acidification is the cause of a wide range of impacts on soil, groundwater, surface water, organisms, ecosystems and materials (buildings). These are mainly gases such as SO2 and NOx from combustion processes, as waste incineration, energy production, engines, and composting also gives high emissions of NH3. In the scenarios where only the smallest part of waste material is sorted out, the combustion process has a rather significant impact on the environment.
Photo-oxidant formation is the formation of reactive substances (mainly ozone) which are injurious to ecosystems and human health. Photo-oxidant formation shows the same tendencies as global warming and acidifications. The best option is 50% recycling of waste material such as paper, plastic, glass and metal packaging and combustion of the rest.
Eutrophication includes all impacts due to emissions of excessive levels of macro-nutrients in the environment into air, water and soil. These emissions mainly come from NOx in combustion gases and NH3 in composting from spreading the compost, as well as from landfills depending on N- and P-compounds in leachate water. Material recycling is the best option to reduce eutrophication (Moora, 2009)
Environmental cost has been assessed and ranked four different waste management scenarios mentioned before and their environmental impact. The result shows that Piejura region could achieve a significant environmental performance from waste management activities only in 2015 and the highest in 2020, when at least 25% of waste material will be recycled and half of the rest will undergo combustion as RDF material.
6 CONCLUSIONS
Waste management planning with WAMPS software is easy to apply and gives a visual explanation of each waste management process. The findings are rather feasible and conform to 2006 IPCC Guidelines for National Greenhouse Gas Inventories.
Despite of landfill gas energy recovering at the Janvari landfill, this is a major producer of GHG; therefore, avoiding bio-waste from the landfill should be one of the waste management priorities in the Piejura region.
Open windrow composting of organic waste material also has an environmental impact, therefore, closed composting, bioreactor composting or anaerobic digestion could be a better solution for bio-waste treatment methods for territories with a high population density as in Jurmala, Talsi and Tukums. The fine fraction of other materials could be treated in anaerobic digestion and disposal of at the landfill after the stabilization process.
Alongside with the improving waste producer mobility to collect separate waste materials such as paper, plastic, glass and bio-waste, and avoiding disposal of these in the landfill, with the mechanical pre-sorting process the rest could be treated into RDF material for combustion.
The local government has to implement a strong waste management policy on the municipal level and make significant efforts on mitigating the GHG and air pollutant emissions. The best solution could be a regional organization which could gather regular waste statistical data from all waste operators from all municipalities, to follow up on WMP requirements and its practical performance and capacity, and organize waste material treatment flows suitable and available to treatment facilities on the regional and national level.
REFERENCES
[1] Arina D., Bendere R., Teibe I., 2011. Pre-treatment Processes of Waste Reducing the Disposed Amount of Organic Waste and Greenhouse Gas Emission. The ISWA World Solid Waste Congress 2011, Congress proceedings, Florence, Italy, 517 pdf
[2] Barton, J.R., Dalley, D, Patel, V.S., 1996. Life cycle assessment for waste management, Waste Management, Vol.16, Nos1-3, p 35-50
[3] Beigl, P., Lebersorger, S., Salhofer, S., 2008. Modelling municipal solid waste generation: a review. Waste Management, Jan2008, Vol. 28 Issue 1, p 200-214
[4] Carlsson, R., M., 2005. Economic assessment of municipal waste management systems— case studies using a combination of life cycle assessment (LCA) and life cycle costing (LCC). Journal of Cleaner Production. Feb2005, Vol. 13 Issue 3, p253-263
[5] European Commission,Environment DG. , 2003. Preparing a Waste Management Plan A
methodological guidance note 2003 http://ec.europa.eu/environment/waste/plans/pdf/wasteguide_final.pdf (23.08.2012)
[6] Hongwei, L., Guohe, H., Zhenfang, L., Li H., 2008. Greenhouse Gas Mitigation-Induced Rough-Interval Programming for Municipal Solid Waste Management. Journal of the Air & Waste Management Association (Air & Waste Management Association). Dec2008, Vol. 58 Issue 12, p1546-1559
[7] IPCC, 2006. Guidelines for National Greenhouse Gas Inventories, Revised 1996 IPCC Guidelines for National Greenhouse Gas Inventories: Reference Manual http://www.ipcc-nggip.iges.or.jp/public/gl/guidelin/ch6wb1.pdf
[8] Latvian Environment, Geology and Meteorology Centre, LEGMC, 2012. Annual GHG Inventory Report under the Decision No 280/2004/EC for 1990-2010, Latvia. http://rod.eionet.europa.eu/countrydeliveries (September 11, 2012)
[9] Moora H., 2009. Life Cycle Assesment as a Dicision Support Tool for System optimisation- the case F Waste Management in Estonis, Tallinn University of Technology, 174 p.
[10] Pikoń, K., Gaska, K., 2010. Greenhouse Gas Emission Mitigation Relevant to Changes in Municipal Solid Waste Management System. Journal of the Air & Waste Management Association (Air & Waste Management Association). Jul. 2010, Vol. 60 Issue 7, p782-788. [11] Rebitzer, G.; Ekvall, T.; Frischknecht, R.; Hunkeler, D.; Norris, G.; Rydberg, T.; Schmidt, W.-P.; Suh, S.; Weidema, B.P.; Pennington, D.W., 2004. Life cycle assessment: Part 1: Framework, goal and scope definition, inventory analysis, and applications. Environment International. Jul. 2004, Vol. 30 Issue 5, p701. 20p
[12] Virsma Ltd, 2011. Degradējamā organiskā oglekļa daļas noteikšana apglabātos atkritumos [Report of Latvia's national greenhouse gas emission inventory]. Riga, [in Latvian]