Research
Development of an Estimating Procedure
for the Annual PLAN Process
- with Special Emphasis on the Estimating Group
Steen Lichtenberg
Research
Development of an Estimating Procedure
for the Annual PLAN Process
- with Special Emphasis on the Estimating Group
Steen Lichtenberg
Lichtenberg & Partners ApS
Management Consultants
203 Strandvejen
DK-2900 Hellerup
Denmark
January 2003
This report concerns a study which has been conducted for the Swedish Nuclear Power Inspectorate (SKI). The conclusions and viewpoints presented in the report are
Background
Since 1981 the nuclear power utilities annually pay fees to the Nuclear Waste Fund. The utilities must in addition provide financial guarantees. The purpose of the Fund is to cover future costs for the safe management and disposal of spent nuclear fuel and nuclear waste, as well as decommissioning and dismantling of the nuclear power reactors. The Fund must also finance the research and development programme.
The present method applied for the work of the yearly proposal for the level of the fees and guarantees is called the successive principle. This method is used to calculate the future expected costs for the safe management of spent nuclear fuel and for the decommissioning and dismantling of the Swedish nuclear reactors.
The task to assign appropriate financial means to the Swedish Nuclear Waste Fund is crucial for the sustainability and long term credibility of the financing system.
A deficit situation may for example arise if the level of accruals to the fund becomes
inadequate in relation to the total disbursements. It is therefore highly important that provision to the fund reflects the real cost of performing the planned and described future tasks. All measures that enhance the overall quality of the calculation of fees to the fund, as well as the guarantees given by the industry, are from the standpoint of SKI essential research tasks if the studied object or cost items has a significant impact on the funding and/or guarantees.
Purpose of the project
The main purpose of the project has been to describe the different phases that an expert group faces in an authentic environment.
A secondary objective has been to identify and describe some possible ideas for
improvements in the current method. The demands for more cost-efficient ways to derive the estimated cost items and a need for a higher degree of transparency in the process may put further demands on the identification and evaluation of applicable methods and/or modes of analysis. This in turn may put up the demand for some changes in the present context.
Results
This report provides an example of how the presently used procedure for estimation of future costs of management and disposal of spent nuclear fuel and nuclear waste may be improved. The study also demonstrates an alternative estimation procedure.
Continued work
The composition of an expert group is a crucial element in using the successive principle, as it may have a substantial impact upon the outcome from the analysis. An important task for the
Effects on SKI work
SKI will be able to use the conclusions from this study in the review of the annual cost estimates presented by the nuclear industry. The use of an alternative procedure will in addition provide SKI with a tool to enhance the evaluation of the cost estimates.
It ought to be remembered that this report only gives an example of how the context may be altered in order to develop the present estimation procedure for the annual calculation of fees and guarantees. Hence, this applied study demonstrates one alternative context.
SKI will be able to use the conclusions from this study in the ongoing monitoring of the yearly cost estimates presented by the nuclear power utilities. The development of an alternative procedure will gradually enable SKI to determine whether the previously estimated costs have been too conservative or not.
Project information
At SKI Staffan Lindskog have been responsible to supervise and co-ordinate the project. SKI reference: 14.9-010559/01235
Swedish Nuclear Power Inspectorate (Statens Kärnkraftinspektion), SKI, Stockholm
RESEARCH STUDY:
Development of an estimating procedure for the annual PLAN process
Contents Page
Management summary 2
Ledningssammandrag 4
Chapter 1 Objectives, the current situation and basic issues 6
1.1 Objectives and principal requirements 6 1.2 The current situation 7 1.3 Comments on the law on financing (1992:1537) 9 1.4 The scientific paradigm behind the study 10 1.5 The cash flow and Net Present Value techniques 11 1.6 The Successive Principle 14 1.7 Comments on the discount rate 20
Chapter 2 Organisation of the procedure and the analysis group 21
2.1 Organisation of the procedure 21 2.2 Establishing the main analysis group 23 2.3 Comments on the periodical updating of the analysis 24
Chapter 3 A suggested procedure 27
3.1 An overview 27
3.2 The qualitative analysis phase 30 3.3 Scenarios, alternatives, schedules and cost structure 33
3.4 Cost-sharing models (sharing between the four company units) 42 3.5 Definition of the base case reference, and extremes 42
3.6 Quantification I, schedule, cash flows, and interest rates 43 3.7 Quantification II, the total base case estimate 50 3.8 Quantification III, finalising the estimate process 52 3.9 Final reporting and suggestions from SKI 53
Chapter 4 Critical evaluation 54
4.1 Does this procedure satisfy the previous criticism? 54 4.2 Correct identification and handling of major issues 56 4.3 An unbiased quantitative evaluation of uncertainties 56 4.4 Securing basically correct statistical calculations 57 4.5 Controllable detailing according to specific need 62 4.6 The estimating process should be seen as a whole 62
Chapter 5 Comments on the analysis tests 63
References 65
List of abbreviations, etc. 68
Appendix: Evaluation and handling uncertain input values 70
---o0o---Management summary
Purpose & scope
This research study deals with the PLAN 2000 procedure. This complex annual estimating procedure is based on the Swedish law on financing, 1992:1537. It requires the Swedish Nuclear Power inspectorate, SKI, to submit to the Government a fully supported annual proposal for the following year’s unit fee for nuclear generated electricity to be paid by the owners of the Swedish nuclear power plants. The function of this Fund, KAF, is to finance the future Swedish decommissioning programme.
The underlying reason for the study is current criticism of the existing procedure, not least of the composition and working conditions of the analysis group. The purpose of the study is to improve the procedure. The aim is (1) to maximise the realism and neutrality of the necessary estimates in order to allow the KAF Fund to grow steadily at the current rate to the desired target size, allowing it to pay all relevant costs associated with this large decommissioning programme; (2) to do this with a controlled degree of safety; (3) to improve the transparency of the whole procedure in order to avoid any distrust of the procedure and its results.
The scope covers all technical and statistical issues; and to some degree also the directly related organisational aspects, notably in respect of the present law and its administration. However, some details are dealt with which seem contrary to the aim of the law.
Analysis of the present situation and primary requirements
Since 1996, SKI has delegated to the Swedish Nuclear Fuel and Waste Management Co., SKB, the task of performing the basic part of the necessary annual estimating procedure. SKI has then evaluated and supplemented the base estimate before the drafting of the final
proposals for the Government and the Board of the Fund, KAFS.
The existing procedure has been tailor-made for this particular task and includes several excellent features. Nevertheless, it has been subject to criticism. Its use of probabilistic methods as well as the composition and working conditions of the analysis group have been criticised. The technical complexity and handling of the influence of time also constitute problem areas.
Some basic requirements are crucial to the quality of the result of the study: (1) full
identification of all potential sources of major uncertainty and the subsequent correct handling of these, (2) balanced and unbiased quantitative evaluation of uncertain matters, and finally (3) correct and transparent statistical calculations of the result.
The resulting proposed new procedure
The resulting proposals for a new procedure include a model structure for the analysis team and its procedures, the initial identification and handling of the sources of uncertainty, a choice of scenarios and alternatives to be examined, followed by some quantification phases, during which the data on timing, costs, etc. are evaluated and followed by a calculation. The
result consists of information about the necessary size of the fee rates for various degrees of safety or probability, as well as the primary sources of the remaining uncertainty involved.
Discussion and testing
A workable procedure is always achieved through a balance between complying strictly with the relevant natural laws and being sufficiently simple and intelligible, with a minimum of ‘black boxes’. The relevance of the desired balance is discussed and verification is attempted. Special attention is given to a discussion on the application of the Bayesian statistical theory, the paradigm of which is still new to some professionals and decision-makers.
The procedure has been tested in several steps. So far, the procedure has lived up to or exceeded expectations. Some primary conclusions are summarised in the final chapter. More tests will be required. The results of this testing are to be published separately.
References and abbreviations
Ledningssammandrag
Syfte och omfattning
Denna forskningsstudie behandlar PLAN 2000 proceduren, vars komplexa årliga
skattningsprocedur bygger på finansieringslagen (1992:1537) om finansiering av framtida utgifter för använt kärnbränsle mm. Denna uppdrager åt Svenska Kärnkraftinspektionen, SKI, att årligen överlämna till regeringen ett välunderbyggt förslag avseende storleken på nästa års avgift som kärnkraftverken har att betala till KAF, kärnavfallsfonden. KAF skall garantera finansieringen av det framtida svenska avvecklingsprogrammet
Forskningsstudien sker på grund av att den idag fungerande proceduren har utsatts för kritik; bl.a. sammansättningen av analys gruppen och dens arbetsätt. Studiens uppdrag är att förbättra proceduren. Målen är att (1) maximera realismen och neutraliteten i bedömningar och
kalkyler så att KAF kan växa stadigt i den takt som gör det möjligt för fonden att finansiera alla relevanta kostnader för avvecklingsprogrammet; (2) att genomföra detta på en
kontrollerad säkerhetsnivå och (3) att öka förståelsen och insynen och därmed höja förtroendet för proceduren och dess resultat.
Omfattningen av studien täcker alla tekniska och statistiska områden, samt till viss del även direkt berörda organisatoriska aspekter. Det senare med hänsyn tagen till den existerande lagen och hur den administreras. Vissa detaljer har dock påpekats där dagens procedur synes motverka lagens syfte.
Analys av dagens situation och grundläggande krav
Sedan 1996 har SKI delegerat till Svensk Kärnbränslehantering AB, SKB, uppgiften att utföra den grundläggande delen av nödvändiga årliga kalkyler med tillhörande bedömningar. SKI har sedan värderat och kompletterat dessa kalkyler innan det slutgiltiga förslaget har sammanställts till regeringen och kärnavfallsfondens styrelse, KAFS.
Dagens procedur är skräddarsydd för sin uppgift och innehåller många utmärkta moment. Inte desto mindre har den utsatts för kritik. Användningen av probabilistiska metoder så väl som analysgruppens sammansättning och arbetssätt har ifrågasatts. Den tekniska komplexiteten och hantering av tidsosäkerhet är också exempel på problematiska områden.
Vissa grundläggande krav är viktiga för att beräkningsresultatet skall uppnå hög kvalitet: (1) fullständig identifiering av alla potentiella påverkansorsaker, och att dessa därefter hanteras korrekt, (2) en balanserad och neutral kvantitativ bedömning av osäkra områden, och slutligen (3) korrekta och lättförstådda statistiska beräkningar av resultatet.
Den föreslagna nya proceduren
Förslaget innehåller en procedur, en organisation av analysgruppen, en identifiering och behandling av osäkerhetsorsaker samt val av de scenarier och alternativ som skall bedömas, följt av olika kvantifieringsfaser, under vilka data avseende tid, kostnader, etc. bedöms och beräknas. Resultatet består av information om nödvändig avgiftsstorlek vid olika
sannolikhets- eller säkerhetsnivåer. I resultatet ingår också information om avgiftsstorlekens viktigaste osäkerhetsorsaker.
Argumentation och test
En användbar procedur är alltid en kompromiss mellan relevanta naturlagar och att
proceduren upplevs som tillräckligt enkel och klok och med ett minimum av "black boxes". Relevansen i den föreslagna kompromissen diskuteras med ett försök till verifiering. Speciell uppmärksamhet ägnas åt en diskussion kring användandet av Bayesk statistisk teori, ett område som fortfarande är nytt för en del beslutsfattare.
Proceduren har testats i flera steg. Proceduren har hittills levt upp till eller överstigit förväntningarna. Se sista kapitel. Resultaten från dessa test kommer att publiceras separat. Ytterligare testning är dock nödvändig och kommer att genomföras.
Referenser
En förteckning över referenser och förkortningar återfinns sist i rapporten.
---o0o---Chapter 1
Objectives, the present situation, and basic issues
Chapter 1.1 Objectives and principal requirements
Objectives
The purpose of this research study is to provide the most reliable background information for building up the Swedish Nuclear Decommissioning Fund (Kärnavfallsfonden, hereinafter referred to as ‘the Fund’). It is administered by KAF/KAFS. The objective is to build up the Fund to the level required, with a fixed margin as insurance against uncertainties.
The underlying reason for this research study is current criticism of the existing procedure. This procedure is certainly capable of improvement, by retaining and building on its strongest features while eliminating or at least reducing such potential local weaknesses as are
embedded in this procedure.
The basic requirement of this updated procedure is to be able to (1) maximise the realism and neutrality of the necessary estimates in order to allow the Fund to grow steadily at the current rate to the desired target size; (2) to enable it to pay all relevant costs associated with this large decommissioning programme; (3) to do so with a controlled degree of safety; (4) to improve the transparency of the whole procedure in order to avoid any distrust of the procedure and its results.
Principal requirements
Five basic requirements are crucial to the quality of the result. They are outlined below and further dealt with in Chapter 4.
1. Unconditional identification of all potential sources of major uncertainty; the subsequent correct handling of these sources during the estimating process must be ensured.
2. Balanced, unbiased, free and accurate quantitative evaluation of uncertain matters must be ensured.
3. Correct statistical calculations of the result must be secured.
4. A sufficiently controllable detailing process is essential in response to the specific need for detailing.
5. The estimating process must be seen as a whole. A cost is a cost, irrespective of who is responsible for it.
Chapter 1.2 The current situation
The system
Since 1996, SKI has delegated to the Swedish Nuclear Fuel and Waste Management Co., SKB, the task of performing the basic part of the necessary annual estimating procedure. SKI has then evaluated the base estimate. Other parts of the programme costs, namely the costs arising from the related activities involving the relevant authorities, have been estimated by SKI, which has also drawn up the final recommendations for the Government and KAFS. The existing procedure has been tailor-made for this particular task and it includes several excellent features. Nevertheless, it has been subject to criticism, expressed in refs. 4 and 17 and elsewhere. The fundamental elements of this criticism are summarised below, together with the author’s comments.
Criticism
1. The existing procedure has been criticised for using probabilistic methods. The alternative would be to establish one or more sets of firm preconditions or scenarios, each of which would allow a definite and fairly exact estimate of the cost, assuming today’s technology. This would, however, force the decision-makers to choose one of the scenarios without having the necessary background to do so in a sensible manner. And because the calculations rest upon historical conditions, the cost figures chosen might be far from the actual future costs, thus undermining the basic objective.
The result would be to accumulate either too large or – which is more likely – too small a fund. In the latter case the final parts of the decommissioning would have to be paid not by those who benefit now from production, but by the next generation. This part of the criticism certainly lacks supporting evidence.
2. Establishing the body responsible for the estimating procedure, not least the analysis
group, which identifies, handles, and evaluates the costs and other related factors, is a highly
important aspect. The body should be competent, broad-based and balanced, and not least sufficiently independent of those with special interests in the outcome.
SKB has not been able to document compliance with this important requirement. For example, a significant majority of the members are internal to or dependent on the nuclear power plant industry. In a situation in which subjective judgements of major importance have to be made, it is hard for society to rely on full neutrality, even with the best of intentions of the involved parties.
3. The working conditions in this analysis group are another major issue. So far, it has not been documented how the procedure ensures free and complete identification and evaluation of potential risks or problems.
4. Another set of problems is the unnecessary degree of complexity in the calculation of the results, not least unnecessary ‘black boxes’, as well as the extensive use of the ‘emergency solution’ – Monte Carlo simulation – instead of a scientifically-based direct, correct calculation procedure. This is further dealt with in Chapter 4.1.
5. The timing and related discounting as well as the future real interest rates constitute unsolved issues, and have therefore been handled in a problematic manner. This has been described by SKB itself in a recent report (ref. 2, Chapter 1.3).
Part of the reason for the above problems is that an early version of the Successive Principle has been applied. It has been necessary to supplement this old version with various tailor-made sub-routines. This set of problems has been solved and documented in the current version or ‘generation’ of the Successive Principle.
It is the aim of this research study to improve the current procedure, adopting the many valuable features and eliminating the weaknesses. It also seems possible to simplify certain sub-procedures, thereby reducing the estimate workload considerably.
Comments on the present organisational approach and related problems
Current legislation provides a common conventional principle for estimates; this is further developed below. Experts from the relevant area are asked to produce a solution, in this case a plan with a related estimate. The authorities then search for any errors, overlooked items and biases, and finally correct any which they identify. It is presumed that they will then be able to deliver a ‘correct’ result to the decision-makers.
In this particular case the industry, represented by SKB, is appointed, according to the law, to deliver a plan and a related ‘expert estimate’, albeit that it excludes the costs related to the authorities. The authorities, here represented by SKI, are appointed to estimate the authorities’ costs (SKI and SSI) and also to correct any failure or bias in the base estimate which was received from SKB. The corrected estimate, with the authorities’ costs added on, provides the final basis for their recommendations to the decision-makers. The above procedure is required by law and related administrative rules. Unfortunately, this procedure hinders an optimal result, as will be further developed below.
The industry is required to perform the greater part of this work. It does have the technical expertise, but not any special knowledge about the future societal conditions under which the resources and the related costs will operate; and nobody knows the future results of ongoing research in the area. These facts seriously reduce the quality of the estimate. Moreover, it is hard for such experts to avoid a certain understatement of future potential problems, and a belief that further research and development will be able to solve remaining unsolved matters. They will generally have a natural expectation that they will be able to handle these matters well. Such wishful thinking has proved to be able to impact on the estimate results even when the individuals involved honestly try to be neutral.
SKI’s task of verifying and supplying the base estimate also suffers from problems which mitigate against an optimal result. They certainly do have experts in the area concerned. However, they do not have deep inside knowledge of all aspects, notably the estimate details and evaluations behind the figures. This fact hinders an optimal search for biases, potentially overlooked factors, banal errors, etc.
In addition to this, the authorities’ costs are costs like any other cost item in this estimate. They therefore need to be fully integrated into the estimate, instead of being an appendix not
necessarily catering for the general conditions of the overall estimate. The above reasons therefore significantly reduce the quality of the estimate result.
The basic objective of this research study is to search for an optimal solution. It will therefore necessitate analysing and discussing an adjusted procedure in which the above-mentioned hindrances are eliminated or at least materially reduced, even if this necessitates minor adjustments to the basic system provided by the current law and related administrative rules. Such improvements of laws are a natural and old tradition in all societies.
An adjusted organisational system is presented and analysed in Chapter 2, while a discussion of its relevance follows in Chapter 4.1 a.
Chapter 1.3
Comments on the law on financing (1992:1537)
SKI is required by law annually to submit to the Government a fully supported recommendation for values the following three sets of figures.
1. Next year’s unit fee (in Swedish öre/KWH) for electricity produced by nuclear power for each of the existing four company units: Forsmark’s Kraftgrupp AB (FKA), Oskarshamn’s Kraftgrupp AB (OKG), Ringhals AB (RAB), and Barsebäck Kraft AB (BKAB).
The proposed unit fees should cover in full all future costs arising both from future handling of the waste and demolition of the plants and subsequent site cleansing: all duly executed in a safe manner. The costs include those incurred by SKI and SSI in relation to this programme. In addition to the legal requirement, minimising the variation from year to year of the annual proposed unit fees is advocated. It follows from this that the uncertainty in the range of future data should be handled in a way which, with the greatest possible realism, allows for an expected value as well as uncertainty, expressed as the standard deviation.
Major unplanned events are included in the safety allowance (no. 2) (Säkerhetsbelopp II). Such events are further dealt with below. However, a considerable unavoidable uncertainty remains even if no major unplanned event occurs and even when the uncertainties are minimised during the estimating process.
It would therefore be natural to plan for the Fund to provide cover for a high level of probability (technically called the quantile), e.g. 70, 80 or 90%. This is important because none of the safety allowances covers this situation; see ref. 21, “Plan 2000”, end of p. 11. 2. A financial safety allowance (no. 1) (Säkerhetsbelopp I) in million SEK is to be calculated for each of the four company units relating to the scenario in which all nuclear production is to be closed down in the course of the following year. The allowance is to be calculated as the difference between the 90% cost quantile of the estimate and the existing Fund.
3. An additional safety allowance (no. 2) (Säkerhetsbelopp II) in million SEK is to be calculated for each of the four company units. It must cover the costs arising from major unforeseen events. It is calculated as the 90% quantile derived from an estimate representing the potential impact of such events.
The law is open to various interpretations, such as a definition of ‘a Major unplanned event’. These can either be defined in more detail or introduced into the basic estimating procedure. See refs.1 and 4 for more information.
Chapter 1.4 The scientific paradigm behind the study
The primary scientific basis for this research study is the subjective probability theory or the Bayesian statistical theory. As the axioms behind this do not belong to classic or Newtonian science, in which experimental data plays a dominant role, further discussion is set out below. About a hundred years ago, Rutherford, Bohr and other early nuclear scientists conducted some most surprising experiments. They did not follow the laws of Newtonian physics. Indeed, they found that the firmly established classic laws were useless at the atomic level. As nature cannot be changed, the Newtonian axioms had to be further developed through a lengthy process. A new paradigm had to be formulated and gradually verified through
experiments and not least discussions. Decades later, modern nuclear physics was established and accepted. Without such a transition, nuclear power plants and many other systems would not exist today.
The classic or frequentistic statistical theory has met a similar challenge. An example illustrates this. During the 1960s the official Danish codes for large prefab concrete units in the construction industry were drawn up. The uncertainty in the geometrical sizes required a certain reserve or slack in the joints between structural units. Attempts to use the statistical theory on this problem resulted in requirements for the width of joints to be one to two feet or half a metre. This was simply considered ridiculous and impossible to live with. So the theory seriously failed when faced with the real world.
The classic statistical theory also failed in the area of planning and estimating, which developed rapidly after the last world war. The professionals met increasing uncertainties about future events and activities. Due to the rapid development and unforeseeable societal changes in the contemporary world, no historical ‘statistical population’ could still be accepted as a valid basis for estimates and planning of larger and generally unique tasks. It was impossible to find data or to conduct experiments which satisfied the requirements as to an acceptable ‘population’.
These and other problems supported or rather required the development of a new paradigm for the statistical theory with fewer restrictions. The most famous single step was probably the so-called Critical Path scheduling procedure, PERT, developed for the U.S. Defense
Department in 1958. The subjective evaluation of a triple estimate was introduced for the first time.
During the following decades the philosophical transformation from the classic statistical theory to the new paradigm of the Bayesian statistical theory was developed. The restriction of an acceptable population of quantitative data as input was widened to include subjectively evaluated uncertain figures. The handling of such figures may even benefit from all the ‘classic’ formulae. During that period a great number of dissertations, papers in journals and conference papers discussed this transition, until this new paradigm reached a high and stable level of acceptance in the 1980s.
A thorough theoretical and general description of the Bayesian statistical theory is given by Georg Apostolakis (ref. 31). Professor Dr. Ove Ditlevsen describes applications and
experiments in civil engineering in his dissertation (ref. 37). Conclusions from extensive Norwegian use of Bayesian statistical theory through two decades are described by professor Klakegg (ref. 32), and later summarised by Berg (ref. 30).
The first scientific description of the specific area of subjective quantitative evaluations was published as long ago as 1975 by the Swedish professors Spetzler and Stäel von Holstein in a prize-winning paper in the most respected journal, ‘Management Science’ (ref. 34), followed up by Lange in 1985 (ref. 33), and Lichtenberg (ref. 1).
Another form of verification is the vast series of full-scale ‘experiments’, in which an estimated project duration or investment is compared with the final actual result. Since 1980 several hundred such ‘experiments’ have served to verify the relevance of using the Bayesian theory.
Chapter 1.5
The cash flow and Net Present Value techniques
The well-known cash flow technique and the Net Present Value concept seem highly relevant here. However, these well-known basic tools must be adapted and tailored to meet the
complexity in this situation. This is further developed below and in later chapters.
The cash flow table is a well-known basic tool. For every relevant year it indicates in tabular form the value in terms of annual ingoing and outgoing payments to and from the defined system over the lifespan of a project or programme. All values are measured against a so-called zero alternative. In this case it is the fictional situation of no payment and no demolition of any unit.
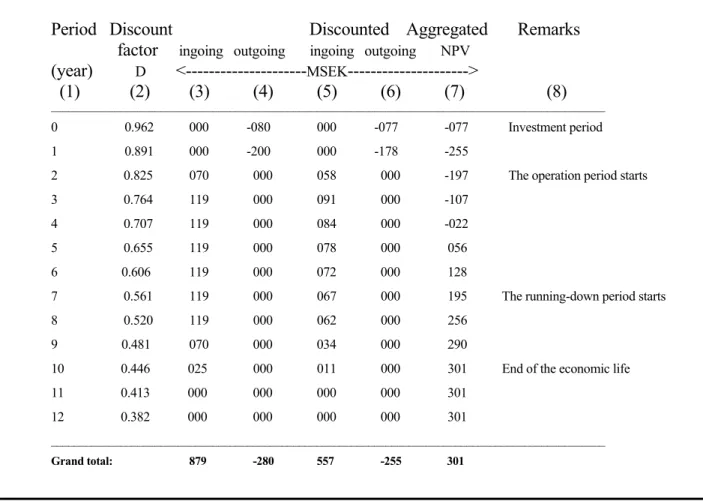
An example is given in figure 1.5a below. The annual values are given in columns (3) and (4) in the figure below. The discount factor (D) is shown in column (2). The discounted annual values are calculated by multiplying the annual values by the related discount factor (D). This is shown in columns (5) and (6) in the figure. The result depends on the chosen ‘annual discount factor’ (r). If another annual discount factor is opted for, such as 5% per year instead of 8%, the figures will change accordingly. The overall result will normally decrease with increasing values of the ‘annual discount factor’ (r).
Period Discount Discounted Aggregated Remarks factor ingoing outgoing ingoing outgoing NPV
(year) D <---MSEK--->
(1) (2) (3) (4) (5) (6) (7) (8)
________________________________________________________________________________________________
0 0.962 000 -080 000 -077 -077 Investment period 1 0.891 000 -200 000 -178 -255
2 0.825 070 000 058 000 -197 The operation period starts 3 0.764 119 000 091 000 -107
4 0.707 119 000 084 000 -022 5 0.655 119 000 078 000 056 6 0.606 119 000 072 000 128
7 0.561 119 000 067 000 195 The running-down period starts 8 0.520 119 000 062 000 256
9 0.481 070 000 034 000 290
10 0.446 025 000 011 000 301 End of the economic life 11 0.413 000 000 000 000 301
12 0.382 000 000 000 000 301
________________________________________________________________________________________________
Grand total: 879 -280 557 -255 301
Figure 1.5a A typical cash flow in tabular form. It deals with the lifecycle of an industrial product. The annual discount factor here is 8%. The resulting net present value (NPV) is shown at the bottom of col. 7. See figure 1.5b, which illustrates a similar context in diagrammatic form.
The correct handling of uncertainty related to NPV calculations requires a somewhat different approach. The reason is that the uncertainties of the payments from the individual years are generally statistically dependent on each other. If, for example, too high an estimate is made for an ingoing payment for year 4, then the next year’s payment is most likely also to err on the high side. These dependencies will at the very least disturb the proper handling of uncertain values, and often seriously distort the result.
This problem is solved by discounting the aggregated payments for a defined activity by the discount factor which relates to the point of time equal to the ‘point of gravity’ of the geometrical payment figures or cash flow diagrams. This issue is dealt with below in subsequent chapters.
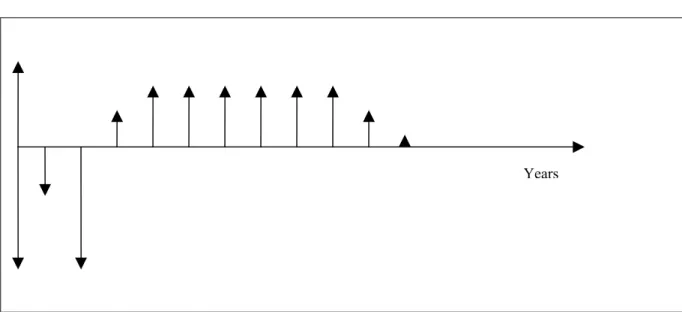
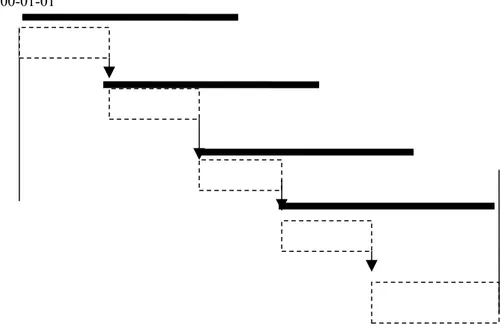
Figure 1.5b The cash flow from figure 1.5a in traditional diagram form.
The transformation of such a diagram from the traditional diagrammatic form into geometric figures is shown in figure 1.5c.
Figure 1.5c The same cash flow transformed into geometric figures.
The Net Present Value (NPV). The most important profitability criterion, the Net Present
Value or NPV can be calculated from these cash flow diagrams. The Net Present Value criterion, NPV, is probably the most acknowledged criterion for profitability and for a situation like this. It is calculated as a sum taking into account the signs of all contributing
discounted cash flow values over the total lifecycle of the project. In the example in figure
1.5a, it is simply calculated as the sum of negative and positive figures of columns (5) and (6), or directly as the final aggregated value in column (7), bottom line.
Years
Years
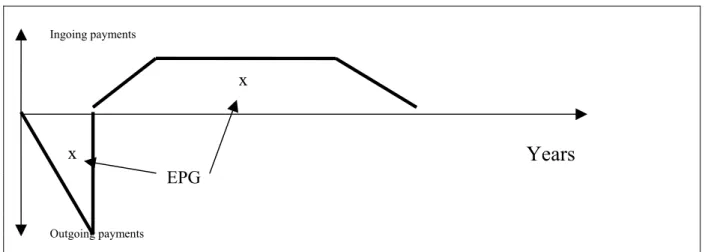
Ingoing payments
Figure 1.5d The cash flow in a suitable form for handling uncertainties. Note the ‘Economic Point of Gravity’, EPG. See the text below.
An alternative method for calculating the NPV is to multiply the total aggregated payments of a certain activity by the discount factor of the point of gravity of the geometrical figure shown in figure 1.5c. This point of gravity is therefore called the ‘Economic Point of Gravity’ or just EPG. This procedure offers the possibility of dealing with two statistically independent figures. The total of the payments will generally be sufficiently independent of the discount factor.
Chapter 1.6 The Successive Principle
Introduction
The Successive Principle with its underlying procedures is also considered a basic tool in this situation. Its ability to fulfil the above-mentioned basic requirements is well supported by theoretical findings and evidence from more than two decades of practical application, not least in Sweden. As this procedure is rather untraditional, it is further outlined below.
The basic philosophy behind the Successive Principle is (1) to make more efficient use of human common sense, creativity, intelligence and group synergy in order to identify all relevant factors; (2) to provide an unbiased evaluation of their impact; and finally (3) to handle the many
subjective uncertainties in a scientifically correct manner.
The principle has been used for many years in most private and public areas to support, improve and facilitate decision-making, planning, scheduling, estimating, allowance & guarantee
discussions, commercial risk and opportunity analyses, strategic planning, project audits, follow-up, recovery of delays, as well as a support during the start-up and team-building phase of new ventures. Ingoing payments Outgoing payments x x EPG
Years
Applications
The applications and benefits are primarily the following three:
(1) It is possible to make extremely realistic budget estimates, commercial prognoses, project durations, etc., and thus largely eliminate overruns and other unpleasant surprises. This can even be done at a very early phase of the plans.
(2) The responsible managers receive a “top-ten list” of critical and/or promising aspects, which allows them to exploit the positive opportunities for further progress and to protect the project or programme against risks in good time.
(3) The mutual understanding among the key individuals involved of the given project or programme, its aims and characteristics is radically improved, thereby also improving the crucial thrust and team-building process.
The major issues
The basic facets are (1) consciously to include all factors of importance: not only the physical and formal items, but also ‘fuzzy’ and even sensible matters; (2) openly and correctly to control and handle uncertainty according to recent scientific knowledge, and even to consider
uncertainty as a highly exciting aspect of planning and management.
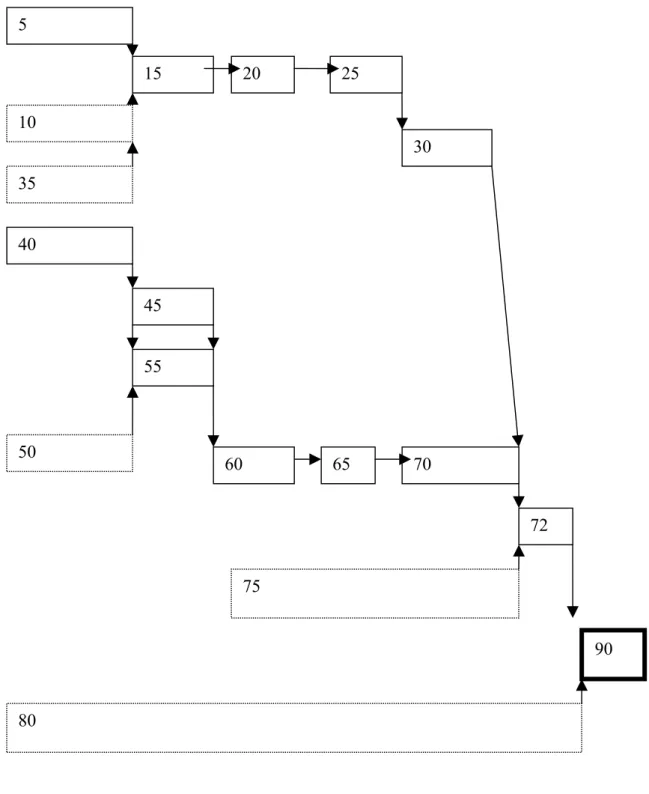
For reasons of overview and rapid performance, a third facet is (3) to work top-down, starting with main items, and successively developing a work breakdown structure in those few areas where local uncertainty is absolutely critical. See figure 1.6a, next page.
Due to the complexity and fuzziness of projects and other activities today, it is considered essential to perform the analyses jointly in a group of key persons. This also has positive side effects, such as greater consensus and improved team building.
The application of the Successive Principle is linked to a management style which focuses on cooperation and includes a degree of openness which allows the participants to speak out about all sorts of relevant uncertainties.
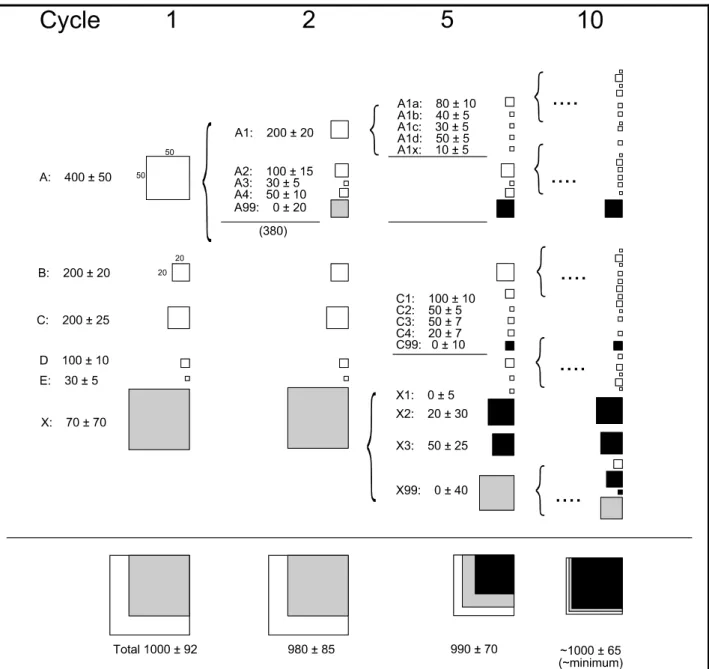
Figure 1.6a An illustration of the strong "intelligent" successive detailing process embedded in the Successive Principle. The left column represents an estimate of 5 main items denoted A, B etc, plus an allowance, X, for ‘unknowns’,. The sides of the squares represent the local uncertainty while the areas of the squares indicate the local contribution to the uncertainty of the grand total. Adding all the squares together therefore results in the grand total
uncertainty. The large square on main item no. 1 indicates that the next relevant step is to detail this item. The uncertainty is in this manner broken down into small elements. This detailing process continues until no further reduction of the uncertainty is possible. The white areas indicate local uncertainty which can be reduced through further detailing. The grey areas relate to uncertainty from Overall Aspects, while the black areas represent remaining, unavoidable uncertainty. In this manner we focus successively and efficiently on a grand total with a minimum of uncertainty. The squares below the bottom line indicate intuitively to the user how close we are to the optimal result.
The general procedure outlined
The procedure follows the steps below:
1. A proper group of key persons is established, its composition determined by the purpose of the specific analysis. The first task of the group is to discuss in depth the project or task, its firm preconditions, limits, and objectives.
2. All general sources of potential uncertainty are identified, organised into groups and defined into a base case reference and potential deviations according to relevant sub-routines. 3. A set of specific main items/main activities (in the following abbreviated to items) is chosen and described. Their numerical values are evaluated, using the group triple estimating technique. A set of overall correction items is added, based on potential deviations from the base case reference, defined as per item 2 above.
4. The numerical calculations are performed, using statistical rules, ending in the mean and the uncertainty of the total and not least a priority figure for every item. It indicates the relative importance of the individual items to the total uncertainty, and is further developed below. 5. The most critical items are successively detailed. The priority figure, is a powerful guide in this detailing process. This successive detailing and re-evaluation continues until a practical minimum uncertainty is reached.
6. The result consists of a highly reliable mean value, the related uncertainty, and not least a "top-ten list" of the remaining major sources of uncertainty in order of their relative importance or priority. This last list is typically followed by a set of action plans, proposed by the analysis group.
Some key aspects
a. Identify Potential Sources of Uncertainty
An analysis group is formed and headed by an individual with sufficient competence and experience in the Successive Principle.
The first task of the group is in-depth discussion of the project or task, its scope, its firm preconditions, its unique aspects, as well as the formal and informal objectives and priorities of the primary stakeholders. All participants should share the same understanding of this remit. All general sources of potential uncertainty, called ‘Overall Aspects’, are then identified (using brainstorming techniques), organised into statistically independent groups, called ‘General Issues’, and given a base case reference definition, as well as a description of potential deviations due to the actual situation.
b. Quantification
A set of specific main items/main activities is chosen and described. This list is supplied with correction factors or items related to the above-mentioned set of Overall Issues. The numerical
figures are considered to be uncertain and dealt with according to the Bayesian statistical theory, which has proved highly valid in this area.
The numerical value of each main item is evaluated, using the group triple estimating technique (see Chapter 3.6 and 4.3). The main items are evaluated subject to the defined calculatory base case reference situation, while the correction factors reflect the conditional potential deviations from the above reference situation. All items and factors are in this manner sufficiently
statistically independent of one another.
This solves the old problem of statistical dependence and related correlation coefficients, which has hitherto seriously undermined either the relevance of the results or the practical operability. The quantification is further outlined in Chapter 3.6.1.
c. The mean and variance of the total result
All input items, whether costs, volumes, unit prices, durations or percentage additions to other items, are transformed from a triple estimate (min, most likely, max) to their mean values, m, using the approximate formula: (min + 2.9 x likely + max)/4.9. The uncertainty is most efficiently measured as the standard deviation, s = (max – min)/4.65. The relative standard deviation, s/m, is applied where an item consists of more than one factor.
The mean, M, of the total is then calculated by using all mean values, m, as deterministic figures. For each local uncertainty its conditional effect, S, upon the total result is derived. Adding together the square of all values of (S x S) will equal the (S x S) of the total result. The individual values of (S x S) are called the local priority figure, P, because it illustrates the relative
importance of the item to the uncertainty of the total result. It is analogous to the statistical concept of variance.
The uncertainty of the total result, as has already been indicated, equals with sufficiently good approximation the sum of all priority figures. Only a second-order marginal addition is needed. The statistical distribution function of the total result can normally be assumed to follow the so-called Normal distribution or Gauss curve. Only in the case of a dominant and skewed local uncertainty will the resulting curve be slightly skewed. In such cases it is possible to make a more exact calculation of the resulting curve. Either/or events also require a supplementary sub-routine.
Statistical dependencies and their related correlation coefficients and co-variances are
deliberately eliminated to the appropriate degree. This is primarily achieved through the handling of the Overall Issues, and by consistently working with the conditional uncertainty.
d. Successive detailing and results
Guided by the priority figures, the most critical items are successively detailed. In this manner the group performs a highly efficient and "intelligent" detailing of the most critical items. After relatively few such steps (typically 4 to 12), of which some may be further specifications of sub-items, the items carrying unavoidable uncertainty will dominate more and more. After a while they typically represent 80 to 90% of the total uncertainty (variance).
This means that we have come close to the minimum uncertainty of the total, and also to a highly reliable mean value, a derived uncertainty, and not least the top-ten list of the remaining major sources of uncertainty in order of their relative importance or priority.
The total mean value (and the uncertainty) is reliable and realistic for four reasons: (1) all significant matters are included, directly or indirectly; (2) the uncertainty is dealt with in a controlled, scientifically sound manner; (3) evaluation biases are kept under control using a proper evaluation technique as discussed below, and (4) detailing has been performed in all critical areas.
A top-ten list is typically followed by a set of action plans, proposed by the analysis group by way of conclusion. At its best, the action plan in tabular form lists the proposed actions as key words, each with the initials of one of the group members together with a date by which he/she agrees to have achieved a result.
At a supplementary session the group may introduce the new information from the resulting actions into the analysis and thereby efficiently improve the result.
e. Evaluation technique
“Hunch evaluations” play a dominant role in these procedures. Many pitfalls threaten "hunch evaluations" or "qualified evaluation". The evaluation technique has therefore been developed in order to improve the quality of the analysis results.
The evaluation technique implements knowledge of evaluation pitfalls and indicates sub-procedures to avoid systematically any errors from such pitfalls. Casual errors, on the contrary, will in part eliminate each other in a controlled manner, according to the classic statistical laws. Originally inspired by research from Stanford Research Institute in the 1970s, conducted by S. Spetzler & Stäel von Holstein, further research in 1984 at the Technical University of Denmark by Nils Lange and Steen Lichtenberg has identified a set of pitfalls and, to some degree, also the underlying mechanisms.
Experiments have shown (1) that most of us are very untrained; and (2) that we can learn and train ourselves to be considerably better. But above all the procedure of the so-called group triple
estimating has proved to be able to yield non-biased results, if conducted in the right manner.
The essence of this procedure is (1) to establish a balanced evaluation or analysis group, (2) to allow each participant in the group analysis session to make his/her entirely personal triple estimates without any interference; and (3) to use the most extreme maximum and minimum in the group, while the most likely is the average of the individual evaluations. Due to limited space, detailed discussion continues in ref. 1.
Chapter 1.7 Comments on the discount rate
KAF has established a certain series of annual discount factors, namely 4% p.a. until 2020 and 2½% thereafter (in this report called the ‘KAF rate’). The first figure is based on the existing financial contracts. The second figure seems to have been chosen deliberately as being on the ‘safe side’.
The absolute interest rate depends in the short run on the investment policy, which can be more or less speculative. In the long run this variation may to some degree be levelled out, the reason being that some more speculative and high-rate investments may yield a loss, which again level out the average profit towards that of more conservative investments.
Inflation will also have an impact on interest rates unless future financial contracts specifically deal with real interest rates. The lenders will subtract their anticipated future inflation in the short run. This anticipation will often be biased towards recent historical inflation. The result of this is supported by historical evidence. The historical annual real interest rates show waves with a length of 5 – 10 years. They correspond to the general economic trends/waves. After a period of high inflation people cannot imagine that low inflation could ever be a reality and vice versa. Taking the long view, it is not without interest that safe investments over the 150 years leading up to 1980 yielded an average real interest rate of 3.3% p.a. Updated to today, the corresponding figure would be approx. 3.5% p.a. The relevant series of future rates is uncertain. Among the reasons are future inflation, the investment policy, the future world economy, etc. All these matters cannot be calculated but have to be evaluated using a qualified guess.
For this reason the best obtainable expected value is realised using a series of group triple estimates covering the parameters outlined above and below. The reason is that this sub-procedure reduces the many pitfalls to a minimum, and thus minimises the final bias. As an additional benefit the uncertainty is also measured. This allows the relative importance of these uncertainties, compared with the other sources of uncertainty, to be documented. It is stressed that the relevant analysis group differs in this respect from the main analysis group dealt with in the rest of this report.
A similar evaluation process has been performed in Sweden a few times, to the author’s knowledge. The results of these shall not be mentioned here, as the evaluation that is advocated here must not be biased by past evaluations which may have been made under different conditions.
The resulting three series of future annual real interest rates, which are relevant to this particular situation, can be based on the present/historical interest rate, future changes, the current rate of inflation, the future changes of that parameter, the differential rate of inflation for the sectors which are relevant here, the future investment policy, etc. If an unbiased evaluation is conducted of each of these parameters, their sum will benefit from the statistical levelling effect.
Chapter 2 Organisation of the procedure and
the analysis group
Chapter 2.1 Organisation of the procedure
Responsibility
The responsible body (called the ‘analysis sponsor’ in this study) needs to be independent of any private interests and at the same time to have professional knowledge of the area. The first requirement follows from the need to ensure an unbiased result; see the critical aspects 1 and 2 in Chapter 1.1 above. The second requirement is vital to the ability to exercise efficient, ongoing quality control throughout the process.
Organisational and political aspects
The above-mentioned requirements indicate SKI as having clear, high-level responsibility for the estimate procedure. In fact it is seen as the only body which fulfils both criteria. The question of which parts of the procedure can and will be delegated to SKB or to other parties is outside the scope of this study. However, the overall responsibility should never leave SKI. Those parts of the procedure that will be delegated out must be followed by detailed
requirements as to the procedure and the process, as well as to efficient methods of follow-up and control.
There is, however, one point at which the four nuclear power plant company units should be given authority, possibly represented by SKB. All four should discuss and decide upon a precise model of apportionment of the total costs between them. Such a model allows SKI to calculate fair and accepted specific unit fees for each unit, and also the final values of safety allowances 1 and 2 for each unit.
The ideal solution would be that SKI, as analysis sponsor, adopts the role of managing and responsible body for establishing the analysis group and for implementing the procedure. This, however, may diminish SKI’s traditional role as controller. According to newer public attitudes, concepts such as Private-Public-Cooperation, PPC, may relieve this hindrance to the above-mentioned ideal solution. It must also be remembered that the procedure suggested in this study is an integration of the estimate performance and the quality control, using the synergy optimally.
However, the possibility remains of keeping to the traditional divided roles of the ‘doers’ and the ‘controllers’, whereby the function of procedural manager (in the following called
‘Analysis Management’ or ‘analysis facilitator’) is delegated out, while SKI retains the
high-level role of supervisor and controller. In any event, the appointment and payment of the facilitators should be undertaken by SKI. Similarly, the final appointment of the analysis group members should be left to SKI, albeit based on suggestions from SKB.
SKB could technically do this job according to a set of rules laid down by SKI. But they would always be open to suspicion that their particular interests bias the outcome. The fact
that this might not be the case does not alter this unacceptable situation. However, as
identifying the body which will perform the function is not a matter for this study we shall use the non-specific term ‘the Analysis Management’ in the text below.
It is a prerequisite that the procedure is structured and operated in a way that will give ordinary people, and not least politicians, board members and other decision-makers
confidence that no particular interest group has undue influence on the result. In other words, that they will immediately trust that the result is a neutral one.
Many details in the procedure are designed to obtain such independence of any parties’ interests. However these matters will not be apparent to ordinary people and their
representatives, the politicians. Only the organisation and composition of the analysis group is visible and understandable. This should therefore be transparent and so arranged as to leave no grounds for suspicion.
This situation seems to favour the above-mentioned ideal solution.
Comments on evaluating future political decisions
Another issue which has been raised is whether it is acceptable that an analysis group evaluates the outcome of future political decisions, decisions not yet reached. It seems that this is indeed acceptable and even necessary for two reasons. First, that the analysis group will need to evaluate the full range of possibilities before assessing the odds for the available alternative decisions. The political decision-makers are still completely free to choose whichever solution they feel is the relevant one. Secondly, it will be in the best overall interests of the political decision-makers that the future is evaluated with maximum realism. This implies that the overall outcome or impact of future decisions is properly included in the analysis result.
The practical organising of the procedure
A contract should be negotiated and signed between SKI and those parties to whom
responsibility is delegated, and who will manage the procedure or parts of it. SKI will have the initiative, due to its ultimate top-level responsibility in this matter. For the same reason, SKI will in principle function as the analysis sponsor.
The two appointed facilitators (one principal and one deputy) will be one party in this matter. They should be highly competent and experienced in the relevant analysis techniques.
Another important party is the body that will be responsible for the practical implementation. In addition to SKI itself, SKB seems to be one of the natural candidates for this role as the ‘Analysis Management’.
A steering group should be established to coordinate and follow the process. In addition to the facilitators, it could consist of one or two representatives of the analysis sponsor and the Analysis Management respectively. The objective of this group is to ensure correct and efficient implementation of the procedure, and not least to handle proactively any misunderstandings, disagreements or other problems which may arise.
Chapter 2.2 Establishing the main analysis group
One of the first tasks of the Analysis Management would be to establish a main analysis group according to criteria outlined below. Such a group will be a highly important
instrument during the whole process. Because of the importance of the right composition of this group, SKI should, as has already been mentioned, in any event retain the right to authorise the composition of the group before the process starts.
The constitution of the analysis group
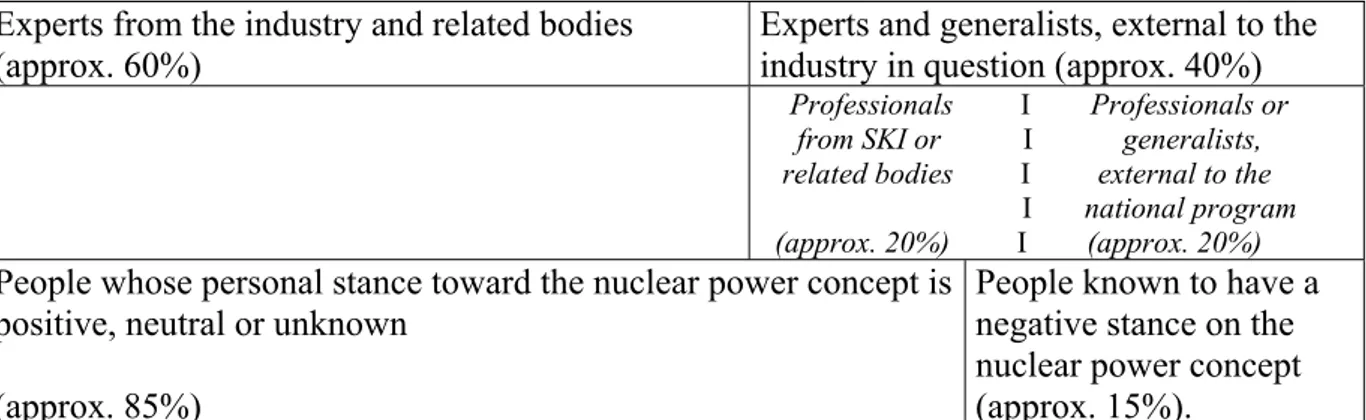
The main analysis group should include a balanced mix of between 15 and 20 competent experts and generalists. A number of the experts will for obvious reasons be involved in the programme. They may therefore generally tend to be somewhat optimistic about a successful implementation and to risk understating difficulties, and thus be biased on the optimistic side. Some of the external appointees should therefore play the role of the devil’s advocate, i.e. focus upon problems and obstacles of any kind.
A suitable balance might be: approx. 60% of the members could be experts in this area, while the remaining 40% would be external to the company units or their organisation, SKB. Half of the latter fraction or approximately 20% should be external to the whole national
programme and not involved in the related political discussion. Among this fraction, at least two members should be known to have a negative stance on nuclear power programmes. These suggested rules are illustrated in the table below.
Experts from the industry and related bodies (approx. 60%)
Experts and generalists, external to the industry in question (approx. 40%)
Professionals I Professionals or from SKI or I generalists, related bodies I external to the I national program (approx. 20%) I (approx. 20%)
People whose personal stance toward the nuclear power concept is positive, neutral or unknown
(approx. 85%)
People known to have a negative stance on the nuclear power concept (approx. 15%).
Figure 2.2a Suggested rules for manning the analysis group.
In the interests of maintaining the balance of the group in case of absences due to sickness or other causes members should (1) be invited in good time, e.g. 5–8 weeks before the first analysis session; and (2) a qualified deputy should be appointed for each member. Each member of the analysis group should be instructed to participate as an independent person without bringing any ‘agenda’ or restriction from his/her organisation. He/she participates because he/she is supposed to be able to contribute to an optimal result.
Under such circumstances it should be permissible for personnel from SKI to participate without damaging SKI’s role as an independent top-level controller.
Reconstitution of the group is dealt with in Chapter 2.3 below.
The practical establishment of the analysis group and other initial
preparations
An ‘Analysis Management’should be established, consisting of the facilitators and one or
two representatives of the analysis sponsor and analysis manager. One of its first tasks will be to realise the practical establishment of the analysis group, inclusive of deputy members. The search for the right persons and coping with diary problems for the planned sessions should be given ample time. During the process of establishing this group the Analysis Management may consult significant involved parties and interest groups. Representatives of some of these parties may, if appropriate, be included in the process as observers. This would enable them to gain a better understanding of the background and to accept the results. During the process, sub-groups may be set up. This may for example be appropriate when detailing the authorities’ costs.
In addition to corresponding with members of and candidates for the analysis group and organising the calendar for analysis sessions, the Analysis Management has the task of organising the physical facilities for the following analysis group sessions. The Analysis Management also produces drafts about the following issues:
* A summary of the procedure and underlying principles. * A few possible scenarios as suggestions for the first session. * A detailed set of provisional firm preconditions.
* A proposed schedule structure and a calculation structure.
The above suggestions are mailed to the members of the analysis group, as well as to the deputies, well ahead of the first analysis group session.
Chapter 2.3
Comments on the periodical updating of the analysis
The period between two consecutive analyses
The procedure which is suggested in this report, relates first of all to the ‘first performance’, which may be performed in the year 2004 or later.
The period between two consecutive analyses is left as an open question here. Such a period might be one, two or three years. However, SKI has annually to make a final evaluation as a
basis for its recommendation to the Government. Only the basic information delivered to SKI might not be revised annually.
It seems appropriate to continue the present annual update analyses, in order to improve the estimate steadily, while introducing new or more specific information acquired during the year.
On the other hand, the procedure may risk stiffening into a mere ‘mechanical’ process, where ‘the same procedure as last year’ may be supplied by ‘the same figures as last year’. The considerable investment of resources involved will also support the solution of updating every second or even every third year.
The basic procedure described in this report could by and large be repeated at each update, benefiting from an increased ‘routine and repetition’ effect. However, it seems to be a problem that existing visible data tends to “shadow” emerging new or changed data. The following detailed corrective actions might reduce this potential problem.
As a first action, the participants should agree that a new evaluation is in principle more relevant and updated than data from the previous analysis. Secondly, everybody should avoid looking at the relevant previous data, when updated data has to be evaluated. The facilitator will have the primary responsibility of ensuring that such previous data are not visible during the analysis sessions.
A critical view of the firm preconditions will also be of importance. It is also very important to conduct a new brainstorming process on every updated analysis, in order to optimise the rational process of identifying new upcoming issues. Experience shows that studying the previous year’s list will seriously hinder the emergence of such new issues. After the
brainstorming process the previous list can be used as a control for any topic which may have been overlooked.
It will hardly be necessary to establish brand new detailed evaluations from the technical analysis sub-groups. However, they should focus on any specific or gradual changes and make a new independent evaluation in all such cases.
During the important sub-procedure during which the main analysis group evaluates the impact of the overall Issue Groups, a new independent evaluation should be performed without knowledge of the previous figures. Slight casual differences between figures from year to year should be allowed and accepted. It is much more important that the overall picture of any given year is healthy, fully updated and not biased by previous data. The above casual local differences will level each other out in the total result, following the basic
statistical ‘law of large sets of figures’. In conclusion, an annual analysis process seems most appropriate.
Reconstitution of the analysis group
In the long run, an appropriate balance should be established between considerations of continuity on the one hand and a focus on gradually ensuring new blood within the analysis group. A policy of replacement and terms of reference should be drawn up reconstituting the analysis group while at the same time ensuring a sufficient degree of continuity. One model
could be that participants in the new initial group draw lots for either 1, 2 or 3 periods. The effect would be that one third of the participants would be newcomers, and two thirds would ensure sufficient continuity.
Chapter 3 A proposed procedure
Chapter 3.1 An Overview
The whole estimating procedure is summarised below in two steps in order to give an
overview. The first phase, the preparations before the first analysis session (sub procedure no. 1, next page), has already been dealt with above.
The major sub-procedures, nos. 1 – 9, are broadly outlined in table 3.1a below, while the individual sub-procedures are illustrated in greater detail in the following table 3.1b. All procedures are then developed in detail in the following Chapters 3.2 to 3.9.
Sub-procedures
Comments
1. Organising the procedure and the analysis group
SKI initiates the establishment of an analysis organisation and delegates responsibility to the relevant parties. An Analysis Management group is also established. One of its first tasks is to establish a proper analysis group.
2. The qualitative analysis phase
The scope of and preconditions for the evaluation are defined. Also a comprehensive hierarchical list of ‘General Aspects’ of uncertainty, grouped into a few ‘Overall Issues’.
3. Scenarios, alternatives and structures
A few relevant scenarios are defined together with a minor set of agreed ‘major either/or alternatives’. A schedule structure and a cost calculation structure are also defined.
4. Cost-sharing modelling SKB coordinates an agreed cost-sharing model for the four individual company units.
5. Definitions of a base case reference, worst and best extremes
The list of overall issues of uncertainty (established in sub-procedure 2) is supplied, with a base case reference as well as key words on potential deviations from the defined base case.
6. Quantification I
Schedule, interest rates and other preparations
For each scenario and alternative, the expected programme duration is evaluated, followed by a calculation of the expected start and finish of the primary activities . Cash flows are prepared as well as the expected future real interest rate.
7. Quantification II
The total base case estimate
Total estimates for each alternative and special scenarios under the base case conditions. This includes sub-estimates of the authorities’ costs and other important elements.
8. Quantification III Finalising the estimating process
The above estimates are supplemented by the effect of the previously defined overall issues, resulting in realistic, expected total results. Some special simulation runs result in the size of impact of uncertainties in the timing and the real interest rates. A corresponding unit fee for each unit is calculated as well as proposed values of the two safety allowances.
9. Final reporting A final report with summaries and conclusions is produced.
After the completion of each sub-procedure a working report should be drafted by the facilitator and then checked by the participants until consensus is reached.
The sub-procedures are further specified and described in table 3.1b below.
Sub-procedures
Active parties
Results
11. Organising the procedure and the analysis group 1.1. Initiate and delegate the
procedure SKI A clear organisation, and delegation ofresponsibility to the relevant parties. 1.2 Establish the main analysis group
and other initial preparations Analysis Management(abbreviated AM) A competent, broad, and balanced group,including deputy members; drafts concerning the scope and other preconditions; and finally, physical locations prepared. 2. The qualitative analysis phase
2.1 Scope and preconditions for the
evaluation AM/Main analysis group A well-defined scope and basis for the wholeanalysis procedure. 2.2 Identification and grouping of
major sources of uncertainty Main analysis group A comprehensive hierarchical list of overallissues (in terms of time as well as costs). 3. Scenarios, alternatives and structures
3.1 Principal scenarios AM/Main analysis group Definition of a few relevant scenarios2
3.2 Major either/or alternatives AM/Main analysis group A minor set of agreed ‘major either/or alternatives’.
3.3 Schedule structure AM/Main analysis group An agreed schedule structure. 3.4 Cost calculation structure AM/Main analysis group An agreed cost calculation structure. 4. Cost-sharing modelling SKB/units An agreed cost-sharing model. 5. Definitions of a base case
reference as well as deviations
Main analysis group A well-defined basis for the technical sub-estimates.
6. Quantification I, schedule, cash flows and interest rates
6.1 Quantification in general The ability to obtain unbiased figures. 6.2 Standard schedule analysis3 Main analysis group The total duration of the defined scenarios
and alternatives.
6.3 Expected timing of activities Main analysis group The expected start and finish of the principal activities for the defined scenarios and alternatives (see footnote 3).
6.4 Cash flows and EPGs4 Main analysis group Cash flows and EPGs with expected values.
6.5 Real interest rate SKI/KAF A triple estimate of the set of rates deemed relevant to this particular programme. 6.6 Discount factors Facilitator/AM Tables of discount factors based on the
decided rates. 7. Quantification II, the total base case NPV estimate
7.1 The first total base case estimate Main analysis group A total base case estimate for each defined alternative and special scenario (however not for the ‘earliest’, ‘most likely’ and ‘latest’ scenarios)
7.2. NPV of authorities’ costs A sub-group A neutral base case estimate of this share of the total costs.
The table continues next page
1 Each sub-procedure includes that a sub-report is drafted, reviewed by the participants, and adjusted according
to their comments. Then finally accepted, if needed. This ensures current consensus.
2 Including a fictive ‘Zero scenario’, which presumes that all company units close down within a year. Other
scenarios include at least ‘earliest’, ‘likely’, and ‘latest’ scenarios.
3 The activities are all evaluated assuming the same defined base case reference, while the overall issues appear
as a final contingency activity.