FULL SCALE PROCESS DESIGN FOR ENERGY
RECOVERY FROM APPLE WASTE AT THE
EPLEBLOMSTEN JUICE FACTORY
Timothy Greer
Yuan Song
Wenjun Wu
Deshai Botheju
Rune Bakke
Telemark University College, Norway
ABSTRACTThe aim of this project was to design a biogas process to recovery energy from the apple waste for Epleblomsten juice factory, The apple waste was proposed to be treated by extracting a liquid with high organic content from the solid apple waste and treating this leachate, From other studies the apple waste leachate organic content had been found to be in the range from 80 to 180 kg COD/m3 _ These values and information regarding the leachate composition were used to design and simulate various full scale processes, The factory energy requirement was estimated at 400 kWh during full production and reactor was designed and simulated at the various leachate concentrations to produce enough energy to meet the demand of the factory, It was found that a traditional completely stirred mixed reactor (CSTR) required a volume of-74 m3 to produce enough biogas for the energy demand while a UASB reactor of 18,5 m 3 volume was detem1ined capable of producing the same peak biogas demand, The UASB process requires a relatively particle free feed, obtained by extracting a leachate from the solids, It is therefore concluded that a high efficiency biogas process can be obtained by treating leachate instead of the whole waste slurry, It was also theoretically determined that the biogas from the waste leachate can meet the factory energy demand all year around and energy (biogas) production rates could be adjusted by adjusting the feed of leachate to the reactor,
KEYWORDS
Apple waste; Biagas; Design; Energy, 1 INTRODUCTION
The Epleblomsten apple processing facility in Norway currently produces apple waste from juice production and this report focus on the use of this apple waste to produce energy as biogas for factory operation, Over the autumn period between mid September and mid December when Epleblomsten is processing the apples, approximately 2,000 kg/d of apple waste is produced, Assuming the production is 7 days a week for 3 months then there is about 180 tons of apple waste produced per year [I], The aim is to design an energy recovery system for Epleblomsten which converts the apple waste into biogas which can then be subsequently used as energy within the plant and maybe distributed to nearby neighbors, The apple waste will be stored in a storage tank and leachate drawn out via a sieve arrangement
V = nRT = I 785x8.314x(273 + 35) = 45m3(350)
when required therefore the leachate flow can be adjusted allowing control of the biogas production,
An estimate of the COD concentration of between 80 and 180 kg/m3 was obtained from other experiments [I], This infonnation was then used to estimate the required flow of apple waste leachate to cover the energy requirements of the plant. The factory at Epleblomsten has a varying energy demand throughout the year so it is best to size the system to match the maximum demand, The process behavior during seasons with lower demand is simulated to observe how such a system can handle large production variations, This was done both for a traditional CSTR reactor design and a high rate UASB, The aim of the study is to estimate process volumes, process behavior and to evaluate the feasibility of such a solution to handle the energy requirements of the fruit juice factory,
2 DESIGN CRITERIA
The Epleblomsten fruit juice factory has the following energy requirements through the year: 400 kWh during the main production phase; 200 kWh during the winter; I 00 kWh during the spring; 30 kWh during the summer. The energy requirement of the juice factory is about 68 MWh per year, which requires 19,125 kg of theoretical COD conversion of substrate to methane, 180 tons of apple leachate waste is produced each year [I], which, at a COD concentration of 160 kg/m3 is 28,800 kg of COD, This implies a potential energy surplus of ~35 MWh per year (assuming I kg COD converts to 3.55 kWh). If the apple waste is allowed to age and decay for longer periods, then the feed COD concentration in the leachate could increase leading to a larger energy surplus for each year.
I kW is I kJ/s therefore I kWh is 3,600 seconds multiplied by I kJ = 3,600 kJ or 3.6 MJ. To produce the maximum demand of 400 kWh requires 400x3.6 = 1440 MJ of energy. Methane has a heat value of 36 MJ per Nm3 [2) which equates to 40 Nm3 of methane required for 400 kWh. The reactor is operating at 35"C therefore need to correct for temperature.
= PV = 101325x40 =
n RT 1785mols
8.314x(273)
P 101325
From literature [2) at 35 ° C 0.4 m3 of methane is produced per kg of COD substrate converted. Therefore 400 kWh requires 45/0.4 = 112.5 kg COD of substrate.
2.1 CSTR design
Feed volume required is estimated based on the range of apple waste COD concentrations reported: At 80 kg COD/m3 then require 112.5/ 80 = 1.4 m3 of inlet flow per day while 180 kg
COD/m3 requires 112.5/180 = 0.6 m3 feed per day.
Various sized CSTR volumes where simulated and an optimal trade off between capital cost of building a large volume or less ability to respond to changes with a smaller volume was reached.
2.2 UASB design
By separating the HRT from the SRT using a UASB reactor where the solids are effectively kept within the reactor then the HRT can be reduced, A key design requirement based on
practical experience is to keep the solids loading into the reactor at less than 24 kg COD/ml d
° l
(at 35 C) [2]. Recommended design loading rate is 18 kg COD/m day [2], For 400 kWh 112.5 kg of substrate is required to be converted therefore the volume of the reactor is
estimated at 112.5/18 = 6.3 ml , To allow for a large factor of safety [3], and thereby a high
degree of conversion of feed to biogas, a liquid volume of 18,5 ml is chosen, It is noted that
the design volume is independent of the feed concentration for such concentrated feeds, because it is directly dependent on the kg of COD required per day,
3 METHOD
The ADM I model implemented in Aquasim [3] was used to simulate full scale CST R and UASB reactors. The initial values in the model are given in Table 1 and are based on ADM I values with slight modifications based on lab experiments [I], The input state values are given in Table 2 for the values which are deemed to be major contributors to the feed concentration, estimated based on small scale batch experiments [I]. The feed concentrations
substrate values add up to 160 kg/ml which was deemed a representative value for this apple
waste leachate feed,
Table l, Initial condition for CSTR and UASB reactors,
State Initial State Initial State Initial
concentration concentration concentration
(kg/ml) (kg/ml ) (kg/ml)
Saa 0,0056 S hion 6,28E-07 Xe 0,2
Sac 0.0047 SI 1.67 X c4 0,5 San 0,00457 Sin 0.0324416 X ch 0.010345 S bu 0.014 Spro 0,01796 X fa 0,390943 Scat 0.0398 S SU 0.1 X h2 0.223733 S ch4 0 S va 0.001172 XI 1,994 S CO2 0 X aa 0.2 X Ii 0.002932
s fa
0,00106 X ac 1.0 Xpr 0.010345 S h2 0 X ro 0,7 S hco3 0.06718 X SU 3.1 CSTR simulationThe flow is varied throughout the year to meet the required energy requirement. Q;n in Table 3 is the flow required for 400 kWh and the flow is pro-rated down for the lower energy requirements of 200, I 00 and 30 kWh respectively. Step changes in flow rate are used within the simulation and the process responds to each flow change,
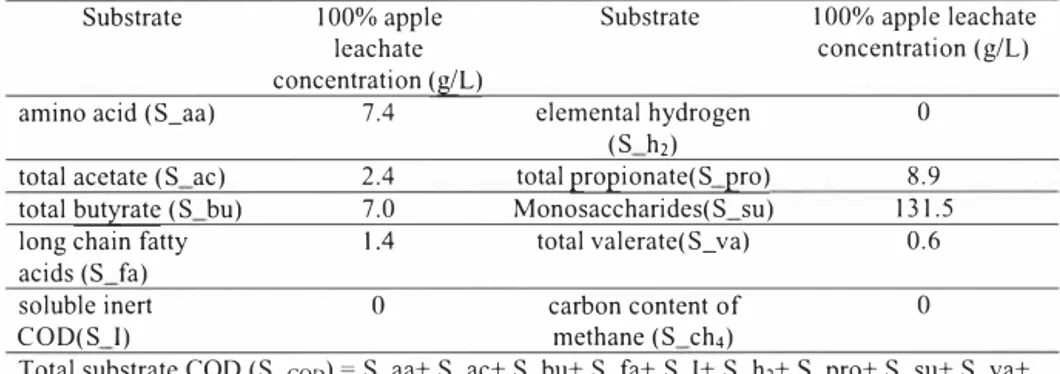
Table 2, Simulation input values for apple leachate feed from [/},
Substrate 100% apple Substrate I 00% apple leachate
leachate concentration (g/L)
concentration (g/L)
amino acid (S_aa) 7,4 elemental hydrogen 0
(S h2)
total acetate (S ac) 2,4 total propionate(S pro) 8,9
total butyrate (S bu) 7,0 Monosaccharides(S su) 131.5
long chain fatty IA total valerate(S_ va) 0,6
acids (S fa)
soluble inert O carbon content of 0
COD(S I) methane (S ch4)
Total substrate COD (S_coo) = S_aa+ S_ac+ S_bu+ S_fa+ S_I+ S_h2+ S_pro+ S_su+ S_va+
S ch4 = 159 /L
3.2 UASB simulation
The process simulated has a reactor volume of 18.5 m3 (as explained above) and a SRT of 30 days greater than the HRT. The inflow concentrations are the same as for the CSTR (Table 2). To avoid process instability is was found necessary to gradually change the input flow rate between the various levels over 30 days, to allow the reactor to adjust to different feed rates and obtain stable pH. For the simulations the flows and concentrations were varied as shown in Table 3,
Table 3. Inflow values used for the UASB simulations with afeed concentration of 160 kglm3 .
Time (d) Feed flow (m /d) Qin Increasing or constant
0 0 Increasing to 90 day value
90 0,35 Constant
180 0.18 Constant
270 0.05 Constant
330 0,05 Increasing to 360 day value
360 0,7 Constant
450 0.35 Constant
540 0.18 Constant
630 0.05 Constant
690 0.05 Increasing to 720 day value
720 0,35 Constant
4 RES UL TS AND DISCUSSION 4.1 Simulation of CSTR 74 m3
buffering capacity in the fonn of alkalinity addition while a larger volume had a larger capital cost. 74 m3 equates to a HRT of 105 days for the 160 kg COD/m3 waste stream.
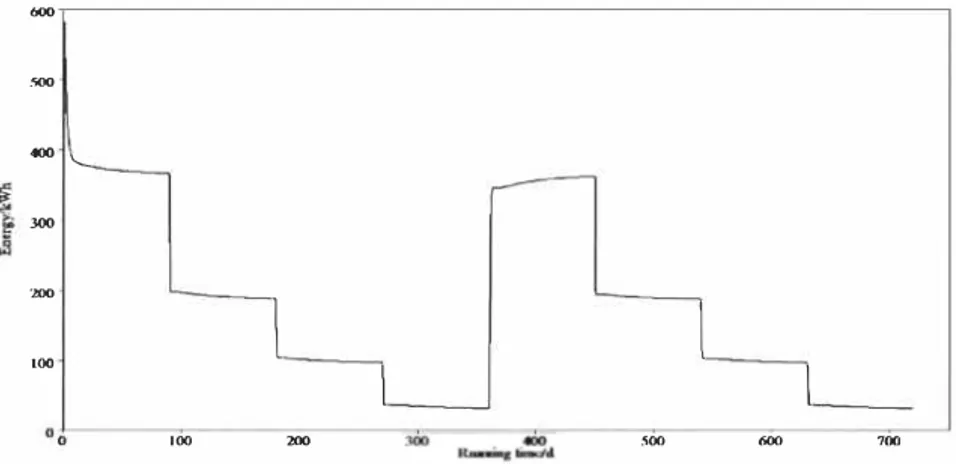
The simulated biogas production, presented as the corresponding energy value, is shown in Figure I (the energy is 8.85 kWh/m3 methane produced). The feed flow rate was varied each 90 days from 0, 7 to 0.35 then 0. I 8 and finally 0.05 m3/d. During start up, the flow is changed from no flow to a maximum of 0.7 m3 /d; this is increased over 20 days to allow the biomass to adapt. Also at the start of the next year when the flow is increased from 0.05 to 0.7 m3/d this is done over 20 days to allow for a smooth transition. At the other step changes in flow the system reacts well (Figure 1).
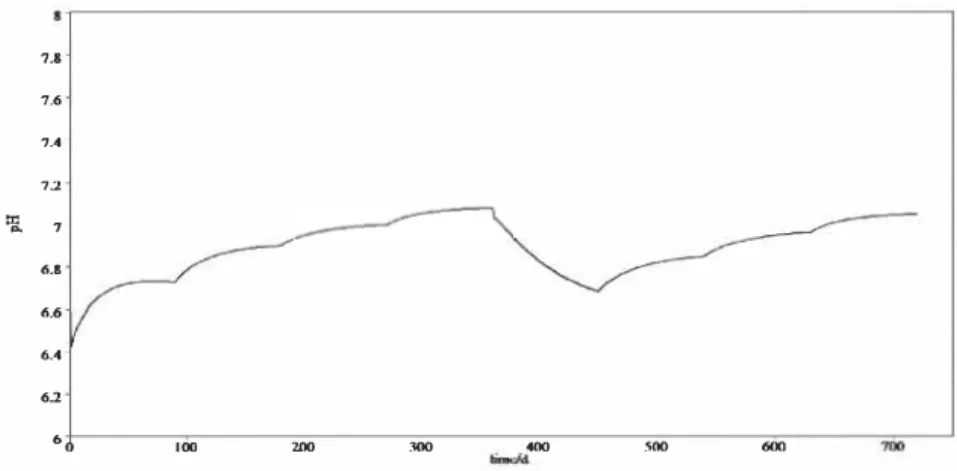
The simulated reactor pH, for the same case as presented in Figure 1, is shown in Figure 2. It can be seen that the transitions from no feed and very low feed to maximum feed are the critical phases with the lowest pH levels. The process startup phase is evidently the most critical point as the pH drops below 6.5, where methanogenesis is inhibited. This suggests that startup requires more than the 20 days allowed in the simulations to make sure process failure does not occur. The pH is quite stable at the other flow rate transitions and remains within the pH range for safe operation.
The simulated biogas energy output (Figure I) shows good correlation with the simple theoretical calculations for the amount of methane estimated by pure conversion of substrate (see "Design Criteria"). It is, however, noted that the simulated values are a bit lower, as the simulations also account for the fact that some of the energy of the inlet feed is used for cell growth and not just pure methane production. It is also noted that the nitrogen concentration of the feed was modified to minimize the amount of inhibition caused by the lack of nitrogen. An S_IN value of 0.0 I kg/m3 for the feed seemed to produce good results. The system is sensitive to inadequate S_IN and if the value is set below 0.005 kg/m3 then the system becomes unstable. The ammonia is acting as a buffer which is helping to keep the pH from dropping. A larger volume allows this value to be lower but that is at extra construction cost.
600 ,00 400 '--300 :zoo
l
l
LOOl
I
100 :,,00 .soo 600 700�
7.8 7.6 7.A 72 7...
6.6•..
6.2••
100 200 300 400 ,oo 600Figure 2. Simulated reactor pH in the two year simulation of Figure 1.
4.2 Simulation of UASB 18.S m3
The simulated UASB biogas production, presented as the corresponding energy value, is shown in Figure 3 (the energy is 8.85 kWh/m3 methane produced). The simulation shows stable production at the levels required. The slow feed load transitions described in Methods were, however, required. The process failed when abrupt feed transitions were simulated .
.... era'pa'"-1' «JO 350-
300-i
250�
l.SO -1007 50....
"•
100 21111 :mo 400 .'IOO 000 700 --laddIt was also observed that this high rate process requires more buffer capacity that the CSTR, supplied as inorganic nitrogen, S_IN, in these simulations, The UASB reactor is sensitive to the S_IN loading, requiring a minimum of 0,05 kg/m3 _ An S_IN value of 0.07 kg/m3 for the feed produces good results (Stable pH). This suggests that ammonia or some buffer needs to be added to make a high rate process stable on this feed. A considerably larger volume is required before the low ammonia is not a factor and the UASB reactor approaches the size of the CSTR reactor, defeating the purpose of a high rate process design, A UASB reactor is, however, appropriate given a high enough value of S_IN and allowing a 30-day transition period when increasing the feed flow rate,
5 CONCLUSIONS
Simulations of a 74 m3 CSTR biogas reactor over a period of two years with varying feed
flows showed that the reactor responded well to step changes in feed and was capable of producing the energy required by the factory, Process instabilities were observed at the start of the juice production season where the energy requirement was increased from 30 to 400 kWh, but this can be reduced by ramping up over a 20-day period. The ammonia concentration was noted to be a major influence and required a minimum value of 0,005 kg/m3 , otherwise the system became unstable, observed as pH drops,
The design of the UASB biogas reactor is directly depended on the loading of COD into the reactor volume each day and is therefore independent of the feed concentration (in the feed concentration range relevant for apple waste), Using industry standard design figures of
18 kg COD/m3 reactor volume per day, a minimum reactor volume of 6,2 m3 is required for
400 kWh of biogas energy production per day. A factor of safety of 3 is added on to the
volume to give a design volume of 18,5 m3, This implies that a HRT of 26 days is required for
the UASB to treat the concentrated apple waste leachate (160 kgCOD!m\ which is greater
then the I day usually associated with UASB reactor designs, Simulating the 18.5 m3 UASB
reactor over a two year period with varying feed flows worked well, The reactor responded better to step changes down in feed compared to step changes up, A minimum ramp up period of 30 days is required at the start of each season when there is a large change in the energy demand, The ammonia concentration is also noted to be more significant for the UASB
reactor pH stability than for the CSTR reactor, requiring a minimum of 0,05 kg/m3 which is
IO times larger than for the CSTR, The actual ammonia concentration of the apple waste is unknown and this could cause problems with the stability of the plant
ACKNOWLEDGEMENT
The authors wish to acknowledge the support of the Norwegian Science Foundation,
REFERENCES
[I] Song, Y,, Greer, T, Li, Y., Wu, W,, Botheju, D., Bakke, R,, 2007, Biogas Potential from Apple Waste, Telemark University College, Porsgrunn,
[2] Tchobanoglous, G., Burton, F., Stensel, D., 2003. Wastewater Engineering: Treatment
and Reuse, Metcalf and Eddy. 4th edition, McGraw Hill, Boston, p 993, p985, p I 009.
[3] Batstone, DJ., Keller, J,, Angelidaki, L, Kalyuzhnyi, S.Y,, Pavlostathis, S.G,, Rozzi,
A,, Sanders, WT.M., Siegrist, H,, Yavilin, V,A,, 2002, Anaerobic Digestion Model No, I