Annual Report 2006: Activities and Findings
This has been a year of new personnel, building new collaborations within and among other institutions, while maintaining our central focus of studying the structure and function of the SGS ecosystem and addressing broader scientific initiatives. We have also responded to site review team comments and intiated new experiments that will help form the basis for the next submission. This annual report provides a summary of our A) Research Activities, B)
Information Management, C) Education, Outreach and Training Activities, and D) Project Management.
A.
Research
Activities
During the last year, we produced 26 papers in refereed journals, six book chapters, two dissertations, and 50 abstracts from national and international meetings. Fourteen additional papers have been accepted by refereed journals, and two for book chapters. Eighteen graduate
students, 21 undergraduate students and four post-doctoral fellows worked on research
related to the shortgrass steppe LTER. We continue to sample our long-term projects, as well as initiating some new short-term experiments. Key research progress for 2005-2006 is presented below for each of our three core areas: population dynamics, biogeochemical dynamics, and land-atmosphere interactions, as well as for integrated, synthetic and cross-site work.
1. Population Dynamics
a. Plants
1) Long-term response of shortgrass steppe vegetation to removal of Bouteloua gracilis (ARS #155): The goal of a study initiated in 1997 was to assess the long-term response of shortgrass steppe vegetation to the removal of the dominant perennial grass species, Bouteloua gracilis. Since complete aboveground removal of B. gracilis from 1 m2 plots in 1997, plant density and cover by species have been monitored annually. Treatment and control plots are located inside and outside grazing exclosure sites to address grazing impact. B. gracilis averaged a 1.4% basal cover increase per year in removal plots and was significantly different from control plots across all years (Fig. 1a). Removal of B. gracilis affected vegetation dynamics. Density of annuals was initially higher in treatment plots, but over time showed no difference from control plots (Fig 1b). Perennial forb and subshrub density peaked 2-4 years after removal and then declined (Fig. 1c). Certain subdominant grass and sedge species initially increased in relative abundance in treatment plots (Figs. 1d and 1e), while cacti density was higher in treatment plots seven years after B. gracilis removal. Dominant shortgrass removal did not change species density (Fig. 1f) or diversity and there were no significant grazing interactions. Litter cover was lower and bare soil cover higher in removal plots across all years.
This long-term dataset is also being analyzed to determine how subdominant species may behave differently than relatively rare species to dominant species loss over time. Our results showed that subdominant species had the largest absolute responses to removal of the dominant species but comparatively small relative responses. Subdominants had low species turnover rates in both
the presence and absence of the dominant species. Removal increased their abundance, but this response occurred over a short time span (<3 years) and turnover remained low. The least abundant component of undisturbed shortgrass steppe plant communities had a small absolute response to removal of the dominant species, but a large relative response. These relatively rare plant species have high species turnover rates in the presence of Bouteloua gracilis and they replaced each other at even higher rates when Bouteloua was removed.
(c) Perennial forbs and subshrubs
0 5 10 15 20 25 1997 1998 1999 2000 2001 2002 2003 2004 2005 Year % Ba sa l C o v e r Treatment Control 0 5 10 15 20 25 30 1997 1998 1999 2000 2001 2002 2003 2004 2005 Year # o f in di vi dua ls /m 2 Treatment Control 0 5 10 15 20 25 30 35 40 45 1997 1998 1999 2000 2001 2002 2003 2004 2005 Year # o f indi v idua ls /m 2 Treatment C ontrol
(a) Bouteloua gracilis
**
Figure 1. Cover changes for (a) Bouteloua gracilis, (b) annual forbs, (c) perennial forbs and subshrubs, (d) all grasses other than Bouteloua gracilis, (e) sedges, and (f) species density through time in control and treatment plots. Significant differences in cover due to removal for an individual year are marked by an asterisk (*) for p<0.05 and two asterisks (**) for p<0.01. Results of 2-way repeated measures ANOVA appear below each graph, with removal (df=1) and grazing (df=1) as treatments and multiple years as repeated measures (df=8).
Removal effect F=45.14 p<0.0001; Grazing effect F=0.47 p=0.4950; Year effect F=4.29 p=0.0003 **
* *
Removal effect F=3.89 p=0.0549; Grazing effect F=5.04 p=0.0298; Year effect F=26.51 p<0.0001
(f) Species Density
Removal effect F=0.14 p=0.7052; Grazing effect F=2.04 p=0.1600; Year effect F=4.63 p=0.0002
Removal effect F=0.34 p=0.5624; Grazing effect F=4.46 p=0.0404; Year effect F=3.57 p=0.0002
(d) Other grasses (e) Sedges * 0 10 20 30 40 50 60 70 1997 1998 1999 2000 2001 2002 2003 2004 2005 Year # of i n d ivi d u a ls /m 2 Treatment Control * ** * * *
Removal effect F=14.82 p=0.0004; Grazing effect F=0.67 p=0.4167; Year effect F=13.37 p<0.0001 *
**
Removal effect F=4.43 p=0.0412; Grazing effect F=3.93 p=0.0536; Year effect F=28.17 p<0.0001
(b) Annual forbs ** ** ** * * 0 2 4 6 8 10 12 1997 1998 1999 2000 2001 2002 2003 2004 2005 Year # o f sp e c ie s/ m 2 Treatment Control 0 10 20 30 40 50 60 70 80 90 1997 1998 1999 2000 2001 2002 2003 2004 2005 Year # of i n d ivi d u a ls /m 2 Treatment Control
(c) Perennial forbs and subshrubs
0 5 10 15 20 25 1997 1998 1999 2000 2001 2002 2003 2004 2005 Year % Ba sa l C o v e r Treatment Control 0 5 10 15 20 25 30 1997 1998 1999 2000 2001 2002 2003 2004 2005 Year # o f in di vi dua ls /m 2 Treatment Control 0 5 10 15 20 25 30 35 40 45 1997 1998 1999 2000 2001 2002 2003 2004 2005 Year # o f in d ivi d u a ls /m 2 Treatment C ontrol
(a) Bouteloua gracilis
**
Figure 1. Cover changes for (a) Bouteloua gracilis, (b) annual forbs, (c) perennial forbs and subshrubs, (d) all grasses other than Bouteloua gracilis, (e) sedges, and (f) species density through time in control and treatment plots. Significant differences in cover due to removal for an individual year are marked by an asterisk (*) for p<0.05 and two asterisks (**) for p<0.01. Results of 2-way repeated measures ANOVA appear below each graph, with removal (df=1) and grazing (df=1) as treatments and multiple years as repeated measures (df=8).
Removal effect F=45.14 p<0.0001; Grazing effect F=0.47 p=0.4950; Year effect F=4.29 p=0.0003 **
* *
Removal effect F=3.89 p=0.0549; Grazing effect F=5.04 p=0.0298; Year effect F=26.51 p<0.0001
(f) Species Density
Removal effect F=0.14 p=0.7052; Grazing effect F=2.04 p=0.1600; Year effect F=4.63 p=0.0002
Removal effect F=0.34 p=0.5624; Grazing effect F=4.46 p=0.0404; Year effect F=3.57 p=0.0002
(d) Other grasses (e) Sedges * 0 10 20 30 40 50 60 70 1997 1998 1999 2000 2001 2002 2003 2004 2005 Year # of i n d ivi d u a ls /m 2 Treatment Control * ** * * *
Removal effect F=14.82 p=0.0004; Grazing effect F=0.67 p=0.4167; Year effect F=13.37 p<0.0001 *
**
Removal effect F=4.43 p=0.0412; Grazing effect F=3.93 p=0.0536; Year effect F=28.17 p<0.0001
(b) Annual forbs ** ** ** * * 0 2 4 6 8 10 12 1997 1998 1999 2000 2001 2002 2003 2004 2005 Year # o f sp e c ie s/ m 2 Treatment Control 0 10 20 30 40 50 60 70 80 90 1997 1998 1999 2000 2001 2002 2003 2004 2005 Year # of i n d ivi d u a ls /m 2 Treatment Control 0 5 10 15 20 25 1997 1998 1999 2000 2001 2002 2003 2004 2005 Year % Ba sa l C o v e r Treatment Control 0 5 10 15 20 25 30 1997 1998 1999 2000 2001 2002 2003 2004 2005 Year # o f in di vi dua ls /m 2 Treatment Control 0 5 10 15 20 25 30 35 40 45 1997 1998 1999 2000 2001 2002 2003 2004 2005 Year # o f in d ivi d u a ls /m 2 Treatment C ontrol
(a) Bouteloua gracilis
**
Figure 1. Cover changes for (a) Bouteloua gracilis, (b) annual forbs, (c) perennial forbs and subshrubs, (d) all grasses other than Bouteloua gracilis, (e) sedges, and (f) species density through time in control and treatment plots. Significant differences in cover due to removal for an individual year are marked by an asterisk (*) for p<0.05 and two asterisks (**) for p<0.01. Results of 2-way repeated measures ANOVA appear below each graph, with removal (df=1) and grazing (df=1) as treatments and multiple years as repeated measures (df=8).
Removal effect F=45.14 p<0.0001; Grazing effect F=0.47 p=0.4950; Year effect F=4.29 p=0.0003 **
* *
Removal effect F=3.89 p=0.0549; Grazing effect F=5.04 p=0.0298; Year effect F=26.51 p<0.0001
(f) Species Density
Removal effect F=0.14 p=0.7052; Grazing effect F=2.04 p=0.1600; Year effect F=4.63 p=0.0002
Removal effect F=0.34 p=0.5624; Grazing effect F=4.46 p=0.0404; Year effect F=3.57 p=0.0002
(d) Other grasses (e) Sedges * 0 10 20 30 40 50 60 70 1997 1998 1999 2000 2001 2002 2003 2004 2005 Year # of i n d ivi d u a ls /m 2 Treatment Control * ** * * *
Removal effect F=14.82 p=0.0004; Grazing effect F=0.67 p=0.4167; Year effect F=13.37 p<0.0001
0 10 20 30 40 50 60 70 1997 1998 1999 2000 2001 2002 2003 2004 2005 Year # of i n d ivi d u a ls /m 2 Treatment Control * ** * * *
Removal effect F=14.82 p=0.0004; Grazing effect F=0.67 p=0.4167; Year effect F=13.37 p<0.0001 *
**
Removal effect F=4.43 p=0.0412; Grazing effect F=3.93 p=0.0536; Year effect F=28.17 p<0.0001
(b) Annual forbs ** ** ** * * 0 2 4 6 8 10 12 1997 1998 1999 2000 2001 2002 2003 2004 2005 Year # o f sp e c ie s/ m 2 Treatment Control 0 10 20 30 40 50 60 70 80 90 1997 1998 1999 2000 2001 2002 2003 2004 2005 Year # of i n d ivi d u a ls /m 2 Treatment Control
2) Grazing strategies to create and maintain suitable Mountain Plover habitat in shortgrass steppe: Mountain Plover habitat has dramatically decreased over the past 20 years in the
shortgrass steppe. Beginning in 2004, we intitated a large-scale experimental study of the utility of using grazing to create critical breeding habitat for Mountain Plovers, a grassland bird of conservation concern in western North America. The study is broad in scope and has allowed us to conduct several multidisciplinary studies on these and adjacent experimental plots.
Mountain Plovers prefer habitat with very short-statured grasses on upland topographical
positions with high amounts (30%) of bare ground. A collaborative experiment between USDA-Agricultural Research Service and Shortgrass Steppe Long-term Ecological Research scientists was initiated in 2004 to evaluate very heavy spring and summer grazing intensities as potential land management strategies to create and maintain desired nesting habitat conditions for
Mountain Plover. Very heavy spring grazing, occurring from early March to mid-May, utilizes strategically located supplemental feed (i.e., protein/energy tubs) in targeted upland areas to modify animal behavior to achieve localized areas of heavy disturbance to create desired habitat conditions of Mountain
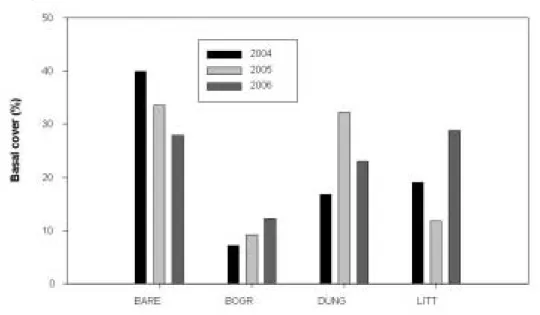
Plover by the target date of April 1. For the first three years of this treatment, desired habitat conditions have been met as bare ground has exceeded 30%, litter cover has been reduced to around 10%, and cover of fecal material substantially increased to approximately 30% (Fig. 2). Desired habitat conditions, however, were not achieved in upland areas without strategic
placement of supplemental feed, indicating that very heavy grazing alone is not a viable management practice; rather a combination of management practices is needed to effectively address conservation needs of this grassland bird species with livestock grazing in the shortgrass steppe. Yearling steer weight gains have ranged from 0.36 to 0.45 kg/hd/day over the 10-week early spring grazing period across the three treatment years (Fig. 3). Approximately 4,600 kg of supplemental feed was provided each year during this early spring grazing period, at a cost of approximately $14/yearling steer. Weight gains with this treatment are approximately double those observed with light-to-moderate stocking of saltbush-dominated pastures during the same grazing period. Steer grazing summer pastures at very heavy stocking rates gained 15% less weight over the grazing season compared to steer grazing at the moderate stocking rate. Another aspect of the project has been to investigate the responses of arthropod prey and small mammal nest predators in three grazing treatments (as well as long-term exclosures and prairie dog colonies), which, collectively, represent a continuum of native and domestic grazing in shortgrass steppe. We also compared the numbers of passerine nests found in each treatment type, as a surrogate to represent the potential response of nesting plovers. To date we have found few differences in responses of most animal groups to grazing treatments, which underscores the resistance of shortgrass steppe to grazing as well as the relatively low aboveground productivity in shortgrass steppe.
We have used an NSF Supplement to hire a postdoctoral scientist, Scott Newbold, for 3 months to coordinate data collection and to synthesize our results thus far. Scott will present these results at the upcoming LTER All-Scientists Meeting in Estes Park. This project served as the MS project for one graduate student at CSU Fullerton.
Work on this project will ultimately result in the development of grazing management strategies that are desirable for enhancing habitat for grassland bird species that are currently experiencing population declines, while also providing needed ecological information regarding how this rangeland ecosystem responds to grazing intensities previously not experimentally evaluated. This information will be used by land managers to increase their management options to achieve desired vegetation structure and composition for a suite of needs.
Figure 2. Basal Cover (%) from upland areas with supplemental feed sites in spring-grazed Plover pastures (2004-2006).
Figure 3. Weight gain of yearling steer grazing spring Plover pastures early March to mid May (2004-2006).
3) Plant community and ecosystem change on Conservation Reserve Program lands in Northeastern Colorado: Areas of the shortgrass steppe that have undergone cultivation are typically slow to recover (>50 years). Cultivation removes both above- and belowground plant components, low water availability limits plant growth in this semiarid region, and recovery is further impeded by constraints on the reproductive success of the dominant perennial grass, Bouteloua gracilis. The Conservation Reserve Program (CRP) has restored cultivated fields to perennial grassland vegetation on over 2.3 million acres in Colorado, primarily in regions of semiarid shortgrass steppe. Challenges to overcome slow recovery potential of shortgrass
vegetation have resulted in many CRP seed mixtures that contain introduced species not native to northeastern Colorado. The objective for our research was to assess the state and rate of
recovery of both plant community and ecosystem variables on CRP lands.
Our initial findings show that species composition on CRP fields shifted from a species rich annual forb community to a perennial grass community with lower richness if the field was planted with non-native species. Eighteen year-old CRP fields planted with native species more closely resembled uncultivated shortgrass steppe in functional composition, plant density, and basal cover than those planted with non-native species. Above (ANPP) and belowground net primary production (BNPP), basal cover, and litter increased in CRP fields over time, while plant density decreased. Our findings demonstrate that ANPP on 18 year-old CRP fields is nearly double uncultivated shortgrass steppe, despite half the species diversity. However, a tradeoff of high ANPP for non-native plants in a low resource environment was lower plant density and lower belowground biomass allocation than native plants. BNPP on uncultivated shortgrass steppe was nearly double all CRP fields.
Plant tissue and litter quality (C:N ratios) will be used, in combination with production estimates, to determine how plants in CRP fields differ in their contribution to soil nutrients. An REU student is currently determining the nutrient resorption efficiency of plant species in uncultivated shortgrass steppe and CRP fields in an effort to better understand the amount of nutrients lost by plants and to characterize litter input into soils. Ion exchange resin bags show an increase in mineralizable N rates on CRP fields with increasing age, which is expected to be correlated with an increase in active soil organic matter after agricultural abandonment. Soil organic carbon fractionations will be done on soils collected from the chronosequence of CRP fields to better qualify the accumulation of labile and stabile C pools. A model will be developed, in
collaboration with scientists from the Natural Resource Ecology Laboratory, to understand how stabile and labile soil carbon pools accumulate as a function of production, cover by species, and time since agricultural abandonment.
Overall, this research provides a broad perspective of the variability in species composition and ecosystem properties across different landuse types in the shortgrass steppe. Further results from this research will contribute to an understanding of the ecological changes that occur with shifts in landuse and recovery from large-scale disturbance. This project includes cooperation with the USDA Natural Resources Conservation Service and US Forest Service and incorporates an existing mentorship program at Colorado State University to bring undergraduate students into the field to collect scientific measurements.
4) Long term Studies of Root Production: Over the years, researchers at the SGS LTER have done a considerable amount of work on roots and belowground net primary production (BNPP). In conjunction with a recent CO2 experiment (see Land-Atmosphere section), we developed new
root ingrowth methodology to minimize destructive sampling (Milchunas et al. 2005b), and tested assumptions and methods of calculating minirhizotron data (Milchunas et al. 2005a). Combining previous and recent work gives us the unique ability, as far as we know, to compare all current methods of estimating BNPP. Ten primary methods and several sub-methods or means of calculating within primary methods were evaluated (Table 1). Traditional coring methods result in estimates of zero for a proportion of the years and very high values in other years. 14C turnover, root ingrowth, and minirhizotron methods remain reasonable methods for estimating BNPP. 14C turnover has the least number and severity of potential biases (Milchunas and Lauenroth 2001), but takes a number of years to obtain estimates. 13C could be used in place of 14C, but destructive sampling and root separation from soil is still necessary. We use this method, however, as our best estimate, knowing that any “true absolute value” is not actually known. Absolute values for root ingrowth methods were highly dependent on surface
area/volume used, and estimates therefore varied from low to high. Architectural bias,
competition-free ingrowth medium, and artificial soil structure through the profile are a few of the other potential biases for this method. Root ingrowth did however provide relative treatment estimates that agreed well with minirhizotron estimates of BNPP. Estimates from minirhizotron were highly dependent on the method of calculation. Estimates based on the maximum length a root attains compared very well with estimates by 14C turnover, although 14C soil corrected values were higher. This may suggest that underestimates due to the architectural bias of minirhizotrons may be more important than potential overestimates due to growth across the artificial surface and loss of root contact due to tube or soil movement.
Table 1. Comparison of Methods to Estimate BNPP.
Method Mean Min Max Years of
Data
Study Coring sum of increments
HSD statistics 220 0 1238 13
Milchunas & Lauenroth 2001 STD statistics 263 0 1431 13 Milchunas &
Lauenroth 2001 no statistics 449 100 1699 13 Milchunas &
Lauenroth 2001 t-test 521 459 581 2 Sims & Singh 1978
14C turnover
not soil 14C adjusted 181 154 207 13
Milchunas & Lauenroth 2001 soil 14C adjusted 232 197 265 13 Milchunas &
14C dilution 321 -349 627 4 Milchunas & Lauenroth 1992 Root ingrowth by concentric coring 472 460 485 2 McCulley et al. 2005
by donut 93 52 113 4 Milchunas et al. 2005 a
Minirhizotron: by max length 191 87 320 5 Milchunas et al. 2005 b
by avg length 414 254 720 5 Milchunas et al. 2005 b
by regression 160 96 288 5 Milchunas et al. 2005 b
Excavation window 527 351 703 1 Ares 1976 Early simulation model of carbon
flow
178 146 210 2 Parton et al. 1978 Regression models - (global
environmental variables)
210 188 307 3 diff. models
Gill et al. 2002 Nitrogen budget 83-296* upland calc from data in
King et al. 2004, Schimel et al. 1985, NADP
Carbon flux 1107 1 calc from data in
Pendall et al. 2003, Morgan et al. 2004 * N budget – the 83 BNPP estimate is from Schimel to 20cm roots by flotation thru 1mm sieve, the 296 BNPP estimate is for King et al. roots by hand picking. N-mineralization from Schimel et al. (1985) and NADP is total N for 2004 from NADP web site. Ares (1976) based on 30-60% loss/yr.
5) Small Plot Burning Experiments: Although fire is an important driver in grassland systems, comparatively little is known about the response of the shortgrass steppe. Based on comments we received from the NSF-LTER site review team we intiated a new experiment that will be compatiable with experiments being conducted at the Konza Prairie. This study seeks to address the need for long-term, replicated experiments investigating the responses of the shortgrass steppe to different seasons and frequencies of fire. Small plots will be burned annually or triennially, either just before the onset of the growing season (late April/ early May) or after the first frost (later September). Unburned plots will serve as controls. The first spring burns were conducted in early May 2006. Aboveground net primary productivity (ANPP), species richness, canopy and basal cover by species, and Oppuntia condition will be measured.
b. Fauna
1) Long-term mammal studies: Since 1994, we conducted monitoring studies of mammals on the SGS-LTER site, including studies of small mammals and carnivores. These long-term studies include tracking population densities of small rodents and ground squirrels in representative shortgrass vegetation types twice per year; monthly sampling of arthropod prey in pitfall traps during the May-September growing season; annual sampling of vegetation on live-trapping areas to record changes in plant communities; roadside spotlight counts of rabbits four times per year to estimate population densities; and roadside collections of carnivore scats to estimate relative abundance of coyotes and swift foxes. Data collection and analysis continues for these projects, which have been used to provide baseline data for other LTER and external projects.
We have organized a Workshop for the 2005 LTER All-Scientists Meeting in Estes Park in an attempt to synthesize results of similar mammal monitoring efforts across arid and semi-arid grasslands, including other LTER sites in the region. We submitted a proposal in August 2005 to fund a Working Group on this theme at NCEAS but it was not funded. However, LTER results will be included in a special symposium that SGS scientists will be leading at the Annual Meeting of American Society of Mammalogists in Albuquerque in June, 2007.
2) Ecology of shortgrass steppe in relation to prairie dogs and plague (including separate funding from NSF-EID project): Prairie dogs have been recognized as a keystone species on the Great Plains because their engineering of the environment by burrowing creates habitat for associated species (many invertebrates, burrowing owls, mountain plover), because their grazing of dominant grasses and Opuntia cactus influences plant community turnover, and because they serve as prey for both resident carnivores (coyotes, badgers, swift fox) and migratory birds (Ferruginous hawk). The work on prairie dog ecology has been augmented by an additional grant from NSF as a collaboration between Mike Antolin and Colleen Webb at Colorado State, Paul Stapp from California State U. Fullerton, and Ken Gage at Centers for Disease Control. The “plague project” more specifically examines the plague prevalence in prairie dogs, small mammals, and their fleas. Field work began in 2004, with sampling conducted from April-September each year. Funding from NSF (both SGS-LTER and EID) has supported three postdoctoral scientists, three Ph. D. students, six MS students, and four REU students, all of whom have used the field station and SGS-LTER infrastructure.
Some key results and projects:
• Based on 25 years of long-term monitoring of colony size and activity on the Pawnee National Grassland by the Forest Service , we have found that plague outbreaks in prairie dog colonies tend to follow wetter, ENSO-related winters, and cooler summers.
• The invasion of plague alters metapopulation structure of prairie dogs by making large colonies vulnerable to extinction and by increasing the temporal synchrony of extinction events.
• Northern grasshopper mice, the most common nocturnal rodents, are involved in plague outbreaks on colonies. They are exposed to and survive infection by the plague
bacterium, are a target of prairie-dog fleas abandoning dying prairie dogs and appear capable of infecting their own fleas, which would be necessary for them to be able to maintain the bacterium in an area in the absence of prairie dogs. Our SGS-LTER
monitoring data on grasshopper mouse abundance were instrumental in showing that plague outbreaks in prairie dogs tend to follow years when grasshopper mouse densities are high, suggesting that grasshopper mice might be involved in triggering outbreaks. • Swift foxes appear to be exposed to plague during outbreaks on prairie dog colonies and
may be a mechanism by which the disease is spread among colonies.
• The extinction of prairie dog colonies because of plague outbreaks and subsequent recolonization has profound effects on plant diversity by favoring forbs over. In turn, increased diversity of flowering plants on healthy prairie dog colonies increases the diversity of pollinating.
• The SGS-LTER is working to develop a method for accurately estimating densities of prairie dog colonies on the CPER and the western Pawnee National Grassland in collaboration with faculty and graduate students for the Department of Fisheries and Wildlife Biology at Colorado State University. The first publication from this work is in review: Seth B. Magle, Brett T. McClintock, Dan Tripp, Gary C. White, Michael F. Antolin, Kevin R. Crooks. A New Method for Estimating Population Densities for Prairie Dogs. Journal of Wildlife Management, in review.
With additional financial support from the Colorado Division of Wildlife, an additional Ph.D. student is estimating population densities and nest success of burrowing owls, again in relation to size and activity of prairie dog colonies (healthy, plagued and extinct).
2. Biogeochemistry
We have initiated several new studies in the area of biogeochemical dynamics and weathering, as well as receiving some very intriguing new results on a long-term study on nitrogen retention and availability. We summarize two new studies (methane consumption and precipitation variability), and present the key results from our long term N retention and soil weathering studies.
a. Trace Gases
1) Methane consumption: Despite relatively low atmospheric concentrations (1.8 ppm), methane is a potent greenhouse gas that contributes up to 20% of global warming (Bouwman, 1990; Reay et al., 2001). Major sinks for methane are photochemical oxidation in the atmosphere (~450 Tg y-1) and biological oxidation in soil. Estimated rates for the latter are poorly constrained, ranging from 20-60 Tg y-1 for the consumption of atmospheric methane in upland soils (Holmes et al., 1999). Although small relative to photochemical processes, the consumption of atmospheric methane in upland soils is significant because its magnitude is approximately that of the annual increase in atmospheric methane concentrations (about 1% y-1) that have occurred over the past half century.
Grasslands in North America are ideal model systems for identifying key physical and biological factors that control methane biogeochemistry. Grasslands in general occupy a large fraction of the earth’s land area, and because they are dry or seasonally dry, the soil diffusivities are typically high, allowing for high rates of methane consumption (Potter et al. 1996). The
American Great Plains. Although previous studies have generated information regarding
methane fluxes in SGS soils (Mosier et al., 1991, 1996, 1997a, 1997b), mechanistic assessments (e.g., Del Grosso et al. 2000) for how physical vs. biological controls interact to yield the
observed temporal and spatial variability have been limited because these controls have been inferred, not measured.
Preliminary results from the SGS LTER generated by our group reveal the joint and interactive importance of physical and microbial community properties for structuring landscape-scale variation in methane consumption rates. We measured methane consumption, soil diffusivity and methanotroph uptake capacity (Fig. 4/1.1 and 4/1.2) during summer 2005 on sites that differ in vegetation and topographic position. Our results illustrate the well-known, direct effects of soil diffusivity on methane consumption rates: consumption rates decline across sites with decreasing soil diffusivity (King 1992). However, Fig. 4/1.3 reveals a surprising indirect effect of soil diffusivity: sites with lower diffusivity also have lower methane uptake capacity. Functionally, this uptake capacity term enfolds the effects of microbial community size as well as per capita properties; lower values of uptake capacity reflect a weaker methanotroph community with some combination of a smaller population size, enzymes with lower affinity (i.e. higher Km) and/or lower Vmax. We hypothesize that resource supply (i.e. methane supply) alters both the size and specific activity of soil methanotroph populations. The implication is that soil physical properties both directly influence methane consumption rates by limiting the rate of gas movement into the soil, and indirectly influence consumption by altering the ecology of soil methanotrophs. Von Fischer et al have recently submitted an NSF proposal to further evaluate these hypotheses.
Figure 4 (Fig. 1.1-1.3): Preliminary data indicate that sites with high rates of methane consumption generally have high soil diffusivity and .stronger. methanotroph communities. Site designations are 23e-R =Ridge, moderate grazing; 7sw = Flat, heavy spring grazing; GS-R = Ridge, ungrazed; GS-S = Swale, ungrazed; 23e-S = Swale, moderate grazing. Soil properties were sampled in June, August & September 2005. Consumption rates are from standard flux chamber measures. Diffusivity values are from additions of an inert tracer gas (SF6) to the headspace of the flux chambers and analysis of concentration changes in light of Rolston et al. (1991). Uptake constants are from lab incubations of sieved soils. Values in all plots are averages of 6 chambers per time averaged over the three samplings (Figs 4.1/1.1 & 4.2/1.2, n=18) or from individual incubations (Fig. 4.3/1.3, n=16.) Error bars are standard errors; letters group similar means (p<0.05).
b. Climatic and Biogeochemical Controls
1) Precipitation variability and ecosystem responses: Water availability is a primary factor limiting aboveground net primary productivity (ANPP) in grasslands, and many aspects of ecosystem structure and function are known to be sensitive to alterations in both the temporal distribution of rainfall events as well as the seasonal quantity. Projected changes in climate include warming of the atmosphere and increasingly variable precipitation regimes, both of which may affect soil, plant, and ecosystem properties. Given that models predict somewhat disparate scenarios of future climatic regimes, experimental studies should emphasize
fundamental precipitation-productivity relationships and their mechanistic underpinnings, rather than be tied to a particular model.
Precipitation variability arises through 1) changes in the frequency of rainfall events and 2) differences in the quantity of rainfall per event. We have initiated a new cross-site study (conducted by Ph.D. Student) in which, through the use of rainout shelters, we will
experimentally manipulate these two aspects of precipitation variability across the Great Plains of the United States in sites that span a broad precipitation, soil nutrient, and species composition (short to mixed to tallgrass) gradient. The main objective of this study is to identify common and unique responses of these grassland types to precipitation variability. For this reason, we plan to apply a uniform experimental treatment protocol in three distinct ecosystems – the shortgrass steppe, the mixed grass prairie, and the tallgrass prairie – as an initial step in evaluating not only ecosystem change that might be produced as a consequence to climate change, but also to further understand characteristic responses of vegetation to alterations in precipitation regimes. The 2005 growing season served as a pilot year for this multi-site study, which includes the Shortgrass Steppe LTER (Nunn, CO), Fort Hays Agricultural Experiment Station, and the Konza Prairie LTER (Manhattan, KS).
2) N reduction and invasive species: In the mid 1970’s, as part of the International Biological Program, we initiated a fertilization and irrigation study. Short-term results from the study indicated that increased nitrogen, increased water, and the combination caused exotic plant species to succeed and outcompete the native shortgrasses (Lauenroth et al. 1978). Although the water and nitrogen treatments were halted after only a few years, their effects persisted, and our long-term monitoring studies show that exotic species still dominate in the addition treatments (Milchunas and Lauenroth 1995). Our hypothesis has been that annual plant species maintain high levels of N in their tissues, generating high N turnover (Vinton and Burke 1995), which maintains the competitive advantage for these species over our slow-growing N-conservative shortgrasses.
In 1997, we initiated a new study in an effort to reduce N availability and thus increase the competitive advantage for native species in these long-term historical plots. We assessed the influence of 5 carbon(C) treatments on the labile C and nitrogen (N) pools of these historically N enriched plots. We applied sawdust, sugar, lignin, sawdust + sugar, and industrial lignin +sugar to plots that had received N and water additions in the early 1970's. We hypothesized that C amendments would stimulate microbial activity and humification and suppress rates of N
mineralization, and that complex forms of carbon (sawdust and lignin) could lead to longer-term reductions in N availability. We found that the historic water and N treatments continue to
enhance C and N mineralization in laboratory incubated soils. Of the five current carbon treatments, sugar, sawdust and sawdust plus sugar stimulated potential C mineralization and suppressed N availability as indexed by potential and in situ mineralization rates, and by cation-anion resin probes. Sawdust + sugar was the most effective treatment at reducing N availability. We ceased carbon treatments after eight years, and measured responses in N availability. During the one year following treatment cessation, the sawdust+sugar treatment maintained N
availability that was half the level of control treatments (Fig. 5). Our results suggest that highly labile forms of carbon generate strong short-term N sinks, whose benefits disappear just one year following treatment. More recalcitrant forms maintain a strong impact on reduced N availability one year after treatment, likely due to soil organic matter and N stabilization through either biological or non-biological processes. Continued monitoring of N availability will lead to important insights about management techniques that could lead to persistent reductions in N availability. Exotic species density has tracked the changes in N availability, with only the sawdust treatments maintaining dominance of native species (Fig. 6).
Figure 5. Total N Mineralization versus Treatment for 2003 through 2005.
N availability indexed by resin probes
0 50 100 150 200 250
Control Sugar Lignin Sawdust Lig+Sug Saw+Sug
Humus Treatment T o ta l M in N (C ont ro l = 1 0 0 ) 2003 2004 2005
Figure 6. Photograph of experimental plots summer 2006.
3) Studies of Biogeochemical Inputs of Soil Weathering in Grass Dominated Ecosystems: The objectives of this study were to : 1) assess the systematic variations of weathering processes utilizing Ge/Si ratios within and among soil of natural grassland environments. Specifically we examined Ge fractionation relative to Si in weathering systems along a grassland climosequence; and utilized differences in Ge/Si values among the major biogeochemical pools (vegetation, soils, water) within watersheds along the climosequence to examine the potential link between plant mediated silica and stream water silica.
Total elemental and mineralogical data revealed sand and silt fractions dominated by quartz and feldspar. The corresponding Ge/Si of the sand and silt fractions reflect this composition for the weathering endpoints along the climosequence, SGS and Konza (Table 2). Ge/Si values range from 1.0-1.5 for the sand and silt fractions, representing a mixture of quartz (Ge/Si = 0.54, 0.69, 0.76); feldspar (Ge/Si = 2.34, 3.08, 3.79); and lesser amounts of such mafic minerals as biotite and hornblende (Ge/Si = 5.56, 6.18, 6.51). The lower Ge/Si values of the sand and silt fractions of the more highly weathered Konza site are possibly a reflection of the greater proportion of quartz (over feldspar and mafics) at this site compared to the less intensely weathered shortgrass site. The relatively higher amount of quartz at Konza is corroborated by the total elemental data, which shows a higher proportion of SiO2 in the sand and silt fractions.
Field morphology, specifically the presence of argillic horizons, supports the presence of secondary clay accumulation throughout the soils of the climosequence. Germanium
conservation in secondary clay formation can be seen in the higher Ge/Si of the clay fraction of these soils (Table 2). A possible geochemical indicator of the greater weathering intensity associated with the tallgrass sites is seen in the greater magnitude between the sand and silt vs. the clay Ge/Si values of Konza compared to the SGS sites. With increasing weathering intensity, Si loss and Ge conservation should cause the Ge/Si ratio of the clays to increase relative to parent material values. This trend is apparent when comparing SGS to Konza, the latter having a greater apparent abundance of 1:1 type clays (i.e. kaolinite) based on XRD patterns. Such 1:1 clays would typically have a greater loss of Si and conservation of Ge compared to 2:1 clays. Still, the relative similarity of clay Ge/Si values between surface and argillic horizons across the climosequence indicates limited weathering in these systems compared to regions of greater weathering intensity, such as the tropical ecosystems studied by Kurtz et al. (2002).
Geochemical weathering trends of Ge/Si in primary and secondary minerals of grassland ecosystems across the Great Plains follow established trends of Ge conservation in secondary minerals, although to a lesser extent than more weathered silicate systems of tropical rainforests (Kurtz et al 2002). Plants appear to fractionate against Ge at some point during Si uptake and phytolith formation. The trend of decreasing Ge/Si values and increasing Si concentrations with decreasing MAP in streams along the climosequence suggest a possible link between biogenic and stream Si. However, the lesser degree of weathering, more complex mineralogy, and similarity among the major Si pools across the climosequence confound the use of Ge/Si values as a biogeochemical tracer within watersheds of grassland systems. More intensive study of the stoichiometry of major weathering reactions (through more detailed mineralogical examination along with stream and solute ion chemistry) and other means of identifying Si input to streams in grasslands systems, are necessary to examine the importance of plant cycled Si in these systems. However, the Ge/Si fractionation model first put forth by Froelich et al. (1992), which only accounts for weathering based fractionation, would benefit from inclusion of a biologic fractionation component.
Table 2 - Selected soil geochemical data from the climosequence endpoints (SGS and Konza).
Site SiO2 (wt %) Al203 (wt %) Ge (mg/g) Ge/Si (µmol/mol) Ge/Al molar ratio Al/Si molar ratio SGS-A (horizon 1) bulk soil 60.9 12.0 1.38 1.9 8.1 0.21 Sand 76.7 9.8 1.27 1.4 9.1 0.15 Quartz 98.5 1.0 0.64 0.54 54.8 0.01 heavy fraction 42 22 2.82 5.56 9.0 0.62 Silt 74.9 10.5 1.28 1.4 8.6 0.16 Clay 39.1 11.7 1.38 2.9 8.3 0.35 SGS-A (horizon 3) bulk soil 59.8 14.3 1.69 2.1 8.3 0.27 Sand 74.8 10.7 1.33 1.5 8.7 0.17 Silt 70.3 12.8 1.43 1.7 7.9 0.21 Clay 44.0 12.2 1.69 3.2 9.7 0.33 SGS-B (horizon 1) bulk soil 71.3 10.4 1.36 1.6 9.2 0.17 Sand 77.4 9.7 1.27 1.4 9.2 0.15 quartz 98.5 1.0 0.91 0.76 64.0 0.01
feldspar-1 53 27 1.50 2.34 3.9 0.60 feldspar-2 53 27 1.97 3.08 5.1 0.60 heavy fraction 42 22 3.30 6.51 10.6 0.62 Silt 74.2 10.2 1.33 1.5 9.2 0.16 Clay 25.8 8.5 0.88 2.8 7.2 0.39 SGS-B (horizon 3) bulk soil 69.2 11.1 1.34 1.6 8.5 0.19 Sand 77.8 10.1 1.28 1.4 8.9 0.15 Silt 76.2 10.4 1.32 1.4 8.9 0.16 Clay 30.5 11.0 1.07 2.9 6.8 0.43 SGS-B (horizon 6) sand - quartz 98.5 1.0 0.83 0.69 58.0 0.01 sand - feldspar 53 27 2.42 3.79 6.3 0.60
sand - heavy fraction 42 22 3.14 6.18 10.0 0.62
Konza (horizon 1) bulk soil 65.2 11.4 1.30 1.7 8.0 0.19 Sand 83.8 5.6 1.05 1.0 13.1 0.08 Silt 83.4 6.9 1.19 1.2 12.2 0.10 Clay 37.3 14.3 1.68 3.7 8.3 0.45 Konza (horizon 3) bulk soil 61.6 14.0 1.55 2.1 7.8 0.25 Sand 81.3 7.6 1.10 1.1 10.2 0.11 Silt 82.0 6.9 1.18 1.2 12.0 0.10 Clay 36.2 15.2 1.73 4.0 8.0 0.49 Konza (horizon 6) bulk soil 62.0 13.0 1.4 1.9 7.6 0.25 Clay 37.0 15.0 1.7 3.8 8.0 0.48 Bignell loess 71.8 10.1 1.26 1.45 8.7 0.17
3. Land-Atmosphere Interactions
a. Energy Fluxes and Gas Exchange in Grassland Ecosystems
1) Land-atmosphere interactions at the Shortgrass Steppe LTER: Our objectives are first, to evaluate the effect of cropping on a native shortgrass steppe ecosystem, and second, to assess the influence of landscape heterogeneity on simulated energy fluxes. A coupled
atmospheric-biospheric model GEMRAMS, composed of an atmospheric model, RAMS, and an
ecophysiological process-based model, GEMTM was applied for a domain centered at the SGS LTER site. GEMLEAF, the soil-vegetation-atmosphere transfer scheme of GEMRAMS, was used to simulate sensible and latent heat fluxes over different cropping systems (winter wheat-fallow and irrigated corn) and a mixed C3/C4 shortgrass prairie located at the USDA-ARS Central Plains Experimental Range near Nunn, Colorado, the Shortgrass Steppe (SGS) Long Term Ecological Research site.
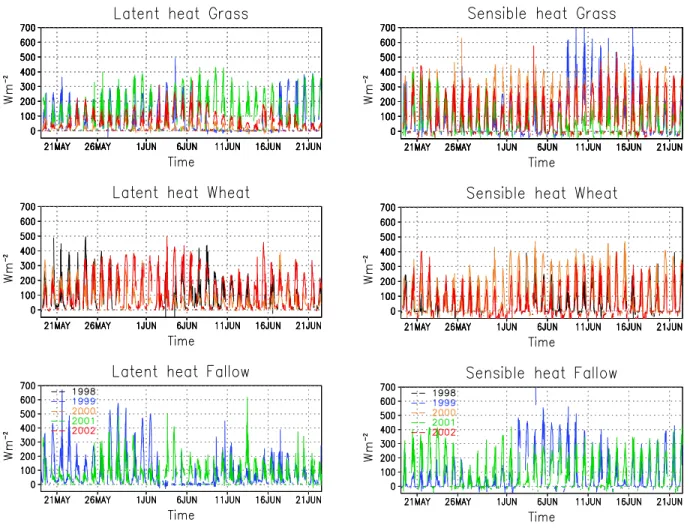
We compared simulated energy fluxes to observations collected using Bowen ratio flux towers during two growing seasons. Figure 7 shows observe sensible and latent heat fluxes for
approximately 1 month period, for all the years available, 1998 to 2002.
Figure 7. Observed latent (left) and sensible (right) heat fluxes for grass, wheat and fallow.
For shortgrass, sensible heat seems to be larger than latent heat, while for wheat both fluxes tended to have similar values. Unfortunately, large periods of missing/wrong data for corn do not allow a comparison of all the systems, except for few days. As an example, for 1999, Figure 8 shows net radiation (RN), latent heat (LH) and sensible heat (SH). Corn tends to have a higher RN than grass and fallow, associated with a lower albedo. Also due to irrigation, LH is higher than SH in the case of corn. In fallow, SH tends to be higher than LH, probably due to higher percentage of bare soil in this system, compared to grass.
Figure 8. Net radiation (RN), latent heat (LH) and sensible heat (SH) for grass, fallow and irrigated corn.
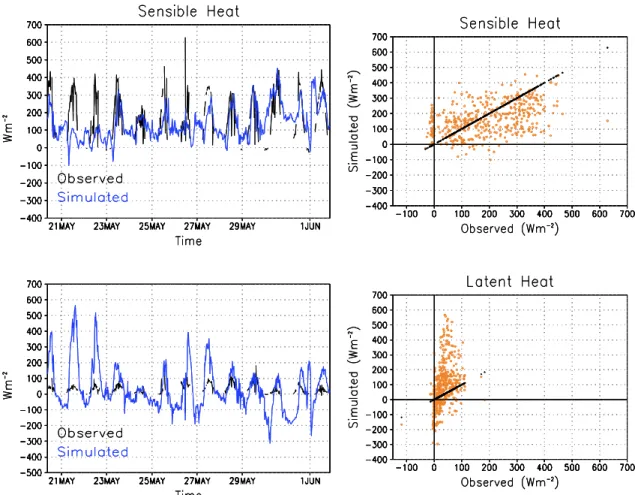
Preliminary results of the simulated fluxes with GEMLEAF show a tendency to overestimate LH, especially over night. In some cases, large values of dew were simulated. During the day, especially for shortgrass, soil evaporation was the main flux that contributes to LH, due to the low vegetation cover and LAI. Simulated sensible heat fluxes tended to be in closer agreement with observation than latent heat fluxes. An example for shortgrass is shown in Figure 9.
GRASS
FALLOW
CORN
GRASS
FALLOW
Figure 9. Observed and simulated SH and LH fro shortgrass. Black line in figures on the left correspond to 1:1 line.
In the second part of this study, we simulated energy fluxes for two clear days in early-summer and fall with GEMRAMS over a model domain centered at the SGS site. Preliminary simulations were carried out for a 50x50 km domain centered at the SGS site, with 1x1km gridspacing. Vegetation type corresponded to the NLCD 30mx30m dataset (Fig.10) and FAO soil texture data set was used. Two vegetation patches were used. The model was set up with 60 vertical levels (top 23 km), and 8 soil levels (bottom 3 m) . Homogeneous atmospheric boundary conditions were given by averaging NCEP/NCAR Reanalysis. The model was run for 30 hours, for clear days in June and October 2000.
Figure 10. Vegetation types for a 50x50km grid centered at SGS, from a 30x30 m grid space National Land Cover Data (NLCD).
Diurnal averaged simulated fluxes for June day is are shown in Figure 11. Landscape
heterogeneity determines the spatial distribution of the fluxes. Moreover, changes in landscape heterogeneity in the shortgrass steppe due to cropping incursions increased the spatial
heterogeneity of the simulated energy fluxes compared to the native prairie.High LH values were found over corn and low values over grass. Available energy (SH+LH) tends to be higher over the corn areas on the south of the domain, due to the lower albedo.
Figure 11. Average daytime SH and LH fluxes for a domain with a mixed C3/C4grassland.
The relation between area-averaged of the simulated fluxes (Figure 12) is similar to the one find in the observed fluxes. In particular, LH values for corn are clearly higher than for grass and wheat.
Figure 12. Area-averaged simulated fluxes for wheat (yellow line), corn (green line) and shortgrass (black line)
The next step is extended the domain to the south to increase the area with corn. In addition, the soil database will be updated with the “Soil Survey Spatial and Tabular Data (SSURGO 2.2)" from the U.S.D.A., Natural Resources Conservation Service. We will evaluate the sensitivity to initial soil moisture conditions, spatial heterogeneity of vegetation distribution (for example variations in C3/C4 proportions).
2) Changes in plant communities due to CO2 enhancement: One of the central questions
emerging from ecosystem-level global change experiments today is how shifts in plant species composition due to rising CO2 or altered climate might affect the desired goods and services a
particular ecosystem offers. From 1997 through 2001, an Open Top Chamber (OTC) CO2
enrichment experiment involving a doubling of CO2 concentration over present levels was
conducted on native shortgrass steppe vegetation in north-eastern Colorado. Aboveground biomass production increased an average 41% over the 5-year experiment, due mostly to improved plant water use efficiency (Morgan et al., 2004). An initial analysis of the dominant species revealed that the majority of the CO2-induced production response was attributed to one
native, C3 perennial grass, Stipa comata. Production of the other two site dominant perennial
grasses, Bouteloua gracilis (C4) and Pascopyrum smithii (C3) were unaffected by growth CO2
concentration. However, we never evaluated individual species production responses of the other thirty-one site species comprising the community, nor did we evaluate how CO2 affects
plant community structure. The current debate concerning the importance of individual species, plant functional groups and biodiversity, and their respective effects on functionality underscores a critical need to understand the consequences of global change at multiple organizational levels.
W m -2 W m -2 W m -2 W m -2
We began our analysis by investigating how growth at elevated CO2 affected
diversity. Plant species richness was significantly (P= 0.0001), but only
modestly affected by treatment, numbering 9.5 in the Unchambered plots (Control plots with no OTCs), 11.5 in Ambient CO2
plots (OTC plots exposed to ambient [CO2], approximately 360 µl l-1), and 12.6
in Elevated CO2 plots (OTC plots exposed
to [CO2] elevated to about twice present
ambient, or approximately720 µl l-1; Figure 13a). The CO2 effect on richness
was of the same order of magnitude observed in variations from year to year (Figure 1b, P=0.0002). Plant species evenness was less in the Elevated CO2
plots compared to the Ambient CO2 plots,
although not different from the
Unchambered plots (Figure 13c). Like richness, evenness changes from CO2
treatment were of the same order of magnitude occurring from year-to-year variability in the trait (Figure 13d). Due to compensating treatment effects on richness and evenness, plant species diversity was no different between Ambient and Elevated CO2 treatments, although diversity was less in the
Unchambered plots compared to the Ambient treatment (Figure 13e).
Next, we used the Whittaker (1952) index of community association as a community-wide Dissimilarity metric for comparing differences in plant species composition between the Elevated and Ambient CO2 plots. A very clear and significant (P<0.01) trend was observed in
the index, indicating increasing Dissimilarity in the association of species between the Ambient and Elevated CO2 plant communities over time, with the index increasing from 0.17 in the year
prior to CO2 fumigation, to 0.33 by 2001 (Figure 14).
Individual plant species responses to CO2
were evaluated to understand these
changes in plant community composition. Examination of all 34 site species over the five years of the experiment (1997-2001) indicated that the three perennial grass species, B. gracilis (C4 photosynthetic pathway), P. smithii (C3 photosynthetic pathway) and S. comata (C3),
comprised an average 81% of the aboveground plant biomass, followed by contributions from 31 other minor species, including a 7% contribution of a sedge, Carex eleocharis Bailey, 4%
contributed by the sub-shrub, Artemisia frigida Willd, and a 7% contribution of the remaining 29 species, a variety of grasses and herbaceous dicots. Of the 31 minor plant species found at the site over the five study years, only one responded significantly (P<0.05) to CO2; A. frigida
(Figure 15). Aboveground biomass of A. frigida increased from 1.5 g m-2 at presented
atmospheric [CO2] of approximately 360 ppmv to 10.6 g m-2 at 720 ppmv [CO2](Figure 15a).
While the 9 g m-2 increase in plant biomass of A. frigida is less than the 33 g m-2 increase reported earlier for S. comata (Morgan et al., 2004), the only major species to exhibit a
production response to CO2, the relative response of A. frigida was much greater at over 700%.
Shrub encroachment into many world native grasslands over the past 100-200 years is a species shift that has been attributed in part to rising CO2 atmospheres (Bond and Midgley, 2000; Idso,
1992; Polley et al., 1997). However, it has also been long-argued that livestock grazing, fire suppression and climate change have been responsible for this shrub encroachment, and sorting out the relative importance of these competing forces from the CO2-induced invasion is
challenging (Archer et al., 1995). The results from this project provide compelling evidence that not only is rising atmospheric [CO2] causing changes in plant community structure, but may be
an important factor in the incursion of shrubs into native grasslands around the world. (Morgan, J.A., D.A. Milchunas, D.R. LeCain, A.R. Mosier, and M. West, et al., in prep)
3) Effects of altered untraviolet radiation, litter chemistry, and precipitation on litter
decomposition in shortgrass steppe: We examined the effect of altered levels of ultraviolet (UV, 280-400 nm) radiation and different amounts of precipitation on the decomposition rates of litter
Figure 14. Dissimilarity between Ambient &
Elevated Plots.
Figure 15. Aboveground biomass of A.
frigida in Elevated, Ambient and Unchambered Control Plots
of contrasting carbon to nitrogen ratio (C:N) in a 3-year field experiment in a shortgrass steppe ecosystem. UV radiation was either blocked or passed under clear plastic tents where
precipitation was applied to simulate a very dry or very wet year. These treatments minimized or maximized both the abiotic component of decomposition (UV) or the biotic component
(biological activity of decomposer organisms) to assess potential interactions between the two. Plant tissue quality varied in response to having been grown under ambient or elevated
atmospheric CO2 concentrations. Exposure to UV radiation during decomposition significantly
increased rates of decomposition, especially under dry conditions in litter with higher C:N ratios (Fig. 16). Exposure to UV increased the amount of hemicellulose and cellulose that was lost from the litter, especially in litter with higher initial amounts of these fractions due to elevated CO2 exposure during growth. UV exposure did not affect the decomposition of the lignin
fraction. Increased decomposition with UV radiation was accompanied by a decrease in N immobilization over the summer months. These results could suggest that the effects of UV on decomposition rates may be primarily abiotic, caused by direct photochemical degradation of the litter. Our results imply that UV radiation may play a significant role in decomposition of surface litter in semi-arid grassland environments, especially during dry years, which may affect the way N is cycled from the litter to the soil in these ecosystems. L. A. Brandt, J. Y. King, and D. G. Milchunas(submitted).
Figure 16. Results from UV experiments under dry and wet conditions with variable C/N ratios.
0 0.05 0.10 0.15 0.20 0.25 0.30 0.35
Dry Dry Wet Wet
Low C:N High C:N Low C:N High C:N
Treatment +UV -UV A B A, B A, B A A C B R a te of D e c o m p os it io n (k )
4) Coupling of terrestrial and aquatic ecosystems: Silicon stable isotopes ratios (30Si/28Si) have been used to trace the biogeochemical pathways of Si as it moves from its continental sources to its sink in ocean sediments. In terrestrial ecosystems, during soil development Si is incorporated
into clay minerals, taken up by plants where it forms plant opal, and eventually transported into rivers, the major land-to-ocean conduit. We recently published Si isotope fractionation data utilizing a combined data from field and greenhouse studies (Zeigler et al, 2005). This research demonstrated that the isotopic composition of dissolved Si in weathering systems is determined by fractionation resulting from the combined effects of 1) rock disintegration, 2) clay mineral formation, and 3) biological cycling of Si by plants. Our work detected a “biological signal in the isotopic analyses of BSi (Biogenic Silica) in the surface organic matter rich horizons of the Hawaiian soils. This δ 30Si value negative shift is modified by addition of phytoliths carrying δ
30Si values of about -1.5‰ more negative than the parent material. What is known about the
effect of biological plant activity on the δ30Si values of natural soil systems is that in general BSi has a more negative δ30Si values than rocks and soil minerals (Zeigler et al, 2005). We measured grass phytoliths with variable δ30Si values up to -1‰ relative to basalt, and about -2‰ relative to the soil water from which their parent solution (plant water) derived. Experimentally we isolated the biocycling effect on the phytolith δ 30Si signatures in hydroponically grown grass plants and discovered that the δ 30Si values were on average about 1.1 to 1.4‰. more negative than the Si source. We believe the potential of Si isotopes to provide and “isotopic finger print” of BSi in grasslands and allow us to develop mixing models to quantify the degree to which plants recycle Si with these diverse soil systems.
4. Integrated, Synthetic and Cross Site Research
a. Phosphorus Transformations and Climate:
The individual site characteristics of a climosequence are presented in Table 3. In addition to these properties, soils differ in microbial community structure, with greater abundances of fungi relative to bacteria in the shortgrass steppe compared to the tallgrass prairie (Blecker et al, 2006; McCulley and Burke, 2004).
Table 3 Characteristics for the 3 sites comprising the Great Plains climosequence. MAP = mean annual
precipitation. MAT = mean annual temperature. (Adapted from Blecker 2005 and Ippolito et al. In prep).
Shortrass steppe Smokey Valley Konza
Latitude 39° 45.02 N 38° 53.11 N 39° 05.48 N
Longitude 102° 28.68W 100° 57.63 W 96° 34.12 W
Elevation (m) 1,220 879 406
MAP 462 502 884
MAT 9.9 10.8 12.7
Vegetation Type Shortgrass steppe Mixedgrass Tallgrass Soil Subgroup Aridic Argiustoll Typic Argiustoll Udic Argiustoll Zone of Biological Activity (A Horizon)
Depth (cm) 0-22 0-21 0-29
pH 6.0 6.0 5.1
Dominating P Phase Calcium-P Calcium-P and Occluded (Fe)-P
B P (mg kg-1) 0 200 400 600 800 De p th ( c m ) 0 50 100 150 200
Soluble, Al, Fe Bound P Occluded P Ca Bound P Horizon Boundaries B P (mg kg-1) 0 200 400 600 800 De p th ( c m ) 0 50 100 150 200
Soluble, Al, Fe Bound P Occluded P Ca Bound P Horizon Boundaries C P (mg kg-1) 0 200 400 600 800 1000 1200 De p th ( c m ) 0 20 40 60 80
Fig. 17. P fractionation from A) shortgrass steppe, B) mixed-grass prairie, and C) tallgrass prairie. Dark circles
represent soluble+Al+Fe bound P. Light circles represent occluded P (i.e. Fe coated P). Upside down triangles represent Ca bound P. Horizontal dashed lines represent separation between soil zones (horizons).
We used a climatic gradient to establish the range and variability of P transformations in biogeographically diverse grassland ecosystems, across the shortgrass steppe, mixed-grass prairie and tallgrass prairie (Ippolito et al. In Prep). Identifying P quantities contained in soils found at locations across the Central Great Plains allowed us to 1) assess the range and variability of P biogeochemical behavior in grassland soils, and 2) quantify the degree of chemical weathering and variations in biocycling in semi-arid to humid grassland ecosystems. Key results showed cumulative P concentrations reached a maximum in the zone of biological activity (i.e. the A horizon) under mixed-grass systems, suggesting greater biocycling (Figs. 17A-C). Most sites demonstrated greater proportions of secondary P minerals in the subsurface relative to the surface soil horizons, suggesting increased surface weathering through mineral dissolution and subsurface re-precipitation. Calcium-bound P decreased and occluded P (i.e. Fe-coated P) increased in zone of biological activity, from the shortgrass steppe to the tallgrass prairie, reflecting increases in mean-annual-precipitation and annual net primary productivity.
b. Soil Ecology and the SGS-LTER:
The current soil ecology at the SGS-LTER has focused on the coupling of soil organisms of plants through direct and indirect interactions. These studies have revealed some important insights into how systems are structured and how they respond to natural and anthropogenic disturbances. Our approach has been to couple the community-based perspective of modeling populations with the ecosystem-based perspective of nutrients and energy.
Two insights have emerged (Moore et al. 2005). First, theoretical treatments of food webs usually focus on static configurations of dynamic interacting species that are mathematically stable. Our empirical work at the SGS-LTER like that of others revealed that the structure of soil food webs are far from static in their configurations, but rather are dynamic with species
dropping out and trophic interactions shifting throughout the season or in response to
should reflect this aspect of dynamic structures and offered a formula for how this research might proceed.
Second, even though the food webs structures are dynamic, they do exhibit a pattern of being organized into subsystems or compartments of tightly coupled consumers and resource that are less tightly coupled by higher order consumers, that there is variation in the dynamics of the organisms making up the trophic structure and in the structures themselves, and that this variation provides the basis for stabilizing mechanisms (Moore and Hunt 1988, Rooney et al. 2006).
References
Archer, S., D.S. Schimel, E.A. Holland, Climate Change 29, 91 (1995) Bond, W.J., G.F. Midgley, Global Change Biol. 6, 865 (2000).
de Ruiter, P.C., V. Wolters, J.C. Moore, and K. Winemiller. 2005. Food Web Ecology: Playing Jenga and Beyond. Science 309:68-71.
Lauenroth, W.K., Dodd J.L., Sims, P.L. 1978. The effects of water- and nitrogen-induced stresses on plant community structure in a semiarid grassland. Oecologia 36: 211-222. Idso, S.B., Climate Change 22, 85 (1992)
Morgan, J.A., A.R. Mosier, D.G. Milchunas, D.R. LeCain, J.A. Nelson, and W.J. Parton, Ecological Applications. 14, 208 (2004).
Milchunas, D.G. and Lauenroth, W.K. 1995. Inertia in plant community structure: state changes after cessation of nutrient-enrichment stress. Ecological Applications. 5:452-458.
Polley, H.W., H.S. Mayeux, H.B. Johnson, C.R. Tischler, Jour. Range Manage. 50, 562 (1997). Vinton, M.A. and Burke, I.C. 1995. Interactions between individual plant species and soil
nutrient status in shortgrass steppe. Ecology 76: 1116-1133. Whittaker, R.H., Ecological Monographs 22, 1 (1952)
B. Information Mangement
The Shortgrass Steppe (SGS) LTER Information Management (IM) team currently consists of Nicole Kaplan, IM Team Leader, Bob Flynn, GIS and IT Manager, and Sowmya Lolla, Web Developer.
The IM Team is improving data discovery, delivery and interoperability tools within the SGS Information Management system. Our efforts have been guided by both internal evaluation of our strengths and weaknesses, and an external mid-term review, which occurred last summer by National Science Foundation. We have continued to work with Inigo San Gil at the LTER Network office to implement a newly designed relational database management system
(RDBMS) and PERL and XSLT (Extensible Stylesheet Language Transformation) scripts that now contain and generate level 5 EML (Ecological Metadata Language) content. The IM Team works closely with our core Staff and Principal Investigators to enhance metadata to collect more robust level 5 EML content. Level 5 EML describes tables and attributes in addition to project objectives, methods, locations, and principal investigators.
We are constructing new information delivery tools within a redesigned SGS-LTER website that serves metadata and other information from the new RDBMS. Our staff has been involved with developing and adopting Recommendations for Website Design within the LTER Network. We are taking into account these recommendations, applying a Java script for menu navigation, installing website search tools and using Macromedia (Adobe) Fireworks for displaying images from the field site.
Our staff provides support for SGS-LTER researchers and students in various aspects of GIS including gathering data with GPS equipment and imagery, assisting with GIS model
development for their particular research, and providing GIS data and maps for field work and modeling. He has also extended existing programs for analysis of SGS-LTER data.
The IM Team has implemented a suite of programs, called the Matrix, to improve QAQC practices and support data analysis. We have used the Matrix to check and format twenty years worth of level 2 meteorological data for submission to CLIMdb
(http://www.fsl.orst.edu/climdb/). Level 2 includes measurements of relative humidity, total solar radiation and mean wind speed, in addition to minimum, maximum and mean temperatures and daily precipitation measurements. The Matrix also was used to check and format data sets for vegetation studies under different grazing histories from which multiple manuscripts have been produced over the past year. The IM team will continue to work with researchers to develop the Matrix to more efficiently process, quality check and publish their data with high integrity. The IM Team and SGS-LTER Staff are working on creating an inventory and library of historic International Biome Project and LTER data and reports. These efforts will help preserve the history of project goals and administration and evolution of ecological studies that spans over forty years at the SGS field research site. We hope this will serve as a useful resource for LTER Administrators and Researchers in the future.
The IM Team not only contributes to wide databases, we also participate in Network-level activities. We are providing logistical support for over fifty participants, including ten international guests attending the annual Information Manager’s meeting scheduled two days prior to the 2006 LTER All Scientists Meeting (ASM) in Estes Park, Colorado. In addition, we are planning a site visit with international LTER IMs from Australia. Finally, our Information Manager is a member of the IM Executive Committee and is helping to organize two workshops at ASM. The first is on the analysis and synthesis of aboveground net primary production data collected at distinct grassland sites (http://canopy.evergreen.edu/bcd/home.asp), and the second is to create a controlled vocabulary to facilitate data discovery for the ecological community.
C. Educational, Outreach, and Training Activities
1. Research Experience for Undergraduates (REU)We currently have two REU students involved in summer projects at the SGS-LTER. Ian Hough comes from Middlebury College, VT, and is studying species diversity with our newly
established precipitation plots. Kathryn Turner comes from Austin College, TX, and is