Comparison of adaptive methods using multivariate regression splines
(MARS) and artificial neural networks backpropagation (ANNB) for the
forecast of rain and temperatures in the Mantaro river basin
Karen A. Latínez Sotomayor1 Instituto Geofísico del Perú, Lima, Perú
Abstract. The Mantaro river basin is an area that is exposed to high climatic variability due to the geography and factors that are not completely known. The agriculture is very important for people who live at and around it. The quality and productivity of the products are related to rainfall and air temperature, commonly farmers sow when their ancestral knowledge indicate it, in many cases the crops were blighted because they have not enough rain or have too low or high temperatures. That is why the farmers need reliable forecasts of precipitation and temperature. This investigation try to do forecast timely and reliable based on global index around the world as predictors. To accomplish this challenge, this investigation used two methods to determine three-month forecasts, using multivariate adaptive regression splines and artificial neural networks backpropagation. Twelve MARS model were estimated for each response variable, each one represent a month. Instead, only one ANNB model was estimated with the same variables because the neural networks need a lot of data. At Huayao; precipitation showed a predictive relative error (PRE) equal to 1.04 for MARS while 2.15 for ANNB; minimum temperature showed a PRE = 0.45 for MARS and PRE = 0.67 for ANNB; maximum temperature showed a PRE = 7.34 for MARS and PRE = 1.41 for ANNB, a high value of PRE for MARS may be due to an unusual value in predictor set at validation stage. At Jauja; the precipitation showed a PRE = 0.62 for MARS and PRE = 1.18 for ANNB; minimum temperature showed a PRE = 0.27 for MARS and PRE = 1.20 for ANNB and; maximum temperature showed a PRE = 1.51 for MARS and PRE = 3.32 for ANNB. At Viques, precipitation showed a PRE = 0.66 for MARS and PRE = 3.00 for ANNB. At lower value of PRE, better are the results thus forecasts are more accurate. Then, the validation results showed that MARS models were more accurate than ANNB.
1. Introduction
In the Mantaro River basin predictability of rainfall and temperatures is not known, give a monthly forecast is very difficult due to the geography of the area and influence of other yet unknown physical phenomena that make this area exposed to high climatic variability. Furthermore, the Mantaro river basin is one of the most important agricultural centers of the central zone of Peru; here lies the importance of forecasts. Farming and other agricultural activities depend heavily on rainfall and temperature; there is the need for predictive models that help the realization of reliable and timely forecasts. The objective of this research is to determine forecasts of precipitation and temperature extremes based on the influences of global variables on a given area. Without the need to enter the field of time series, rather using some kind of nonlinear regression and artificial neural networks.
This research shown a nonparametric regression model known as Multivariate Adaptive Regression Splines (MARS) and Artificial Neural Networks: Backpropagation
(ANNB). MARS is a nonparametric regression method that makes no assumption about the functional relationship between the response variables and explanatory variables, as in the case of multiple regressions. Also, you get a forecasting model using Artificial Neural Networks: Backpropagation, which resemble human neurons for the many connections, in order to compare the results with MARS. The author hopes to find that the MARS have greater accuracy than the ANNB.
2. Methods
The MARS model is constructed using basis function; those together with the model parameters are combined to produce the estimates given by the inputs. The general model is:
,
where is the function intercept, are the coefficients of the basis functions.
is a basis function, being . , is the
product of the Km basis functions. Being the values of v-th explanatory variables at k-th node of m-th basis function. The prediction selection was determinate by the criteria of GCV.
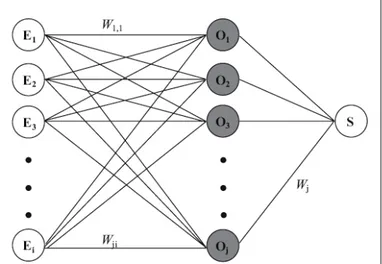
Artificial neural networks (ANN) are based on a structure of neurons connected by links that transmit information to other neurons, which deliver a result by using mathematical functions. ANN learn from historical information through a training process whereby adjusting the network parameters in order to deliver the desired response, then acquiring the ability to predict responses of the same phenomenon. The performance of the networks thus depends on the weights for the links, activation functions specified for the neurons.
The data analyzed comes from three meteorological stations: Huayao, Jauja and Viques. Also used secondary information of the explanatory variables derived from specialized institutions via the Internet, it is worth noting that the amount of information is limited to certain areas of the basin. The information obtained in this research is only applicable to the Mantaro river basin area, is not applicable to other areas of Peru without a previous extensive study. The explanatory variables were used with three-month lag. This lag was selected from a previous author’s study2, which showed better results for forecasts of the Mantaro river basin using three and four months of delay, where the three-month forecast errors were less than four-months forecasts errors.
2.1 Variables and study area
The study area comprises the Mantaro river basin that is located at the central highlands of the country, covers 23 provinces and is now confined to within the territory oh the departments of: Pasco, Junín, Huancavelica and Ayacucho, represent the principal tributary to join the Ene river. The basin is located between parallels 10°34’30’’ and 13°35’30’’ south latitude and meridians 73°55’00’’ and 76°40’30’’ west longitude.
Response variables:
Table 1: Characteristics of used stations at precipitation analysis
Meteorology stations Longitude (W) Latitude (S) High (msl) Period
Huayao 75.30° 12.00º 3350 1960 - 2008
Jauja 75.50° 11.75° 3410 1960 - 2008
Viques 75.23° 12.17° 3184 1963 - 2008
Table 2: Characteristics of used stations at temperature analysis
Meteorology stations Longitude (W) Latitude (S) High (msl) Period
Huayao 75.30° 12.00º 3350 1952 - 2008
Jauja 75.50° 11.75° 3410 1960 - 2008
Explanatory variables or predictors:
A group of global index was used as a predictors: sea surface temperature (SST) from Equatorial Pacific, known as the Nino regions: Nino 1+2, Nino 3, Nino 4 and Nino 3.4 which came from Earth System Research Laboratory (ESRL); sea level pressure (SLP) at Darwin, Tahiti and South Oscillation Index (SOI) which came from Climate Prediction Center (CPC) from NOAA, also another index from different part of the world was used in the analysis. Up to seventeen predictors were used in the estimated models, all of them corresponding to the same time analysis. At Appendix 1, the reader will find all predictors.
2 Latínez, K. 2008. Pronóstico de Precipitación y Temperaturas Extremas del Aire con Meses de Anticipación Usando el Modelo MARS. IGP – Instituto Geofísico del Perú. 13 pp.
Before perform any estimation of the models, the data was reviewed by data exploratory analysis, to detect extreme values caused by some kind of error. The values considered as extreme values were those, which didn’t have physic explanation and were removed from the study.
3. Data Preparation
The MARS models calculated were twelve per each time series; for example, Huayao precipitation has twelve nonlinear models, one for every month. On the other hand, using neural networks only one model was estimated for each time series. Because of ANN needs a lot of data to learn, which is why the entire period was used to estimate the parameters of ANN models.
Huayao station was the one that had the most complete and extensive time series, with data since 1951 at the time of the study. Jauja station had data since 1960 with missing values; the missing values of precipitation represent at least ten percent of data. Jauja’s minimum temperature had missing values to rise thirteen percent; this amount was the highest found at Jauja. The precipitation at Viques had ten percent of missing values.
4. Results
Quantitative results showed that forecasts using the nonlinear regression model (MARS) are more accurate than forecasts using artificial neural networks (ANNB).
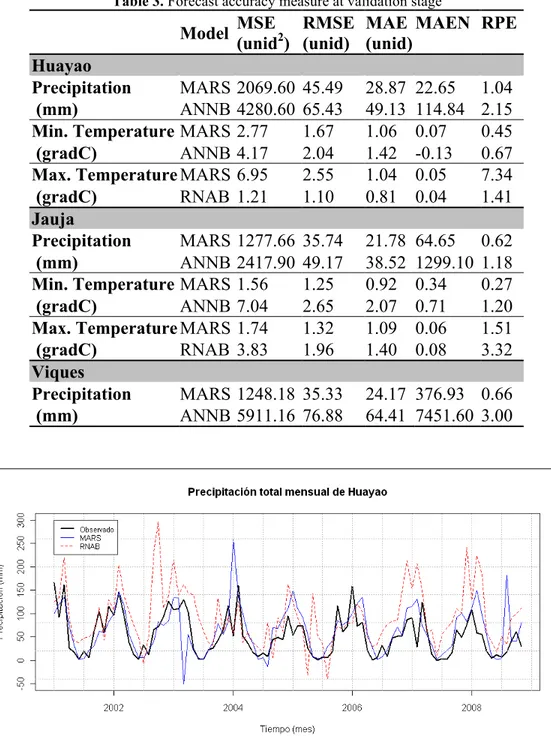
Huayao station shown that forecast with MARS is more accurate than with ANNB, except in maximum temperature, which the forecast were more accurate with ANNB. Presumably it is due to some unusual value of the explanatory variables. Also all the results in Jauja station were with MARS were more accurate than with ANNB. At Viques station, the forecasts of precipitations were more accurate with MARS. Comparing each one of the three stations studied, Huayao had the most accurate forecast. Table 3 show the accuracy of the forecast at all stations by both methods. Figure 2 as an example show the observed values and forecast calculated with both methods. The other time series figures are at Appendix 2.
The model MARS forecasts had less prediction error at time of validation. Appendix 3 shows the forecast values by both methods and the observed values. The model MARS forecast had more concordance with the original values, since the slopes of the lines are very close to one (Example, Figure 3). Instead, the slopes calculated using the ANN forecast shown values less than one. The blue lines belong to MARS and red lines to ANN, the reader can find the other figures at Appendix 3. The graphics at Appendix 3 were calculated by linear regression of forecast values and observed values.
Table 3. Forecast accuracy measure at validation stage
Model MSE (unid2) RMSE (unid) MAE (unid) MAEN RPE
Huayao
Precipitation MARS 2069.60 45.49 28.87 22.65 1.04
(mm) ANNB 4280.60 65.43 49.13 114.84 2.15
Min. Temperature MARS 2.77 1.67 1.06 0.07 0.45
(gradC) ANNB 4.17 2.04 1.42 -0.13 0.67
Max. Temperature MARS 6.95 2.55 1.04 0.05 7.34
(gradC) RNAB 1.21 1.10 0.81 0.04 1.41
Jauja
Precipitation MARS 1277.66 35.74 21.78 64.65 0.62
(mm) ANNB 2417.90 49.17 38.52 1299.10 1.18
Min. Temperature MARS 1.56 1.25 0.92 0.34 0.27
(gradC) ANNB 7.04 2.65 2.07 0.71 1.20
Max. Temperature MARS 1.74 1.32 1.09 0.06 1.51
(gradC) RNAB 3.83 1.96 1.40 0.08 3.32
Viques
Precipitation MARS 1248.18 35.33 24.17 376.93 0.66
(mm) ANNB 5911.16 76.88 64.41 7451.60 3.00
Figure 3. Huayao’s precipitation: observed vs. forecast by both methods
The explanatory variables selected in each MARS model, were different in every month. When ANNB was used, all variables entered to the model. Table 4 presents an example of the variables selected at Huayao; the predictors that were selected vary monthly.
Table 4. Predictors, which involved at Huayao’s precipitation MARS models Month Predictor which involved at models
January PDO, CAR, EA
February EAWR, PDO, SOI, PNA, SCA
March WP, N4, NAO, TSA, PDO
April N12, TNA, D, SCA, PDO
May N3, NAO, SOI, EAWR
June N4, SCA, TNA, D
July NAO, EA, PNA
August NAO, N4, EA, N12, N3 September N4, D, TSA
Octubre PDO, SCA, NAO
November EA, PNA
December N3, D, PNA, TSA
5. Conclusions
The estimated prediction errors of each response variable using the MARS model are minor, but this may be the result of the partition of the data. Maybe if the data length will
be greater, the results using ANNB with the same partitioning improve the forecasts to be more accurate than today.
The selection of variables in MARS models was arbitrary, since the selection criteria used was GCV. In future studies will be pre-select the explanatory variables that will not be removed from the analysis, as being related physically with the response variable.
6. Appendices
Appendix 1: Global variables, name, abbreviation and use
It use in model of
Variable Abbreviation
pp tm and tx
Pacific Decadal Oscillation PDO Sí Sí
North Atlantic Oscillation NAO Sí Sí
East Atlantic EA Sí Sí
West Pacific WP Sí Sí
Pacific / North American PNA Sí Sí
East Atlantic / Western Russia EA/WR Sí No
Scandinavia SCA Sí No
Index of SST in the Extreme Eastern Pacific (Nino 1+2) N12 Sí Sí
Index of SST in the Eastern Pacific (Nino 3) N3 Sí Sí
Index of SST in the Western Pacific (Nino 4) N4 Sí Sí
Index of SST in the Eastern Central Pacific (Nino 3.4) N34 Sí Sí
Sea Level Pressure at Darwin D Sí Sí
Sea Level Pressure at Tahiti T Sí Sí
Caribbean SST Index CAR Sí Sí
Tropical Northern Atlantic Index TNA Sí Sí
Tropical Southern Atlantic Index TSA Sí Sí
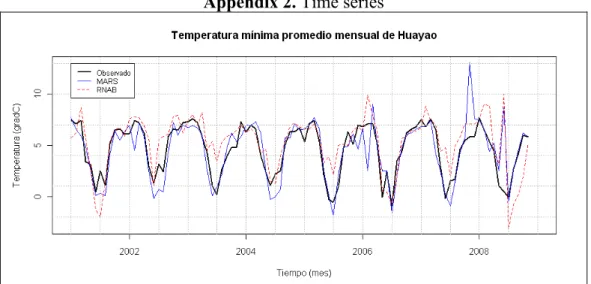
Appendix 2. Time series
Figure A2a. Monthly average minimum temperature observed at Huayao and forecast from both methods
Figure A2b. Monthly average maximum temperature observed at Huayao and forecast from both methods
Figure A2d. Monthly average minimum temperature observed at Jauja and forecast from both methods
Figure A2e. Monthly average maximum temperature observed at Jauja and forecast from both methods
Appendix 3. Observed values vs forecast values of each time series (a) (b) (c) (d) (e) (f)
Figure A3. (a) Minimum temperature at Huayao, (b) Maximum temperature at Huayao, (c) Precipitation at
Jauja, (d) Minimum temperature at Jauja, (e) Maximum temperature at Jauja, (f) Precipitation at Viques.
7. References
Friedman, J.H. 1977. ”A Recursive Partitioning Decision Rule for Nonparametric Classifications”; IEEE. Transactions on Computers, pp. 404-509.
Friedman, J.H. 1988. Fitting functions to noisy data in high dimensions. In computer Science and Statistics: Proceeding of the 20th Symposium (E. Wegman, D. Gantzz, and J. Miller, eds.). Amer. Statist. Assoc., Washington, D.C., pp. 13-43.
Friedman, J.H. 1991. Multivariate Adaptive Regression Splines. The Annals of Statistics, Vol. 19, No. 1 (Mar., 1991), pp. 1-67
Instituto Geofísico del Perú. 2005. Atlas Climático de precipitación y temperatura del aire en la Cuenca del Río Mantaro, Volumen I. CONAM. 107 pp.
Instituto Geofísico del Perú. 2005. Diagnóstico de la Cuenca del Mantaro bajo la visión del cambio climático, Volumen II. CONAM. 90 pp.
Instituto Geofísico del Perú. 2005. Vulnerabilidad Actual y Futura ante el Cambio Climático y Medidas de Adaptación en la Cuenca del Río Mantaro, Volumen III. CONAM. 104 pp.
Latínez, K. 2008. Pronóstico de Precipitación y Temperaturas Extremas del Aire con Meses de Anticipación Usando el Modelo MARS. IGP – Instituto Geofísico del Perú. 13 pp.