Designing Applications
for Smart Cities
A designerly approach to
data analytics.
A thesis-project by
Dennis Bücker
Interaction Design Master at K3
Malmö University (Sweden)
June 2017
Time of examination
29. May 2017
15:00
ExaminerMaria Engberg
SupervisorPer Linde
Abstract
The purpose of this thesis is to investigate the effects of a designerly approach to data analytics. The research was conducted during the Interaction Design Master program at Malmö University in 2017 and follows a research through design approach where the material driven design process in itself becomes a way to acquire new knowledge. The thesis uses big data as design material for designers to ideate connected products and services in the context of smart city applications. More specifically, it conducts a series of material studies that show the potential of this new perspective to data analytics. As a result of this research a set of designs and exercises are presented and structured into a guide. Furthermore, the results emphasize the need for this type of research and highlights data as a departure material as of special interest for HCI.
Definitions of terms used in this research
Below you can find a list of terms frequently used in this research. Each term includes a definition in the context of this thesis. Later, the terms are further defined and referenced in dedicated parts of the research.
The designer The term includes interaction, product and service designers.
Data The term refers to the concept of “big data” and “smart cities”: immense collection and storing of information about the urban environment and citizens.
(Digital) Materials If not stated otherwise in this research, the term materials or digital materials mean data itself, and hardware and software needed to collect and process the data. This includes for example sensors,
(micro)computers, and interfaces.
A designerly approach to data analytics
The term means to actively design with data: instead of using data to validate designs, it is incorporated into the design process.
Design process The term focusses on the creative process of ideation and iteration.
Table of Contents
1. Introduction 5
2. Research framing 6
2.1. Research approach and methods 7
3. A designerly approach to data analytics 8
3.1. Designing through a material lens 8
3.1.1. Model 1: Methodology for materiality (Wiberg, 2014) 10 3.1.2. Model 2: Material experiences (Giaccardi & Karana, 2015) 11
3.2. Related works 11
3.2.1. “Inspirational bits” (Sundström, et al., 2011) 12 3.2.2. Light painting WiFi (Arnall, et al., 2011) 12 3.2.3. Listening to everyday kettle (Cila, et al., 2015) 13
3.2.4. Relation to the models 14
4. Design activities and experiments 15
4.1. Pilot experiment 15
4.2. Prerequisite: Mapping design process parts 16 4.3. Creating a fact sheet about big data 17 4.4. An ethnographic approach to data literacy 22 4.5. Experiencing data: “Embodied Connection” and “Unknown Role” 23 4.6. Accessing Data: “Departure hunting” 26 4.7. Ideation with data concept design games: “Link with Data” board game 27 4.8. Envisioning with data: “Tangible Statements” 31 4.9. Creating quality statements and experience patterns 35 5. Structuring and integrating the designs into a guide 38
5.1. Understanding the material 38
5.2. Envisioning material experience 39
5.3. Identifying statements and patterns 39 5.4. Transition: Creating a prototype of the concept 40
6. Discussion and Conclusion 41
6.1. Summary of findings 41
6.2. Evaluation of the process and the result 42
6.3. Future opportunities 43
7. Conclusion 44
8. Bibliography 45
1. Introduction
Cities play the most important role in human and economic activity. By 2014 the UN announced that 54% of the world’s population lives in urban areas, a proportion that is expected to increase to 66% by 2050(United Nations Population Division, 2015). Cities must deal with growing inequalities within their own structures, a diversification of its population and a conversion of their family structures. Urban areas will face massive logistical, ecological, economic and social issues in the near future (Monzon, 2015). Smart cities are a part of a number of envisioned solutions. In the past 20 years, cities which embraced information and communication technologies (ICT) have been pioneers in embedding digital systems into the urban infrastructure and been variously labelled as “wired cities” (Dutton, et al., 1987), “cyber cities” (Graham, 2004), “digital cities” (Ishida & Isbister, 2000), “smart cities” (Hollands, 2008) or “sentient cities” (Shepard, 2011). Each term describes the vision of connecting ICT and modern urbanism. In a previous research about smart city visions, I stated: “The overriding motivation, that is the coherent and powering catalyst in all these visions […] is one: efficiency“ (Bücker, 2016, p. 33). The underlying driver for efficiency are ubiquitous connected ICT (“Internet of Things”), which are making it possible to collect large amounts of data about minute aspects of a city, creating so called “big data”. Instead of relying on insufficient “small data” like national census, surveys, etc. (Kitchin, 2013, p. 3) which record relatively little data about the city and its citizens (Miller, 2010), ICT, Data scientists and machine learning are now aiming to analyze and connect various datasets and utilize them in various ways. The goal of big data is to provide a much more sophisticated, real-time understanding and control of the city and its citizens. By this, it is argued that cities transform into more manageable, sustainable, resource-efficient and secure areas (Townsend, 2014). Though, this situation raises concerns from an HCI or interaction design perspective: In the current Internet of things environment, there seems to be a race to tag every product with a sensor without the guidance of a clear user experience or business model (Claro Partners, 2014).
Research in the “third wave of HCI” is challenging the efficiency values related to technology and is embracing experience and meaning-making (Bødker, 2015). But without new methods to understand and tap into people’s patterns of behavior, it is hard for designers to gain an understanding of these digital materials, imagine and create meaningful products or services based on networked objects. Therefore, this thesis argues for a new perspective on big data as a material in the process of creating smart city solutions. Manzini (1989) asked for a shift from characterizing materials by what they are, to characterizing such materials by their functionality - rather than asking “what is it?”, designers should begin asking “what does it do?” (Manzini, 1989, p. 34) in order to allow a direct material experience and to understand the potential applications. Following this understanding, this research understands big data not just as a resource to make and validate design decisions towards more efficiency, but as a creative material, which can be integrated along creative process of ideation and iteration of meaningful user experiences. By offering a “designerly approach to data analytics” the research aims at exploring the creative process of ideation and iteration through a material lens.
2. Research framing
Experimenting and designing with digital materials is facing particular challenges. Properties of hardware and software are sometimes impossible to grasp, observe or for all practical purposes invisible. The upcoming smart ICT (“Internet of Things”) - consisting of billions of networked objects or services – will make it increasingly important for designers to understand and design with this particular material. Especially in the sector of urban life, where Internet of Things and big data play an important role in solving the challenges ahead, this material will shape the interactions and experience of a city and its citizens in nearly unlimited ways. Modern computation technologies such as machine learning are making it possible to collect and analyze large amounts of data about minute aspects of a city, transforming urban life to become more sustainable and efficient. This situation raises challenges for designers to integrate this material into the design process of human-centric solutions and creates new opportunities to develop user experiences. Traditionally, when considering design and data together people think of practices such as user and usability validation, demographic insights, usage monitoring, sales data, interviews, visualizations, etc., to predict and validate a design process. However, this research argues for another powerful opportunity of data: not just as a resource to make and validate design decisions towards more efficiency, but as a creative material, which can be integrated along the creative process of ideation and iteration of meaningful user experiences. By offering a “designerly approach to data analytics” the research aims at exploring interaction design through a material lens: material studies that illustrate the differences between designing from data and designing with data, and methods to understand and tap into people’s patterns to imagine and create meaningful products or services based on networked objects. By doing so, the research does not aim to compete with machine learning or artificial intelligence, but to offer a synergetic process when designing digital applications with data. Neither will this research fully consider the various licensing models of data, but encourage the designer to consider the ethical questions of data implementation.
The thesis aims for interaction, product and service designers, including researchers and practitioners. Eventually, the research will gain scientific relevance with two contributions:
1. A guide containing processes and tools how to design with data in the creative part of ideation and iteration on a conceptual and practical level.
2. Extracting knowledge from studying related work and generating design artefacts.
The research question
How can design for smart city applications benefit from using a designerly approach to data analytics?
2.1. Research approach and methods
In a material driven design process the material is the explicit point of departure in the design process and user experience is the expected outcome. To place the approach to data analytics within HCI, the research will further present (1) a methodology for materiality (Wiberg, 2014) and (2) a node-based framework between materials, practice and people (Giaccardi & Karana, 2015). Both models will be illustrated with related works from the specific research area.
The research will follow a research through design approach (Zimmerman, et al., 2007) where the design process in itself becomes a way to acquire new knowledge. The research will design and execute experiments through a material lens and will use activities and designs to extract knowledge. The activities and designs include reflection-in-action and reflection-on-action and both the focus and the outcome are expected to mutually evolve. In particular, I will follow a serial design experimentation method, as proposed by Krogh et al. (2015), which denotes how design experiments are being carried out in a certain order or logic and influence each other in each step: the research will chronologically investigate how data can be understood and integrated as a design material in the design process. Each step is expected to generate insights or to raise questions which will lead the project forward. The design experiments will be taken either from my own perspective as a designer or with other designers as participants and will generate research or design tools. For this I will choose different forms of engagements, such as research, workshops, games, interviews; appropriate forms and methods to create artefacts, such as sketching, Wizard of Oz, (visual) storytelling, paper prototyping; but also, adequate technology and programming to carry my experiments further. On top of the material driven design process, particular design experiments will introduce further methods, such as Ethnographic research, Concept Design Games, LEGO® Serious Play, Quality Statements and Experience Patterns.
Since the process and the personal approach of the designer is a crucial part of the outcome, the documentation of the process forms an essential part of the research to become generative, grounded and criticizable.
3. A designerly approach to data analytics
Data is becoming more and more valuable in the modern world. The hope of big data is to provide individuals, businesses, research or any other institution with key inputs to in-depth analysis. Big data is supposed to explain the world we live in, which as a next step is used to improve existing products or policies or to create innovations tailored to people’s life (Kitchin, 2014). When considering traditional forms of data and design together people think of practices such as A/B testing, demographic insights, usage monitoring, sales data, interviews, visualizations, etc., to inspire, predict and validate a design process. A data-driven design process uses metrics to help the designer to understand specifics (who is the user? what does the user want?) and to move beyond best practices, intuition or trends (McClain & Vibha, 2017). Data can be used to inform a design process by revealing people’s habits, or by validating the design choices that have been made (“designing from data”). With the advent of big data, it can become a powerful opportunity when used as a creative material, which can be integrated along the creative process of ideation and iteration (“designing with data”). A designerly approach to data and analysis can help to understand and tap into people’s patterns of behavior, and to imagine and create meaningful products or services based on networked objects. The Internet of Things extends the ability for collecting data about the physical world, creating new opportunities for designers to integrate data into the design of physical objects and interactive environments. However, designing with data brings special challenges for the designers. Acquiring and making sense of data on a very large scale – including real-time sensor streams - is difficult and requires combining methods from human-centered design with methods from sensor networking, data science, visualization, and simulation. Furthermore, the designers are required to understand the ethical consequences when personal data is handled or data that can reveal sensitive insights about individuals.
The following section examines how materials shape ways of doing, how this is rooted in the experience of those materials, and, ultimately, how this effort reflects in related works.
3.1. Designing through a material lens
Through a creative process of ideation and iteration, designers engage in a “reflective conversation with the materials of a design situation” (Schön, 1992, p. 3). In his view, a designer generates design proposals by forming ideas into a sketch, which the designer analyzes and improves. This successive process holds an important ambiguity, which eventually stimulates creative discovery:
“Working in some visual medium […], the designer sees what is 'there' in some representation of a site, draws in relation to it, and sees what he/she has drawn, thereby informing further designing. In all this 'seeing', the designer not only visually registers information, but also
constructs its meaning; he/she identifies patterns, and gives them meanings beyond themselves.”
(Schön, 1992, p. 133)
In a more recent book, Löwgren and Stolterman also emphasize that, in order to handle the complexity of interaction design, there should be enough space for reflection. They consider sketching to be an important element of design intelligence, which they define as “the ability to work with the material, with the sketch or model, to reach the final design.” (Löwgren & Stolterman, 2004, p. 48). The authors further define this ability as a knowledge requirement to the material to be able to identify structural, functional, aesthetic and ethical qualities. In publications by Nigel Cross (2006) and Bill Moggridge (2007) this approach is also summarized as a designerly way of thinking and acting. A traditional view on materials is that designers explore materials in a studio or a workshop, where they are used to shape, build and play things; typically paper, wood, clay etc. to develop tacit knowledge of what is possible (Buxton, 2007). However, when design problems require digital material - including both hardware and software -, designers often struggle to have a conversation with immaterial material (Ozenc, et al., 2010). In a broader understanding, digital materials are typically referred to as “smart” or “computational” materials (Bergström, et al., 2010). They are “what is needed to build programs, mechanisms to execute these programs, interface mechanisms and technologies” (Hallnäs, 2006, p. 107). In the context of these research digital materials can be understood as hardware and software needed to collect and process the data. This includes for example sensors, (micro)computers, and interfaces. More important, the research includes data in this definition, too: collected and referenced digital information.
Designers usually accept, that digital materials have their own limitations and possibilities. Designing with them starts almost never from scratch and designers accept that programming languages have existing libraries and hardware is implemented with the selection at hand. Since such materials often need to be set up before properties can take on form and substance, this can be a struggle in itself already (Belenguer, et al., 2012). But digital materials hold a number of unique and interesting features: For example, digital materials are not only reactive (as other chemicals), but include also the potential to work as active elements (Wiberg, 2014). Another typical feature is that they are becoming materials (Bergström, et al., 2010): sometimes properties only become visible over time, in which they can change and provide unforeseen experiences. Data for example, is a dynamic material which can change over time. Its properties and potential reveals only when put to use - especially within the field of Internet of things and the advent of networked objects. When regular objects become smart, the designer is facing a particular situation in which the object with its known features and functions is extended in almost endless possibilities (Löwgren & Stolterman, 2004). The concept of the Internet of things enables data to flow between people, networked objects, and Internet services and has begun to allow designers to explore and shape our surroundings in a way that is unprecedented in both speed and scale. Networked objects are streaming immense amount of data and the further digitalization of objects will lead to a situation, in which the information they collect will soon exceed the information about the physical object itself (Speed & Barker, 2014). It is notable, that a growing interest in HCI and interaction design research focuses on “smart” or “computational”
materials as an important component to the design process, although data as a creative material is not explored much yet. Researchers have started to investigate how to bring digital material explorations earlier in the design process (e.g. Fernaeus & Sundström (2012), Sundström et al. (2011), Tholander et al. (2012), Karana et al. (2015)) and how to effectively incorporate experiential forms (Wiberg & Robles, 2010) into the design of artifacts of merged physical and digital materiality (Golsteijn, et al., 2014). The next section will present two design-based models in detail, (1) a methodology for materiality and (2) a node-based framework between materials, practice and people.
3.1.1. Model 1: Methodology for materiality (Wiberg, 2014)
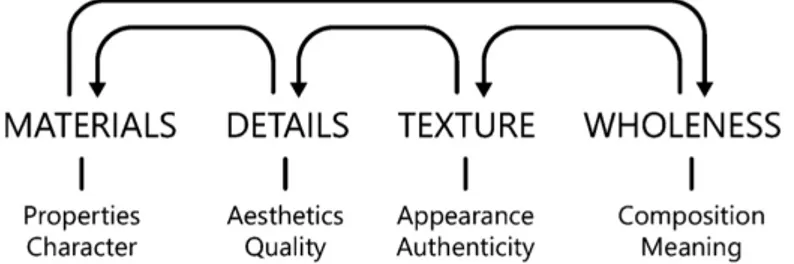
Wilberg (2014) identifies four streams of methods and approaches applied to advance this interest. In particular, the research offers a methodological lens structure based on the previously described back and forth dialectic in design between materials, wholeness,
textures, and details (Figure 3.1) (Wiberg, 2014):
Figure 3.1: Schematic description of the four lenses of the framework (Wiberg, 2014).
The first lens in material research is to focus on the material itself, which opens up two dimensions: material properties and material character. This first investigation is about understanding the limitations and potential of the material. The next level of analysis highlights the importance of attention to how these materials come together in a composition. As Jung and Stolterman write ‘‘materiality can provide useful perspectives to investigate aesthetic and experiential qualities of digital artefacts’’ (Jung & Stolterman, 2012, p. 648) this level observes the meaning and the context of the material composition. From this point, and following the guiding principle of back and forth, the next level is a step backwards towards the intermediate concept of texture. Texture communicates material properties through its appearance and its sensitive perception. As the author notes, “it simultaneously becomes an issue of authenticity, that is, if the appearance has grounding in the materials used in the composition - in short, if the appearance is true given what it is made of.” (Wiberg, 2014, p. 632) Finally, the analysis of the implementation of the material brings the attention to details. After the designer developed a deeper understanding of the material it is now time to reflect on the material properties.
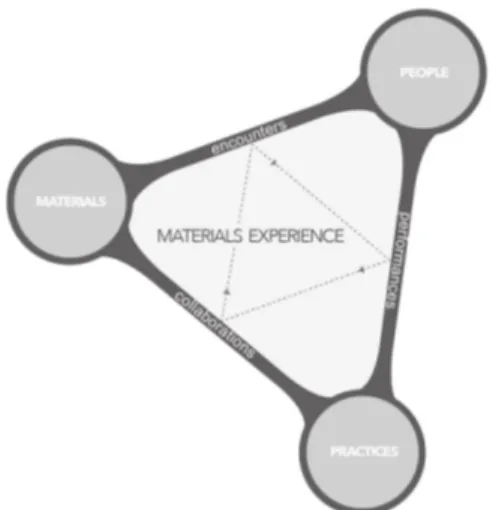
3.1.2. Model 2: Material experiences (Giaccardi & Karana, 2015) Giaccardi and Elvin Karana (2015) propose a node-based
framework and focus on the dynamic relationship between
materials, practice and people in a situational whole (Figure
3.2). These so-called materials experience pattern are a phrase that acknowledges the experience people have with and through materials. It is also grounded in a broad research analysis and argues for the active role of materials in shaping the ways of doing.
The framework is based on three nodes and is supposed to happen in the moment of a design situation as well as over time. Materials are characterized by its properties and “embodiements” (Giaccardi & Karana, 2015, p. 2450) through which these properties can be experienced and performed. People influence the design situation with all their competences and values, while Practices are considered
as unfolding ways of doing within the design situation. These three nodes are connected with relationships which follow the back and forth dialectic. Each type can happen at different times of the process and describes a stage. Encounters are the very first interactions with a particular material, Performances are activities to develop a deeper understanding of the material and Collaborations mean to create with the material. Finally, the framework describes the transition between each relation as experiences:
sensorial, interpretive, affective and performative. The first encounter with a material
happens on a sensorial level, as for example the digital can shape proximity, visibility of interaction, and ephemerality, and these may ultimately impact on our experience of intimacy. The next level is the interpretive level, a level concerning how we interpret and judge materials within the situation, for example describing a system as modern or toy-like. On the affective level emotions are triggered by the qualities of a material artefact. If a material is fascinating or disappointing it affects in different ways. Lastly, the performative level unfolds into unique and peculiar ways of doing, influenced by perceptions, meanings and affections.
3.2. Related works
Neither of the described methods particularly explore digital materials, hence, this section will discuss design efforts from other researchers to illustrate the frameworks.
Figure 3.2: The nodes and relations of the materials experience framework (Giaccardi & Karana, 2015)
3.2.1. “Inspirational bits” (Sundström, et al., 2011)
Figure 3.3. a) Gold Rush bit, a sensor used for seeking radio signal b) The Gymkhana bit, two players playing the game
“Inspirational bits” by Sundström et al. (2011) shows how interaction design research can be achieved through a material lens. The team of designers and engineers, started their design process first with understanding the properties of the Bluetooth technology. They a set of six inspirational bits which access the material from a sensorial and
performative level using lo-fi prototyping and game mechanics to understand the
character and experience of the material. The team created two different set of bits. The first contains three bits and is about the signal - one turning the signal strength into sound, another one to show that the signal is subject to fluctuations and instability of the signal strength (Figure 3.3a), and a third that lets four users seek a hidden transmitter to understand how dynamic movements within a space can affect the signal (Figure 3.3b). The second set contains three more bits and is about finding the weakness and strengths when it comes to different network topologies and how it affects the communication between transmitters and receivers.
Based on the detailed property exploration of Bluetooth (including, e.g., radio frequency, range, and the Bluetooth profile stack), they progressed to envisage a novel interaction design. In doing so, they demonstrated how a detailed understanding of the material can help in envisioning new design and how this exercise also helps in rethinking and reimagining the material itself. The bits expose the properties of Bluetooth early in the design process and their understanding led the designers to create the LEGA - a hand held device for physical sharing of experiences during an art exhibition.
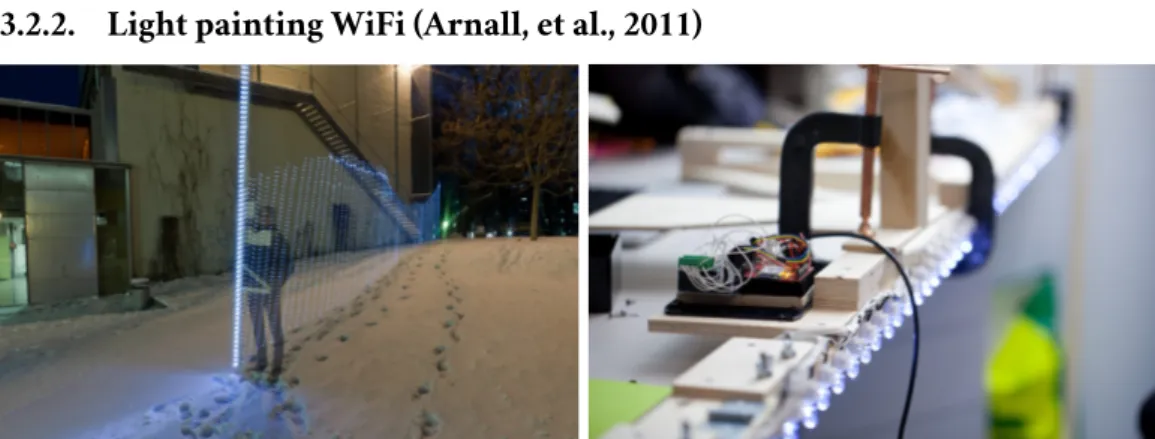
3.2.2. Light painting WiFi (Arnall, et al., 2011)
Figure 3.4. Walking with the WiFi measuring rod and a closer look at the rod.
This example explores the invisible landscape of WiFi that is becoming an interwoven part of daily life. A signal strength measuring rod and light paintings emphasize the architectural scale at which WiFi operates, and situates the networks in the physical
environments that they are a part of. The team of designers and engineers built a visual representation WiFi to at a specific point. It is about four meters tall and consists of a large number of bright LEDs plus a WiFi antenna. Each visualization is created by long-exposure photographs, illustrating how WiFi networks in urban areas are ubiquitous, but also fragmented and qualitatively different.
The team notes, that one illustration is very time-consuming and the capturing action can only be done in a dark, preferably night setting. Nonetheless the instrument transforms radio in multiple experiential qualities signals by creating a second spatial space, besides the city around it and unveils its technical properties. The instrument can not only give an inspirational sense of the relationships between WiFi networks and the physical environment, but opens up a design situation in which the designer can move and understand the network’s behavior depending on where it is located and the city around is built.
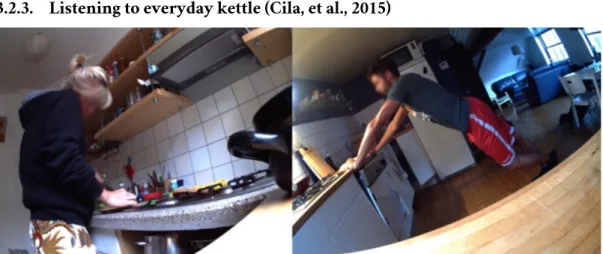
3.2.3. Listening to everyday kettle (Cila, et al., 2015)
Figure 3.5: Things done while waiting for the water to boil (from a kettle’s perspective) (Cila, et al., 2015)
Listening to everyday kettle (Cila, et al., 2015) is good example of observing connected objects within a composition and the dynamic relationship between the material, object and users. A collaboration of ethnographers and Machine Learning experts (ML) selected the mundane home activity of preparing and drinking coffee to capture visual and numerical data about patterns and movements of networked objects. Each object was equipped with sensors. Two analysts from those disciplines analyzed the same data set, complemented one another and the design process. The objects were put in use and only observed by their functionalities and behaviors. For example, the ethnographers found as a first pattern of “community of things”: the behavior of some objects are dynamic while others are static and usually stay where they are. Cups are dynamic objects, and as a such they move, travel in cars which brings them in contact with radios; when taken to work, they come in contact with computers, and so on. As a second pattern the researchers found the different temporalities of objects and users. For instance, if a user makes coffee and uses a kettle to boil water, the kettle occupies time. During that time, the user waits or can do something else before being able to continue making coffee (Figure 3.5). From the ML perspective, a variety of if-patterns was found while the kettle was turned on: “kettle is on if the kettle indicator light is red, kettle is on if the water level is not empty, kettle is on if it is not dark in the room” (Cila, et al., 2015, p. 4). However, the researchers state that “many of the patterns might not be as meaningful”
(Cila, et al., 2015, p. 4) and acknowledged that the ML pattern search is more useful through algorithms.
The ways in which pattern recognition was done in this experiments shows, how the
wholeness of a composition is important to see. The relationship between data, practice
and people unfolds only when put to use and inspires the design process from a materials perspective. Furthermore, the research shows how the context-centered ethnographic approach enriched the quantitative ML approach and ultimately helped the designers to create a more accurate vision.
3.2.4. Relation to the models
The examples relate to the design-based models and illustrate the digital material studies well. The “inspirational bits” (Sundström, et al., 2011) show how a design process through a material lens can offer space for coevolving between the material and the designer. Together with “Light painting WiFi” (Arnall, et al., 2011) the designers are generating material knowledge by experiencing and performing with the material, its properties and character. “Listening to everyday kettle” (Cila, et al., 2015) demonstrates the differences between designing from data and designing with data and shows, how patterns can be found from these two different perspectives.
The next section will conduct a series activities and experiments which will build up on these examples. It will contain design exercises and research prototypes inspired by the “inspirational bits” and the “Light painting WiFi”, and focus on the context-centered approach of data analytics from “Listening to the everyday kettle”.
4. Design activities and experiments
The design process contains a series of activities, experiments and tools, which will investigate how data can be understood and integrated as a design material in the design process. The experiments will build up on the models and related works and are executed in a chronological way. Each activity will conclude with a section in which the findings and reflections are collected. The designers are expected to create application proposals throughout every stage of the guide and are able to evolve the proposals with the process and their understanding of the material.
The series start with a pilot experiment to validates the research question and is a first step towards a designerly approach. Activity 2 is a preliminary attempt to structure the process based on the literature research, related works and the pilot experiment. Activities 3-6 are exposing the material’s properties and character to the designer. In workshops designers can research, experiment and perform with the material. The last activities create a design situation designer in which the designer can apply the knowledge and iterate on the idea proposal. Finally, the designers create quality statements and experience patterns about the material with the knowledge gained throughout the process.
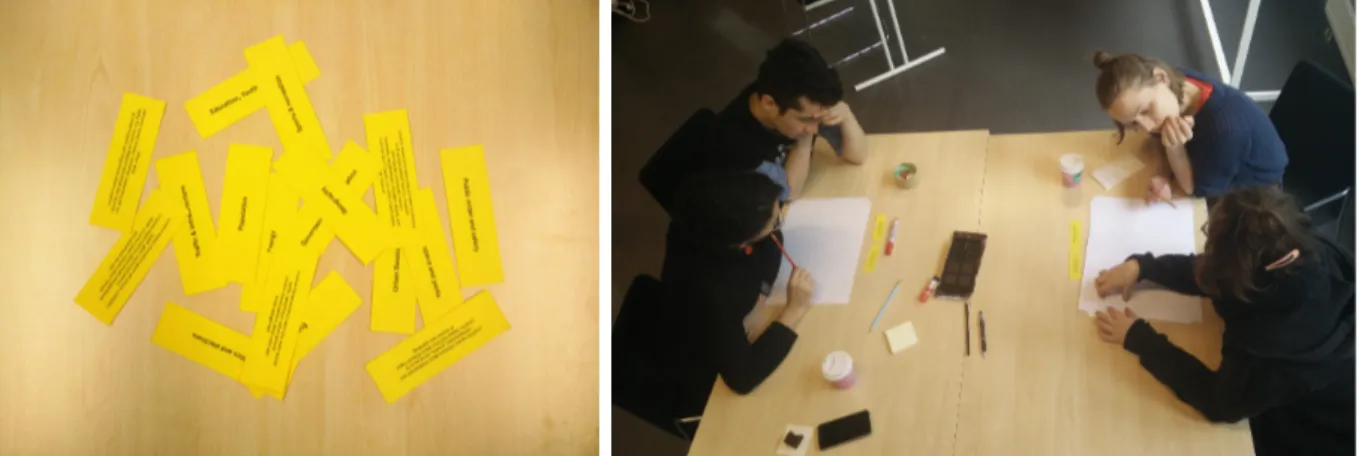
4.1. Pilot experiment
Figure 4.1: The dataset cards and the workshop setup
As a preliminary experiment of my research I designed a workshop (Figure 4.1). I invited designers to use data as a creative material. The purpose of the workshop was to validate the research question and to find out what first step participants choose to generate ideas and to reflect on how this approach is constructive. The data was represented in form of data cards; each shows a category of city data (for example, “Population Data”) on the front and includes a short description of the scope of the data on the back. The participants were asked to draw two of these cards in the beginning and use the datasets to generate user stories for smart city products or services. The workshop is limited to two cards per group which is based on two reasons. As I learned in an early background research, datasets created in smart city environments are usually at least inconsistent, but mostly not available for each category. The limit simulates this fact. The second
The groups were able to generate ideas in a very small timeframe using the cards, which was the intended goal and proved the validity of the research question: one group naturally chose a designerly approach to data by creating situated personas, while the other group tried to analyze imaginary data. Although choosing a traditional approach, the group identified the location-based property and used a map to sketch and connect with the imaginary datasets. Though, both groups reported troubles imagining what “the data” is - thus would have liked to have access to a full dataset, which shows why both groups requested a third card. It is notable, that within the reflection this need turned into a critique of the cards as unsatisfying representation of data. The participants reached the limit of the cards and asked for more content to iterate on their ideas. While the workshop itself was not a direct success, I gained three important insights for my further research. The pilot experiment showed, that the structural issues of datasets (inconsistency, availability) are not the right limitation to start with the creative design process. Second, the representation of the material is an important element within the design process. As a third outcome, the designers liked the context-based and tangible representation to the complex material. A detailed description of the pilot experiment can be found in Appendix 1.
4.2. Prerequisite: Mapping design process parts
As Löwgren and Stolterman (2004) put it, the design of the design process itself is important and often receives the least attention. Thus, the goal of this activity is to map the design process and its parts as an orientation for further experiments and activities. It is important for a material driven design process (a) to enable the designer through activities and designs to reflect-in-action and reflect-on-action and (b) to leave enough space for a mutual coevolving between the material and the designer (Karana, et al., 2015). Hence, the design process must embrace this “intricacy of design” (Löwgren & Stolterman, 2004, p. 40). Based on the previous literature research and the pilot experiment I started to identify the process requirements:
- Allow space for the designer to generate knowledge about the material by understanding and experiencing with the material.
- Enable the designer to identify structural, functional, aesthetic and ethical experience qualities my designing with the material.
- Guide the process along the material qualities of data as necessary limitations and restrictions.
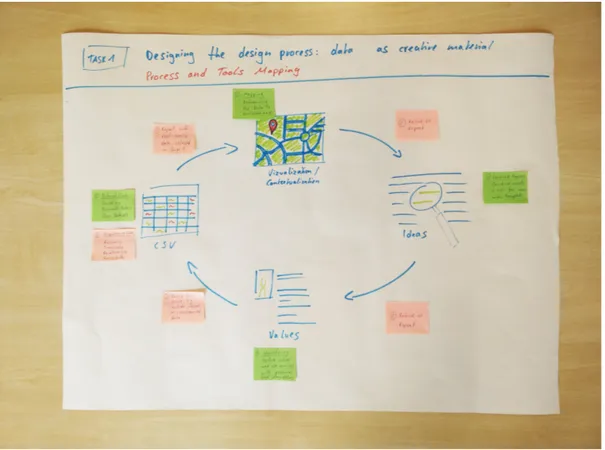
Based on these requirements I was able to identify the process parts (Figure 4.2). The process consists of four parts, which are repeated in stages to gradually include the scope of the material. The process allows the designer to navigate through data in a designerly way. This means, that the designer is not necessarily forced to use the data the process started with, but is also allowed to identify the need to modify or to create new data.
Figure 4.2: A visual sketch of the process stages
The process starts on the left with the first stage of the data spectrum. Through an active and sensory appreciation, the designer then gets in a first contact with the material. Based on this first contact the designer can generate the first impression, question, or idea. This will lead the designer to identifying first values. As the process is repeated, the understanding of the material will gradually become more detailed and the designer will generate more knowledge and more concrete ideas.
4.3. Creating a fact sheet about big data
There is no agreed academic or industry definition of big data, but Kitchin (2013) denotes a number of key features of big data:
- “Huge in volume, consisting of terabytes or petabytes of data; - high in velocity, being created in or near real-time;
- diverse in variety, often temporally and spatially referenced;
- exhaustive in scope, striving to capture entire populations or systems, or at least much larger sample sizes than would be collected in traditional, small data studies; - fine-grained in resolution, aiming to be as detailed as possible;
- relational, containing common fields that enable the conjoining of different data sets;
- flexible in extensibility (can add new fields easily) and scalability (can expand in size rapidly)” (Kitchin, 2013, p. 3).
Big data as described by Kitchin (2013) is a digital material, produced by technologies and ultimately proprietary. This is an important factor and results in various accessing and licensing models. Simply put, the spectrum of available data can be divided into three variants: it can be closed, or shared with specific people or organizations, or licensed as open data (Broad, 2015). Closed data are restricted inside a system and can only be accessed internally or are explicitly limited to its owner or holder inside the system. Health data for example is sensitive personal data, or exposure of password could result into security issues. Shared data is providing data to external organizations or individuals under a license. The terms and conditions might only allow noncommercial use, or restrict adaptations of the data. For example: Twitter data is freely accessible to anyone who agrees to a license. Finally, open data is developed and maintained collaboratively and transparently, and can be accessed and used by any organization or individual. Often the data is maintained with open source software to avoid getting “locked in” to a specific piece of technology or supplier. Though, there are many shades on the data spectrum and often the variants overlap inside a single set of data and where the data comes from. Sometimes data is publicly available to anyone, but under terms and conditions that are not open or only to people who are willing to pay for it.
Thus, this first research focuses on open data due to its unrestricted access. The goal of the first activity is to achieve a general overview of what data is currently produced and what efforts are done to make data accessible for technologies and humans. As an early recognition, I understood the key role data aggregator platforms hold, which…
1. collect data from different sources; 2. normalize and describe the data;
3. link the data to other datasets when possible;
4. offer the data as a unified service to other applications;
5. allow those applications to supply, annotate and enrich the data (Waag Society, 2016).
Through the use of such a platform the data becomes independent and is easily accessible for commercial use or research. The update-ratio depends very much on type and requirements, but is usually to some extend up-to-date. Much data is available in near real-time or from archives and is offered in formats readable for humans (PDF, XLS, HTML) and machines (CSV, XLM, JSON, RSS, WFS, WMS). One very important factor is the language of the datasets. Rarely mentioned in literature, datasets are usually exclusively available in the local language. Further details and description of open and closed aggregator platforms can be found in Appendix 2.
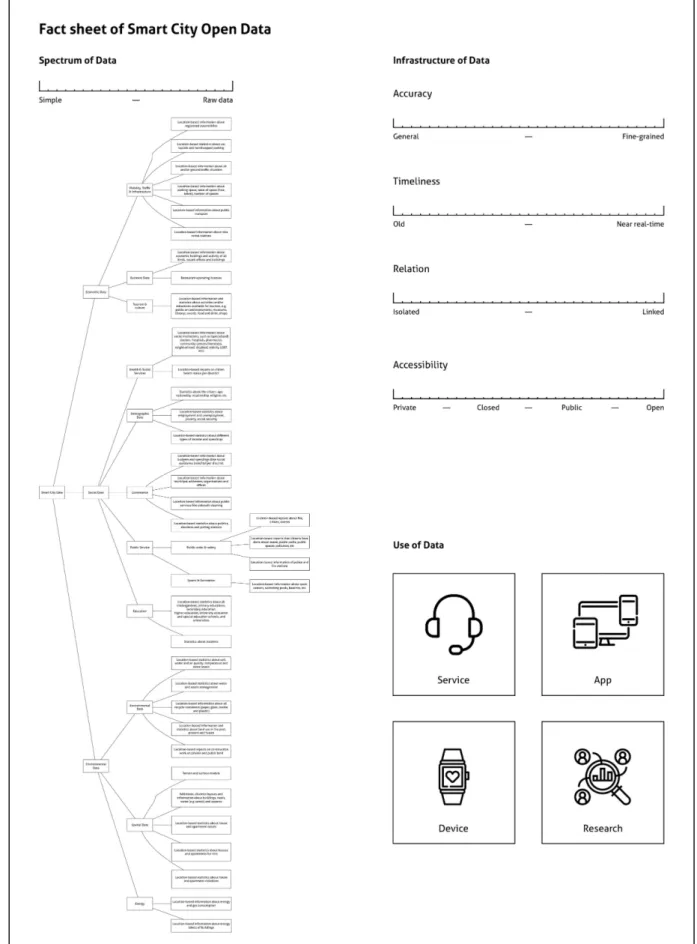
As a next step, I compared Kitchin’s key features of big data (2013) with the current situation of available open data sets. I looked closely at data aggregators of smart cities to find information about content, volume, velocity, variety, scope and resolution. I searched for common properties within the available datasets, which eventually helped me to categorize producible data and to show the structural qualities of data (Löwgren & Stolterman, 2004). The final fact sheet covers three categories: “Spectrum of Data”, “Infrastructure of Data” and “Use of Data” (Figure 4.3).
“Spectrum of Data” describes the scope of a dataset on a scale from simplified to raw data. As data is ultimately content, it can be categorized into wider pieces and increased in
detail, step by step, which helps in further experiments. This part is interchangeable, and can be adjusted to other data origins. In the case of this activity, the diagram is created around open urban data. The scope starts on the left from economic data, social data, environmental data and subsequently details the available data into a tree diagram.
“Infrastructure of Data” describes four unique features of datasets. Accuracy refers to the
detail level of the dataset from being general to fine grained. Timeliness refers to the age of the data from being old to near real-time. Relational refers to the ecosystem of the dataset from being isolated to being linked (e.g. in location, time, etc.). Accessibility refers to the license spectrum of data from being private to closed to public to open.
Through desktop research I identified four types of potential “Use of Data”. Service means the integration of data into a service, for example a transportation service. An
Application could integrate data into an information architecture and accesses also to the
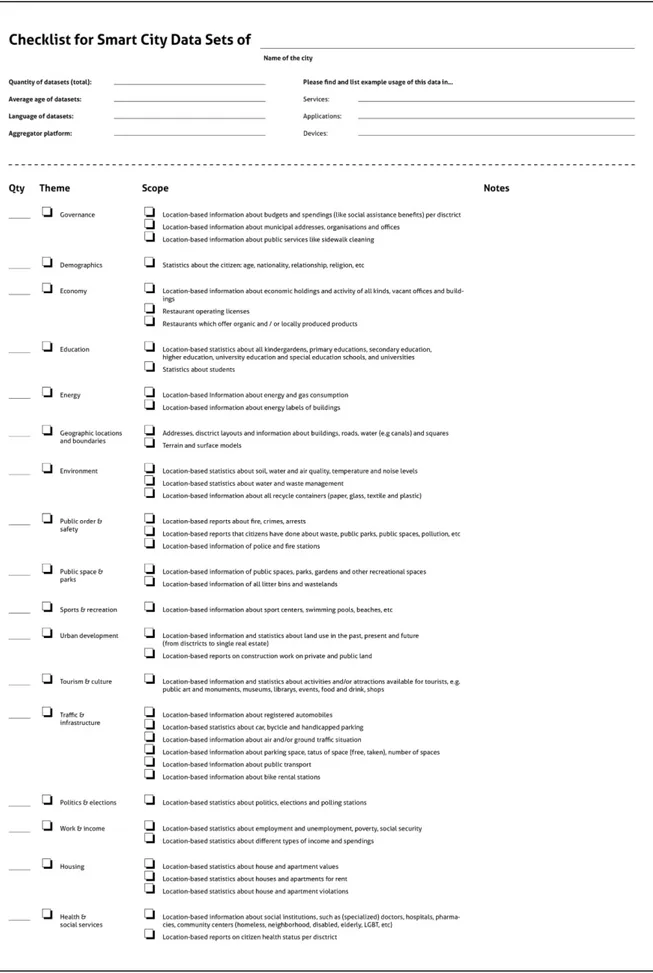
device’s sensors. A Device could integrate the data into specific scenarios, for example a wristband, used in a payment situation. Data can also be used for Research, a field which is not the focus of this thesis though, and thus left out of the further experiments. The fact sheet can then be used as a checklist. The checklist works as a design research tool and can be applied to smart city platforms to understand and identify the quality of available data (Figure 4.4). The top of the checklist contains the infrastructure and use of the data. The lower part covers the data spectrum and offers space for more specific notes about features. On March 17th 2017, I applied the checklist to available data from
six smart cities: Amsterdam1, Berlin2, Copenhagen3, Dallas4 and San Francisco5. Since
each municipality handles naming and categorization by itself, definite answers to the checklist are sometimes hard to make, but nonetheless proved the checklist to be a very handy tool when trying to understand huge amounts of city data. The results can be found in the Appendix 2.
Reflection and findings
Both, the creation of the fact sheet and the application of it in form of a checklist provide a helpful understanding of data in terms of content and technology. The process and the application can provide a necessary understanding for later experiments. The fact sheet takes more time to create, can be a richer experience for the designer than only applying the checklist to data platforms though.
1 https://data.amsterdam.nl 2 https://daten.berlin.de 3 http://data.kk.dk 4 https://www.dallasopendata.com 5 https://data.sfgov.org
4.4. An ethnographic approach to data literacy
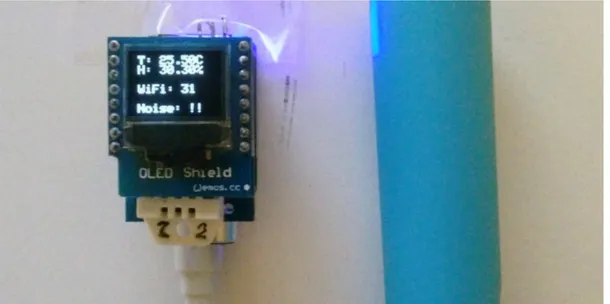
This activity aims to help the designer identifying patterns. Initially, I was looking into creating user interfaces and visualizations of data to make it easier for the designer to identify patters within a dataset - which I realized is not the aim of this research. I also acknowledged after talking to computer science experts, that simply looking for patterns in Excel sheets can probably be done better with machine learning or artificial intelligence. In short, I realized that I moved more towards the direction of classical data analytics and less into the desired designerly approach. I found parallelism between the research of Cila, et al. (2015) and decided to try an ethnographic approach. Ethnographic research is the study of (usually) social and cultural phenomena in their own environment through the use of methods such as observation and field research (Murchison, 2010). A unique feature of an ethnographic approach is to see the phenomena in action: since data is a becoming material (Bergström, et al., 2010) it is actually possible for the designer to participate in the process. This means, the designer can observe and experience how data is generated and how it can behave. Hence, instead of following a machine learning approach, an ethnographic approach is much more of interest for an interaction designer. Additionally, I designed the tool “Data Display” to give the researcher a feeling for the reactivity and continuity of data (Figure 4.5). The battery-powered device is made of a microcomputer, a WiFi sensor (shows the number of available networks), a volume sensor and a temperature and humidity sensor. The collected data is displayed on an OLED screen on top of the device.
Figure 4.5: The tool “Data Display” active and connected to the sensors.
This experiment was carried out by myself. I was using the device and a subscription card of the local public transport service provider Skanetrafiken. The Jojo card is used to pay for the public transport. I took various bus routes and spend time at bus stops. I used the Jojo card and observed the behavior of myself and others at bus stations. I observed the schedule displays at central station, which show the departures and arrivals. All activities were spent with a focus on identifying data patterns. I found various insights, for example that transportation data is very close to being real-time. Also, transportation data is very temporary and repetitive. I also created datasets: By collecting information about busses and passenger I found patterns which weren’t
possible by looking only at the existing datasheets, for example about the interaction inside a bus. In the morning and evening the buses are usually full. Passenger with disabilities usually have to skip the bus, if there is not enough space. A smart system could react to this circumstance.
Reflection and findings
The experiment was not directly a success. The research background of Cila, et al. (2015) showed an interesting outcome and the activity helped me to understand and create data, through an ethnographic lens. Though, I had to realize that the approach consumes much time and attention. The designed tool did not play a big role and failed to add anything to the activity. As a personal experience, it was worth trying and I will definitely recommend the activity as optional research. On the other hand, the experiment carried certain qualities I decided to explore further in other experiments: the activity of focusing on data context and envisioning data into objects. Also, I will redesign the tool and aim its usage more clearly in the next experiment.
4.5. Experiencing data: “Embodied Connection” and
“Unknown Role”
In this experiment, I redesigned the tool from the previous experiment to make it possible for the designer to understand data on an experiential level to identify constraints and opportunities. Bergström, et al. (2010) identifies a unique feature of digital materials as being a reactive and becoming material. To make it possible for the designer to research on how data behaves when put to use, I created two designs in form of wooden boxes. Each box contains sensor which are commonly used to collect data. The boxes “Embodied Connection” and “Unknown Role” react with their environment and the designer can explore the temporal behavior on a sensorial, performative and interpretive level.
Box 1: “Embodied Connection”
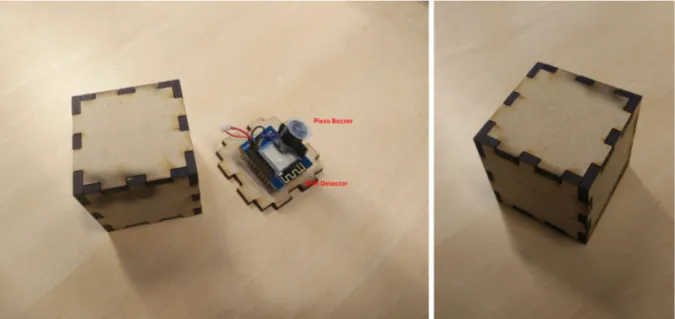
A box contains a microcomputer, a WiFi sensor and a piezo buzzer (Figure 4.6). The goal of the box is to create an embodied connection between the designer, the physical world and digital infrastructure of networked IoT devices. The sensor detects the number of networks and the piezo beeps faster with more networks, or slower with less WiFi networks. The box changes its behavior with the location, thus the designer goes out with the box and explores the near area with the detector. The box is intentionally simple and sealed: the only feedback is the beeping. Hence, the designer can focus on the audio feedback and openly interpret the surrounding area and experience a metaphoric flow of data.
Figure 4.6: The box “Embodied Connection” disassembled on the left and activated on the right.
The box was tested with three designers. Each was asked to take the box on a walk or any other form of mobility for minimum of 15-20 minutes. Afterwards I interviewed the participants about their experience and impressions. The detailed answers can be found in the Appendix 3. All designers reported the box to trigger an unusual urban experience. The box changed the usual behavior and created awareness of the invisible network infrastructure; as one participant answered: “once I even went back, to locate a specific beeping again.” The designers noted, that they also encountered unexpected experiences. While standing on an empty square the box beeped very fast while the participant expected the opposite. Although, from a technical perspective, it makes sense: on an open field are no physical resistors for networks and thus many networks can be found from the sensor. The designers confirmed and enjoyed this different level of exploration. Each one had specific questions about the technology and wanted to learn more to understand the technology. Additionally, the designers realized that the infrastructure for connected devices is ubiquitous: not one participant had a moment, in which the box was completely silent.
Box 2: “Unknown Role”
A box contains a microcomputer, a humidity sensor and an LED (Figure 4.7). The LED color reacts to humidity changes (e.g. breath) and changes from blue to red. Again, the box is intentionally simple and sealed: the only feedback is the LED. Due to the humidity sensor, the walls of the box are perforated. This time the designer does not know what causes the LED to change the color and is expected to investigate in the box: what is the pattern to change the LED? The interaction with the box happens on a sensorial level and requires the designers to perform patterns and interpret where the data comes from.
Figure 4.7: The box “Unknown Role” disassembled on the left and activated on the right.
The box was tested with the same three designers. The box was given to the designers with a simple description: this box contains a sensor and the LED reacts to this sensor. The designers were tasked to find out what sensor is used and to identify the pattern that ultimately controls the LED. It is notable, that it is not necessarily required to solve the riddle. More importantly, the design is supposed to be used as a reflective research tool: the designer can easily try behaviors with the box and interpret different sensors into the box.
Figure 4.8: One participant trying to understand the pattern after the LED changed from blue to red, using her voice.
I was being present during the experiments and watched the participants. Afterwards I conducted an interview with each participant. The detailed answers can be found in the Appendix 3. First I asked the participants to describe the box. It is notable, that no one described the box with technical terms or mentioned the electronics inside. With the next question, I asked the designers to describe their tests with the box and to express these tests as sensors. For example, one participant moved the boxed up, down, left and right in different speeds to see if the box contains a balance sensor or an accelerometer sensor. All participants focused on the perforated walls at some point, although only one
found the humidity sensor. The other designers talked into the box, expecting a microphone (4.8). On a technical side note it is notable that the sensor needs approx. 1-2 seconds to react. This created a confusion sometimes, and misled the participants to false interpretations. Though and as being said before, it was not necessary for the design to work to solve the riddle. Each participant decided on a sensor eventually, even if the pattern was not exactly found (for example, talking to the box can also trigger the sensor). Before I unveiled the humidity sensor I asked the participants where they could see a possible application for their sensor. The participants connected their interpretations and patterns to real world scenarios. After unveiling the sensor, I asked the question again. It was interesting, how this triggered the beginning of a design process. The designers found connections to their own life and found useful applications.
Reflection and findings
The experiments with the boxes as a research tool was successful. The intention was to create an experiential understanding of data on a sensorial and interpretive level. This made it possible to learn how data is a reactive and becoming material. Through the boxes the designers understood that data can not only collected but also be used and connected. The questions about real world applications completed the first stage of the design process and the designers were eager to investigate more into these data “behaviors”. There are many ways how other types of boxes can be done with different sensors and feedback, and as long as the level of understanding can happen on an experiential level, this designerly approach of research and exploration is a helpful tool to analyze data.
4.6. Accessing Data: “Departure hunting”
Technically, API stands for Application Programming Interface. It is a communication format, which makes it possible for machines to talk to each other with methods and
parameter (Gazarov, 2016). Each method has its own parameters. These parameters are
necessary to get a result. Finally, the result contains the data in a machine-readable format (XML, JSON, CSV, etc.) and can be processed further in an interface or the like. Most modern websites consume at least some third-party APIs (for example to display weather information). Usually open data platforms are offering APIs to developer. While creating the fact sheet, I engaged with many raw data sets and felt overwhelmed by the various formats, ways of accessing it and sense-making. Nonetheless I learned many functional qualities of data. Therefore, I designed the experiment “Data hunting” to enhance the experience of accessing raw data. The design introduces the designer to the technology behind interfaces, to access, understand, and compare a human-readable data format (interface) and a machine-readable data format (API).
The local public transport service provider Skanetrafiken is offering various interfaces to interact with their transportation data. The service is accessible by their website, three apps and an open API. The designer is briefed with the following task: “Find the next
services.” The task was given to a designer who was introduced to the concept of methods
and parameters before. It took ca. 20mins for the designer to finish the whole task. The designer found the departure times with the interfaces relatively quick but ran into problems while understanding the API. The designer knew, that the data was available somewhere from the first part of the task, but well hidden. The raw output of data as XML was an unusual format for the designer. While the designer could not understand every available dataset, the designer accomplished also the second part of the task with a little technical help. The designer was interviewed afterwards and reported the struggles. In the Appendix 4 you will find detailed information about the task description, solution and results.
Reflection and findings
The design worked well. It is notable and expected, that designers may need expert guidance depending on their background. Nonetheless, the designer felt empowered and - something I did not directly expect – even inspired. By accessing the Skanetrafiken API and browsing the datasets the designer actively engaged with the data and found further applications: “I would really like to build my own interface for my apartment showing only the next departures to the university or so” (quote of the participant). The experiment showed, that playfulness can work as motivation and have an important role in the design process. It is a quality of the experiment I want to keep in the next experiments.
4.7. Ideation with data concept design games: “Link with
Data” board game
In this experiment, I focused on the playful qualities from the previous experiment. Concept design games (CDG) are a way to resemble real-life scenarios in a playful design situation. Yet, Habraken & Gross write about CDG that “in contrast to real-life experience, the games enable [the designer] to study design actions by providing an environment that is manipulable and well bounded” (1988, p. 151). Such game situations allow the players to construct with specific aspects only, while other aspects are left out for the moment. Such games are intended to create a situation in which the designer can actively engage within the protected, safe boundaries of a game space (Stenros, 2014). Thus, CDG are an ideal way for designers to further understand a complex material, ask questions and design with uncertainties. The goal of the game is for the designer to learn and train that data can be linked and through this, new forms of connected products and services be created.
Within the movement of open data some playful efforts are already made. The open data board game “Datapolis”6 is a game developed to emphasize the importance of open data.
The target group are commercial and non-commercial organizations and governments. The game is still in development and exists in multiple versions. Through online collaboration everyone can participate in creating the game, which unfortunately results
into a complicated setup and confusing rule system. Another work in progress example is an unnamed card game to prototype data visualizations7. The game includes two set
of cards, one with typical request for datasets and another with symbols for possible visualizations.
Through playtesting both games the open data board game seemed very promising to start with. The core mechanism of the game is to connect data tiles in the form of hexagons. Since the game is open source, I involved myself and created and designed a version for my purposes. The outcome “Link with Data” is a board game which resembles the envisioned design process without the specific infrastructural properties of data. Instead, the game uses six simple representations of the data (Figure 4.9).
Figure 4.9: The board game tiles from left to right
The tiles are spatial data, environment data, mobility data, economic data, health data and
demographic data. The datasets are intentionally simplified and open for interpretation
of the participants. The game is played in turns with 3-4 designers; each turn a player is supposed to connect two data tiles and to create and idea either for a service, app, or device. Each idea is collected in a point system and the player with the most points wins (Figure 4.10).
While these are the core mechanics of the game, the details of the game went through some iterations. The first version included only the action cards (Figure 4.10 and Figure 4.11). The cards ask the participants to create either an app, a service or a device using the connected the data. Participants were forced to come up with an idea before the next player was allowed to proceed, which resulted into many vague “I don’t know, but I just write down something” ideas (quote of a player). Therefore, I introduced the challenge cards (Figure 4.12). The challenge cards are based on “City challenges in European cities” (Monzon, 2015) and give a problem statement for each round. For example, one challenge card is “The population of your city is aging very fast. Focus on ideas that help people over 65.” The reactions to the challenge cards were very positive and helped the players to form better ideas (see a collection of the ideas in table 4.13) Furthermore, the players weren’t forced to come up with an idea anymore but supposed to discuss the ideas. Together the group discussed and decided if an idea was worth a point or not. This made the game less competitive, but the outcomes more content. As a next step, I iterated on the action cards. The second version of the cards asked the players to identify an idea or a value. Furthermore, the players were supposed to also give information about the target user and what specific datasets they see as required to make the idea or value happen. The latest game version can be found in Appendix 5.
Figure 4.10: The game played out. The participants created ideas using the action cards.
Figure 4.11: The action cards Figure 4.12: The challenge cards (right)
Table 4.13: The outcomes of the board game after introducing the challenge cards.
Reflection and findings
The design was a good step towards its goal to generate ideas. The interaction of connecting the tiles is a fun and easy way of approaching data. But as Habraken & Gross (1988) emphasize that CDGs are a research tool, not a design tool, I learned, that this approach is not much about generating ideas. It is more about getting to know the process and setting the mindset of a designerly approach to data analytics. The core
Service App Device
A service you can call and helps you navigate to the place you want to go.
(Spatial and health data)
A card-based service that lets you board any transport vehicle (public, rental, bike).
(Mobility and business)
A service for old people to sell things
(Business and demographic data)
During a festival, the city can optimize the health services, food and other services according to the
demographic data of the visitors that are coming to certain events.
(Demographic, health and economic data)
The state offers a delivery service of goods for old people.
(Economic and spatial data)
An app that shows you near stores to buy an umbrella during a storm.
(Environmental and economic data)
An app that warns you about the pollen situation at your location.
(Environmental and health data)
An app that helps you to finds a group of people possible places to meet
(Demographic and environmental data)
Mobility marketplace: Via app or kiosk travelers can get the best mobility option and purchase it directly.
(Mobility and tourism)
An interactive mobility map that allows users to highlight areas that are impassible for those with physical
disabilities, and allows them to plan their routes more efficiently.
(Mobility and health)
A find-a-friend-nearby tinder for elderly.
(spatial and health data)
A festival app to find food trucks during the festival. The app also shows which stores are temporarily closed.
(Economic and spatial data)
A device that activates near taxi drivers when you feel sick.
(Transportation and health data)
A public music payer that adopts the music style to the weather.
(Demographic and environmental data)
A device that activates near taxi drivers when you feel sick.
(Mobility and health data)
A device that keeps you in contact with your family and friends to ensure a safe travel home.
new light. This time, the players did not ask for more datasets in the design process (like in the pilot experiment), but had fun interpreting the data. The feedback confirmed, that the game setting helped distancing: “Using physical cards makes it easier to understand potential data combinations” (quote of a participant). The players also liked the user- and context-centered focus of the game more than the data-centered focus of the pilot experiment (referring to the challenge cards): “It felt like having a discussion about real problems without being blocked by my lack of technical skills.” (quote of another participant).
On the other hand, the game did not satisfy the designer to process the ideas further on two levels. Due to the iconic representation, it was hard to increase the involvement of the material. At least this form of the game is not capable of dealing with more focused datasets. Though, it is possible to increase simplified versions of datasets. For example, the iconic versions could be adopted to more sub categories of specific datasets.
The second version of the action cards are also unbalanced to the overall pace of the game and did not improve the outcomes. One player said: “I wasn’t sure how to use the action cards, it would be useful to have clearer instructions on the cards or more time.” The quote of one participant shows, that players need a lot of time to answer all information asked, during which time other players are waiting to continue and the discussion does not evolve further. Hence, I will address these two issues in the next experiment to balance the ideation process with more time for envisioning with data.
4.8. Envisioning with data: “Tangible Statements”
The design “Tangible Statements” is an advanced version of the “Link with Data” board game and based on the LEGO® SERIOUS PLAY® method. The method fosters creative thinking within a team of participants, who work with metaphors through imaginary scenarios using LEGO® constructions, hence the name "serious play" (Blair & Rillo, 2016). Created in the mid-1990s, the method allows participants to use LEGO® as experimentation and product design tool. The method is built on the three key elements of Play (learning through exploration and storytelling), Construction (building knowledge by building things), and Imagination (using the participant’s creativity) (LEGO Group, 2012).
“Tangible Statements” is a design tool, that helps participants to envision applications of data in between these three corner stones. The designers can look at data under a situated whole and envision the material’s role when embodied in a future product or an application with the help of tangible statements. A large map, LEGO® and other simple toys (cars, busses, figures, etc.) are used as representations of the urban world to convey the concepts (Figure 4.14). As an advancement of the board game, the designers can focus on functional, aesthetic and ethical qualities of the user experience while working with data as creative material.
The goal of the tool is (1) to help the participants to design so called vision statements and (2) to record the design process with a set of tools. The designers set up the process by choosing a challenge and define one or more personas. During the process the designers use the tool collaboratively and create vision statements together.
Figure 4.14: The areas of “Tangible Statements”: The Map (2) and Data Hub (4), The Brief (1) and The Storyboard (3).
The Brief (Figure 4.14.1)
Next to the map, the designer finds the brief: an area in which a challenge card and one (or more) persona card is placed before the actual design process starts. The challenge cards are similar to cards of the board game; the persona cards are set up by the designers and define one (or more) exemplary user affected by the challenge by answering two questions: “What does the user need?” and “Why does the user need it?”.
The Map (Figure 4.14.2)
The map lets the designers place and move users and objects on locations, which are marked as white areas on the map. Users and objects can be created with Lego. The designers can pick from a diverse range of figures and even equip the figures. The objects are built with LEGO® bricks and pieces. The streets can be used with a provided set of mobiles (car, bus and train, plane) to move between the locations.
The designer’s task is to envision data and sensors into these objects. The designer can draw on their learnings from the previous experiments and while doing so, the designers discuss (1) the general possibility of making a specific object smart and (2) how this could shape the experience in the context of the challenge and the persona. LEGO® figures, bricks and pieces allow the designers to quickly shape and re-shape ideas.