Southern Swedish Forest Research Centre
Economic and production consequences of
current forest management in mature Scots
pine (Pinus sylvestris) forests in Lithuania
Rokas Šatinskas
Master thesis • 30 credits
EUROFORESTER Master Thesis no. 317 Alnarp 2019
Economic and production consequences of current forest
management in mature Scots pine (Pinus sylvestris) forests in
Lithuania
Rokas Šatinskas
Supervisor: Urban Nilsson, SLU, Southern Swedish Forest Research Centre
Assistant supervisor: Gintautas Mozgeris, Vytautas Magnus University, Faculty of Forest
Sciences and Ecology
Examiner: Adam Felton, SLU, Southern Swedish Forest Research Centre
Credits: 30 credits
Level: Advanced level A2E
Course title: Master thesis in Forest Science
Course code: EX0928
Programme/education: Euroforester master program
Course coordinating department: Southern Swedish Forest Research Centre
Place of publication: Alnarp
Year of publication: 2019
Cover picture: Rokas Šatinskas
Online publication: https://stud.epsilon.slu.se
Keywords: National Forest Inventory, Pinus sylvestris, thinning, rotation
lenght, alternatives, economic consequences.
Swedish University of Agricultural Sciences
Faculty of Forest Sciences
3
ABSTRACT
Forestry takes up a major part in the economy of Northern Europe countries. The aim of this work is to evaluate the economic and production consequences in Scots pine (Pinus sylvestris) stands in Lithuania based on the data of the National Forest Inventory (NFI). Scots pine stands cover the biggest area of Lithuanian forests. It this thesis, it was decided to evaluate only the thinnings of the IV forest group (commercial forests) where the economical profit is the major aim.
One of the tasks was to summarize and critically evaluate the intensity of thinnings carried in Lithuanian Scots pine stands. The results were achieved after collecting the necessary data and creating a database. After analysing the NFI data, it was noticed that thinnings in Scots pine are of the same intensity in all the stands of heights between 13 to 30 metres and more. The stocking level after the thinning meets the recommendations. One important detail was that many light and very light thinnings are carried out in Lithuania, which may be unprofitable. It was also noted that thinnings were often done in stands of 25 metres and higher which can increase the risk of windthrow.
The second task was to find alternative rotation lengths that would be economically beneficial and compare them to current ones. In order to find out the alternative forest management models, stand modelling software “Heureka” and economic analysis was used. It was estimated that current rotation ages of Lithuanian Scots pine stands are longer than the ones that would be most profitable. There was no significant extension of the most profitable felling age when the thinning regimes are of different intensity. The results of this thesis can be helpful analysing the problems of effectiveness and economical profit in the forestry sector of Lithuania.
Key words: National Forest Inventory (NFI), Scots pine, Pinus sylvestris, thinning, rotation lenght, alternatives, economical consequences.
4
SANTRAUKA
Šiaurės Europos šalyse miškininkystė užima svarbią dalį šalių ekonomikoje. Šio darbo tikslas yra, remiantis Nacionalinės miškų inventorizacijos (NMI) duomenimis, įvertinti ekonomines ir produktyvumo pasekmes grynuose paprastosios pušies (Pinus sylvestris) medynuose. Paprastosios pušies medynai užima didžiausią Lietuvos miškų dalį. Šiame darbe nuspręsta įvertinti tik IV miškų grupėje (ūkiniuose miškuose) vykdomus kirtimus, kuriuose ekonominė miškininkavimo nauda turėtų būti viena svarbiausių.
Vienas iš darbo uždavinių buvo apibendrinti ir kritiškai įvertinti ugdomųjų kirtimų intensyvumus, taikomus paprastosios pušies (Pinus sylvestris) medynams. Rezultatai pasiekti sistemingai atrinkus reikiamus duomenis ir suformavus duomenų bazę. Išanalizavus NMI duomenis, nustatyta, jog ugdymo kirtimai paprastosios pušies medynuose vykdomi vienodai intensyviai visuose vidutinio aukštumo medynuose nuo 13 iki 30 ir daugiau metrų aukščio. Medyno skalsumas po ugdymo atitinka ugdymo rekomendacijas. Atkreiptinas dėmesys, jog Lietuvos pušynuose vykdoma ypatingai daug mažo ar labai mažo intensyvumo ugdymų, kas ekonomiškai nėra efektyvu. Taip pat pastebėta, kad ugdymas taikomas 25 m ir aukštesniuose medynuose, kas gali sukelti vėjo pažeidimų riziką.
Antrasis darbo uždavinys buvo surasti ekonomiškai naudingas alternatyvias kirtimo apyvartas ir palyginti su dabartinėmis. Siekiant išsiaiškinti alternatyvius miškininkavimo modelius, naudota medyno modeliavimo programa „Heureka“ ir plačiai pasaulyje taikomos ekonominės formulės. Nustatyta, jog dabartiniai pagrindinių kirtimų amžiai Lietuvos pušynuose yra 30–40 metų ilgesni už ekonomiškai naudingiausius. Skirtingo intensyvumo ugdomųjų kirtimų režimai tik neženkliai prailgina ekonomiškai naudingiausią kirtimo amžių. Magistrinio darbo rezultatai gali būti panaudojami sprendžiant efektyvumo ir ekonominės naudos padidinimo uždavinius Lietuvos miškų sektoriuje.
Raktiniai žodžiai: Nacionalinė miškų inventorizacija (NMI), paprastoji pušis, Pinus sylvestris, ugdymo režimas, minimalus kirtimo amžius, alternatyvos, ekonominės pasekmės.
5
TABLE OF CONTENTS
ABSTRACT ... 3 SANTRAUKA ... 4 1. INTRODUCTION ... 7 1.1. Project background ... 7 1.2. Objectives ... 82. SCOTS PINE FOREST MANAGEMENT IN LITHUANIA ... 9
2.1. Scots pine and its comparison to other tree species ... 9
2.2. Short history of thinnings in Lithuania... 11
2.3. Management of pine forest ... 13
2.3.1. Thinnings ... 13
2.3.2. Final felling ... 17
2.4. National Forest Inventory ... 18
3. MATERIAL AND METHODS ... 20
3.1. Data collection ... 20
3.2. Data frame ... 21
3.3. Intensity of thinnings ... 22
3.4. Alternative management models ... 23
3.4.1. Simulation with “Heureka” ... 23
3.4.2. Net Present Value and Land Expectation Value calculations ... 24
4. RESULTS ... 26 4.1. Thinning intensity... 26 4.2. Economic analysis ... 28 5. DISCUSSION ... 31 5.1. Thinnings ... 31 5.2. Rotation age ... 32 5.3. Critical approach ... 33 6. CONCLUSIONS ... 34 7. ACKNOWLEDGEMENTS ... 35 8. REFERENCE ... 36 9. ANNEXES ... 40
7
1. INTRODUCTION
1.1. Project background
Forests contribute greatly to the economy of Lithuania. Forestry and logging make 1 % of country’s GDP. In order to exploit these natural resources and increase the profit, regular analysis of production is essential (Mizaras, 2012). Forest management and its models are relevant for both, state forest and private forest owners. Because of long forest rotation period a lot of factors must be considered when economic indicators are calculated.
Foresters use many criteria for selecting the age to cut forest stands, some of them do not take into consideration any of the economic factors involved. Some good examples of criteria are the age at which the trees reach a best size for making some products, the age at which the volume in stands is maximized, and the age at which the rate of growth in volume is maximized. These technical criteria have widely divergent rotation ages with major implications on the costs and benefits generated. Forest management decisions are not only driven by wood volume considerations, but also by economy and other factors (Roberge et al., 2016). Therefore, this thesis focuses on analysing current forest management in Lithuania from the perspective of economy.
All forests in Lithuania are divided into four groups: I – strict reserves (1 %); II – special purpose forest with primary function of either environmental conservation or recreation (12 %); III – protective forest for protection of soil, water etc. (15 %); IV – commercial forest (72 %). In this thesis, the attention is focused on the IV group, of which only pure Scots pine (Pinus sylvestris) stands were analysed. In Lithuania, pine forests is the most common forest type – 35 % of area (SFS, 2017), and it is the most important tree species from an economical point of view.
A lot of useful information has been collected during the National Forest Inventory (NFI) which commenced in 1998. Until the 2017, four full five-year cycles have been implemented. The data of this process is very essential to evaluate forest management in Lithuania. That is the reason why the NFI-data from the period 1998–2017 was chosen as data for this thesis.
8
1.2. Objectives
The aim of this work is to provide an overview of current forest management in pure Scots pine forests in Lithuania, emphasizing the criteria of profitability and productivity using NFI-data.
To meet the aim of the thesis, the analysis was divided into two stages:
1. Description of current management models in pure Scots pine stands in Lithuania.
2. Studies of alternative forest management models and how they would influence forest production and economy.
Based on previously mentioned information, the following hypothesis can be stated: current forest management in Lithuania does not fulfill the economic potential. To be more economically effective alternative rotation lengths should considered.
9
2. SCOTS PINE FOREST MANAGEMENT IN LITHUANIA
2.1. Scots pine and its comparison to other tree species
Scots pine was chosen as the research subject of this thesis for two reasons. Firstly, it is the most commercially important tree species in Lithuania and neighbour countries. It has the biggest share of harvested volume of tree species. Secondly, Scots pine grows in different soil conditions in Lithuania, but rotation age is the same everywhere. This tree can tolerate the worst growing conditions, from dry sandy soils to wetlands (Juodvalkis, 2009).
Scots pine is one of the most important species economically not only in Lithuania, but the whole north of Europe. It is significantly relevant commercially, because the wood is strong and easy to work with, making it excellent for constructions, furniture-making and the pulp and paper industry. It is also used for stabilising sandy soils (EUFORGEN, 2019).
The ability of this species to adapt and resist enormously different natural conditions is clearly visible from its distribution (figure 1). The areal of Scots pine spreads in the Central Europe, Scandinavia, and reaches Manchuria and Okhotsk Sea. Its distribution also depends on the height above the sea level. In the south of the areal it is more common up in the mountains. For example, in the North of Scandinavia it grows only up to 220 m above the sea level; however, in the Balkans it can be found as high as 2200 m (Navasaitis et al., 2003). In Lithuania, the average of the site index of Scots pine is I, which indicates the height of 28 m at an age of 100 years (SFS, 2017).
10
Figure 1. Natural distribution area of Pinus sylvestris in Europe (source: EUFORGEN, 2019)
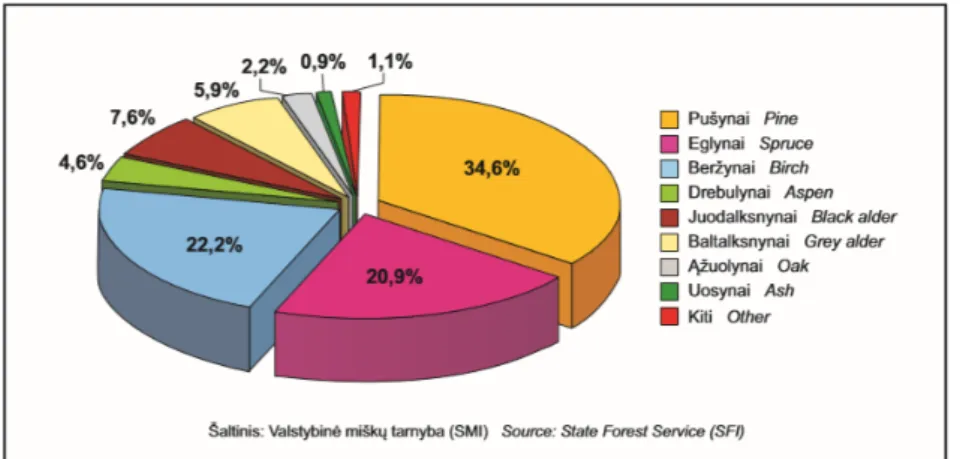
Scots pine (Pinus sylvestris) is the most dominant tree species in Lithuania (figure 2) and covers 34,6 % of all forest land (SFS, 2017). By the percentage of dominance, it vastly surpasses other species, as birch and spruce only take a bit more than 20 % each. In Lithuania, the biggest areas of Scots pine stands are in south and south-eastern parts. The majority of the of Scots pine stands are pure (83 %), but 10 % are mixed with Norway spruce and 5 % with birch (EUFORGEN, 2019). The threshold when stand is pure is 80% and more volume of one species in the stand.
Figure 2. Dominant tree species in forest stands on 01/01/2017 (source: SFS, 2017)
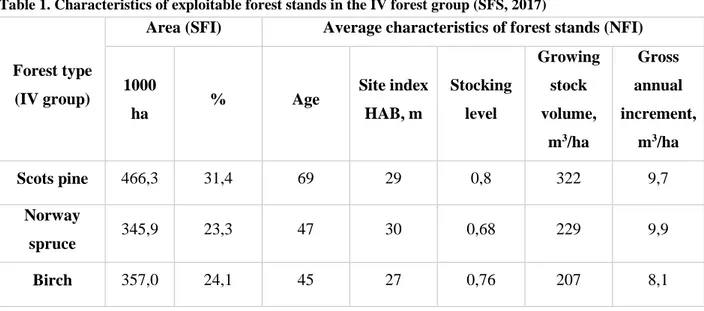
The characteristics of the three most common tree species in Lithuania (Scots pine, Norway spruce and birch) are compared in the table 1. The table only provides the information from the IV forest
11
group which includes commercial forests. The stands of Scots pine are older and denser than the ones of Norway spruce and birch. The age differs by approximately twenty years and stocking level (ratio of stand volume or basal area compared to normal stand volume or basal area (a stand is considered to be normal when the crowns are fully merged)) is bigger by 0,04–0,12 (LRS, 2010). What is more, growing stock volume is considerably bigger. Surprisingly, the gross annual increment of Scots pine is only slightly lower than Norway spruce, which naturally grows on more fertile soils (Nilsson et al., 2010). However, it noticeably surpasses the birch. All the other rates are similar.
Table 1. Characteristics of exploitable forest stands in the IV forest group (SFS, 2017)
2.2. Short history of thinnings in Lithuania
The history of thinnings in Lithuania is divided into two periods. According to Juodvalkis, there is no exact information about the very first thinnings (Juodvalkis, 2003). However, it is stated that this process began in the second half on the 19th century. This first stage lasted until the middle of the 20th century. This period is related to increased need of firewood and possibilities to fulfil it by thinning young forests. At that time areas of thinnings were small. Mostly tiny woods were thinned in highly inhabitant zones. Bad quality trees were often cut only in small areas and not in the whole stand. The situation changed when the demand of domestic tools increased. In 1934, the new regulations were established. Three ways of thinning were mentioned there: plucking, thinning, and gap-cutting. Plucking referred to pruning nowadays; thinning meant eliminating single trees out of a stand; gap-cutting was meant to create open areas by gap-cutting gaps out of a stand. Theoretically, it was recommended combining all the three methods. Nevertheless, practically, forests were abandoned; therefore, the thinnings were implemented in a hurry by cutting the trees that were damaged and interrupted the growth of dominant trees (Juodvalkis and Kairiūkštis, 2009).
Forest type (IV group)
Area (SFI) Average characteristics of forest stands (NFI)
1000 ha % Age Site index HAB, m Stocking level Growing stock volume, m3/ha Gross annual increment, m3/ha Scots pine 466,3 31,4 69 29 0,8 322 9,7 Norway spruce 345,9 23,3 47 30 0,68 229 9,9 Birch 357,0 24,1 45 27 0,76 207 8,1
12
The second stage began in 1950 and was dedicated to classical thinnings according to the Soviet Union school. It was very important to follow all the requirements and instructions because Lithuania was restricted by the Soviet regime. In the forest management plans, attention was paid to the development of four thinning ways: lighting, clearing, and two steps of commercial thinning. After the WWII, only after a while the right intensity of thinnings was chosen. Different researches were carried out and the most appropriate thinning ways were applied following species composition and stand conditions. In 1961 the two-storey stand thinning method was formed. The thinnings were used not only for the purpose of quickening the growth of dominant tree species, but also to increase the volume in the area of thinned stand. In Lithuania, the general idea behind thinnings is to maximize the increment in order to produce the biggest amounts of large sawn timber. After huge amount of experiments and research, the new model for stand forming system was created. This led to the further development of thinning methods and is used until these days (Juodvalkis, 2003).
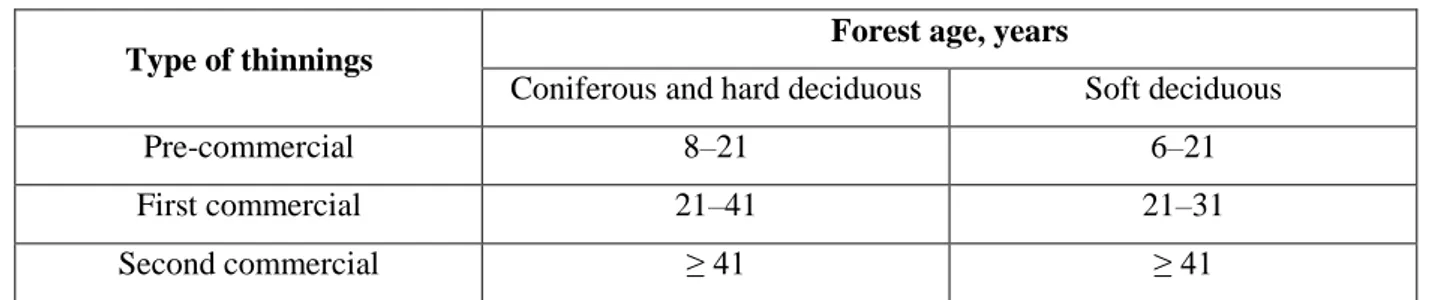
It can be stated that the new, third, stage of thinning stands has begun since the 1st of March, 2010. From this day, the Republic of Lithuania has legitimized the “Regulations for Forest Felling” in which the thinnings are divided into three groups (table 2) and are differentiated among tree species. Nowadays, the thinnings are done for various aims:
• To form tree species composition;
• To regulate the structure and density of the stand; • To increase the productivity;
• To improve the structure of sortiments;
• To increase the resistance of negative abiotic factor;
• To extract the wood which would rot due to natural thinning; • To strengthen recreational and aesthetic functions;
• To create suitable conditions for different ecosystems to survive; • To protect genetic reserves sustainability.
Table 2. Types of thinnings and age (source: LRS, 2010)
Type of thinnings Forest age, years
Coniferous and hard deciduous Soft deciduous
Pre-commercial 8–21 6–21
First commercial 21–41 21–31
13
Even though the word “commercial” is used in the titles of the thinning types, there is nothing related to commerce. This translation was chosen to be used in this thesis according to Swedish tradition. The purpose of the 1st commercial thinning in Lithuania is to reduce competition between trees and create optimal growing conditions for the best trees. The 2nd commercial thinning is oriented in increasing the increment of separate trees and the whole stand (Juodvalkis and Kuliešis, 2009). Both thinning types do not have objectives for timber extraction during the thinnings, the main goal is the condition of the stand in the future. On the other hand, there is some commerce present here, as the thinnings in fact are also aimed for getting some assortments, even though the regulations emphasize forestry professionalism of thinking about the next generations.
2.3. Management of pine forest
2.3.1. Thinnings
Silvicultural treatments in Lithuania are based on optimal light conditions in the stand. The main goal is to achieve maximum possible volume at the age of final felling. According to Juodvalkis and Kairiūkštis (2009), light is a natural factor that can be efficiently regulated in the forest stand. Consistently, stand treatments are supposed to be based on the light regime, in order to achieve maximal productivity (Kairiūkštis et al., 1979). However, economic factors were not considered when designing this management program. The attention is only paid to final volume (Mizaras et al., 2013). This kind of recommendations and management is based on the theories introduced several decades ago and does not match the needs of nowadays. The economical interim results should also be taken into consideration.
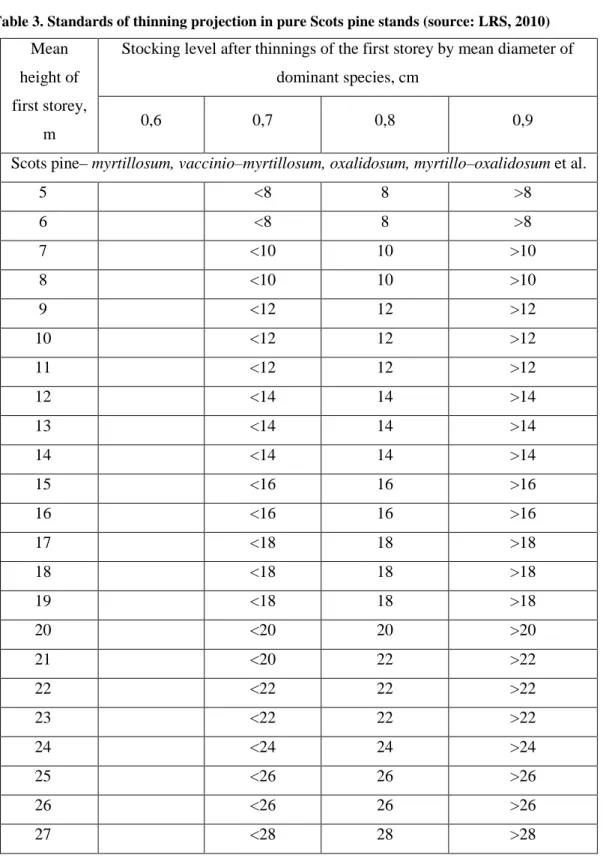
Over the last years, thinnings in pure Scots pine stands in Lithuania are projected following the restrictions described in the “Regulations of Forest Felling” (table 3). The most important factors that need to be considered when making the decision are the dominant tree species, soil, mean height of stand, stocking level, mean diameter of trees (LRS, 2010). If the dominant tree species in the site is the Scots pine, the table of this tree (table 3) is the main tool that helps creating the cutting plan. The specifications are provided for two types of soil: slope and infertile, and others. Here is the example of how this table works: if the mean height of the stand is 11 m and the mean diameter is less than 12 cm, the stocking level after thinnings could be reduced to 0,7.
14
Table 3. Standards of thinning projection in pure Scots pine stands (source: LRS, 2010)
Mean height of first storey,
m
Stocking level after thinnings of the first storey by mean diameter of dominant species, cm
0,6 0,7 0,8 0,9
Scots pine– myrtillosum, vaccinio–myrtillosum, oxalidosum, myrtillo–oxalidosum et al.
5 <8 8 >8 6 <8 8 >8 7 <10 10 >10 8 <10 10 >10 9 <12 12 >12 10 <12 12 >12 11 <12 12 >12 12 <14 14 >14 13 <14 14 >14 14 <14 14 >14 15 <16 16 >16 16 <16 16 >16 17 <18 18 >18 18 <18 18 >18 19 <18 18 >18 20 <20 20 >20 21 <20 22 >22 22 <22 22 >22 23 <22 22 >22 24 <24 24 >24 25 <26 26 >26 26 <26 26 >26 27 <28 28 >28
The intensity of thinnings in pure stands is evaluated according to the requirements for the number of trees in the stand. The requirements for the Scots pine stands are provided in the table 4. The number of trees cannot be lower than it is legitimated in the regulations. The maximum error of 20 % is allowed. According to Pretzsch, this type of evaluation is mostly useful then the stand is of young age or in pre-commercial thinning phase when all the trees are of small dimensions and similar size; however, it is inaccurate when the stand develops and reaches relevant parameters. Basal area of stand could be more suitable tool for evaluation of real stand density (Pretzsch, 2009).
15
Table 4. Requirements for number of trees in pure Scots pine stand (source: LRS, 2010)
Mean height tree, m
Forest type cl, v m, v–m, ox, m–ox Number of trees, ha 6 3510 3670 7 3110 3250 8 2760 2890 9 2460 2580 10 2200 2320 11 1980 2090 12 1780 1890 13 1610 1720 14 1460 1570 15 1330 1430 16 1210 1310 17 1100 1200 18 1000 1110 19 910 1020 20 830 940 21 760 870 22 700 800 23 650 740 24 600 680 25 550 630 26 580 27 530 28 490
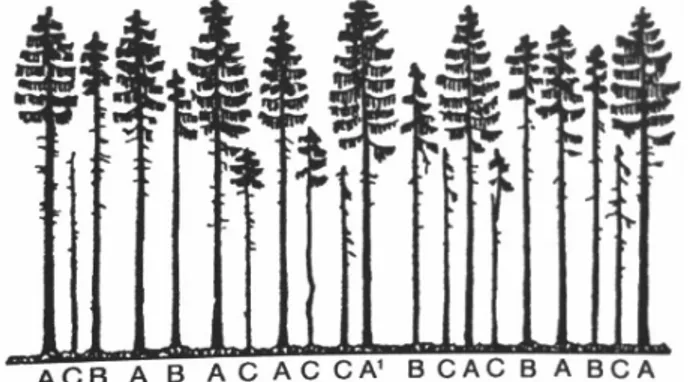
In Lithuania, the trees can be classified according to their quality. As it is shown in the figure 3, the healthiest trees with the biggest volume are in the group A or even A1 if their condition is extremely well. The trees with worse features are labelled B, and the weakest and smallest ones are in the group C.
Peculiarities of thinnings in Scots pine stands determine ecological properties of this species and, primarily, its demand of sunlight. Thinnings of this species in Lithuania are projected in all kinds of site conditions, except bogs and wetlands where pine grows very slowly because of poor soil. The
16
first commercial thinning is done in the stands with 0,8 and / or bigger stocking level (table 2). The main purpose of the first thinning is to create optimal growing conditions for the A-class (figure 3) healthy trees with straight stem, well developed crown. All non productive trees of B and C classes are removed as well as damaged or crocked stem. What is more, the trees of the A1-class are also eliminated as they are too dominant and worsen the growing conditions of other trees. The stocking level after the first commercial thinning is usually reduced to 0,7 (Juodvalkis et al. 2011).
Figure 3. Classes of trees in Lithuania (source: Juodvalkis and Kairiūkštis, 2009)
Following recommendations, irrespective of the forest type, the second commercial thinning is done in Scots pine stands with 0,9 and bigger stocking level. This thinning should be less intensive than the first one. After all the thinnings, only the A-class trees with stand stocking level around 0,8 should be left. Combined thinnings from below and above are done almost all over Lithuania (Juodvalkis and Kairiūkštis, 2009). Even though this practice is applied in Lithuania, several studies show that the thinning type does not have a statistically significant effect on total stem volume production for Scots pine (Nilsson et al., 2010). According to some critics, there is no big difference in the final result whether the thinning was done from above, below or combined.
According to the records of stand-wise forest inventory, during the period from 2006 to 2015, the first commercial thinning was done on 41 % of the area covered by stands of the first commercial thinning age in state forests. The figure for private forests was 5 %. The second commercial thinning was recorded on 8 % of the second commercial thinning stand area in state forests and on 10 % in private forests. The recommendations for 2016–2025 are of bigger percentage than it was reached during 2006–2015. The proposed commercial thinning sizes are the following: in state forests the first commercial thinning is suggested on the area making 52 % of the first commercial thinning age stand area (in private forests, 52 %). The second commercial thinning is suggested on the area making 21 % of the second commercial thinning age stand area (in private forests, 24 %) (Mozgeris et al., 2018).
17
2.3.2. Final felling
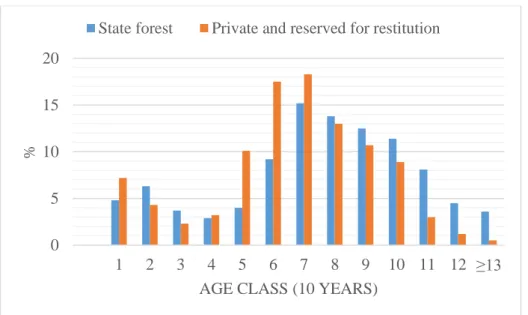
Based on legal acts, rotation period for Scots pine in Lithuania is 101 year for the IV group forest and even longer for other groups (LRS, 2010). The rotation period for Scots pine is defined by legal acts and is considered to be too long by forestry experts. There were several studies conducted suggesting differentiation of maturity age based on soil and site productivity properties (Brukas et al., 2001; Deltuvas et al., 2008). Practically, the rotation period in state forests is even longer due to the principles of estimating the annual cutting norm. These principles are not applied for private forests, yielding in relatively large areas of over-mature and high average age forests. Annual five-year cutting norm is calculated by the State Forest Service and must be accepted and validated by the Government. From 2019 to 2023 the norm is 11850 ha and it is bigger by 6 % than it was over the last five years (lrv.lt, 2018). In principle, the main issue is not with who calculates, but with the age class method “Optina” and the requirement to harvest resources of mature stands just in 15 years (Mozgeris et al., 2017). Therefore, not all stands which are older than 101 year can be felled. This leads to accumulation of mature forest stands, reduced timber quality and necessitating harvesting priorities on over-maturing forest. Private forests are usually cut after having reached the minimum rotation age. There are more than 20 % Scots pine stands that are over the minimum allowable rotation age (figure 4), especially in the forest owned by the state. Also, the huge amount of prematuring Scots pine forests planted after the WWII is reaching the final felling age (age class from 6 to 8 in figure 4) and it needs to be managed. The management application could lead to even bigger accumulation of mature stands what would increase economic loss.
Figure 4. Age class distribution of Scots pine stands in the IV forest group by different owners (source: SFS, 2017)
0 5 10 15 20 1 2 3 4 5 6 7 8 9 10 11 12 ≥13 %
AGE CLASS (10 YEARS)
18
2.4. National Forest Inventory
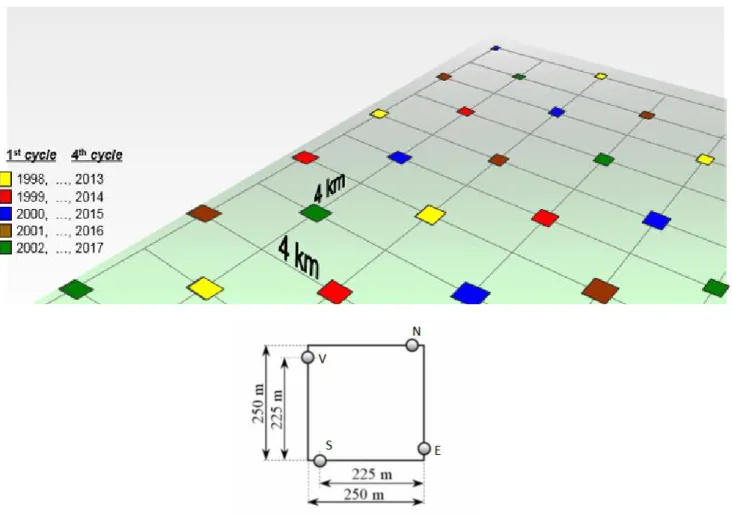
The National Forest Inventory (NFI) started in 1998 in Lithuania. It is based on permanent sample plots. A strictly systematic distribution pattern of permanent plots was applied in order to distribute those plots more evenly on the whole territory as well as regularly control transformation of other land categories and forest growth there. The location of the first permanent tract was determined randomly. The sample plots were grouped by four plots each (figure 5). Combining to Lithuanian coordination net, every group of permanent sample-plots was placed in every 4 km row and 4 km column by the principle of chess-board. One group of permanent sample plots represents 16 km2 of territory or 400 ha for one permanent plot. Measurements of permanent sample plots are done every five years (VMT, 2015).
Figure 5. Scheme of NFI measurement tracks and plots (source: SFSS, 2002)
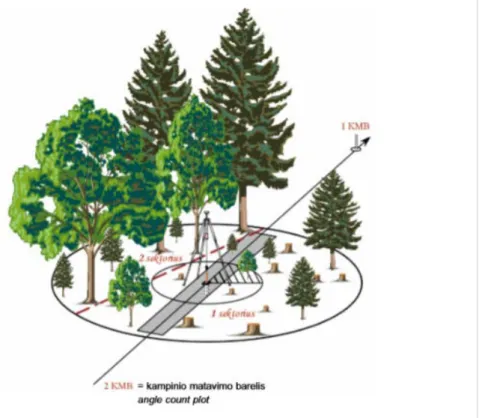
For each tree in a sample plot, tree species, competitive position, condition are registered and diameters at 1,3 m height are measured (figure 6). For sample trees, i. e. on average for 3–5 trees of dominant species and not less than 1–2 trees of any trees, heights and diameter at their butts are measured. Data from sample-trees is used to construct regression-functions of tree heights
19
dependence on diameter. With these functions, heights of all callipered trees are calculated. Each permanent first year sample plot represents 2000 ha, second year – 1000 ha, third year – 666 ha, fourth year – 500, and fifth year – 400 (Kuliešis et al., 2008). Succession of trees in permanent sample plot never ends: some of trees are cut, die or degrade naturally. When other trees reach proper parameters, it is started to be measure them. This process assures uninterrupted observation of trees. Measurements are done when the tree is felled down or fully disappears in litter.
20
3. MATERIAL AND METHODS
Figure 7 illustrates the methodology of this thesis. Four main steps were taken in order to make the conclusions. Firstly, the data was collected from the NFI. Then it was systemized to a database that would be possible to work with. Furthermore, calculations were made according to distinguished objectives. The intensity of thinnings was calculated with the programme “R Studio”. The alternative management models were simulated with the programme “Heureka”. Finally, Net Present Value (NPV) and Land Expectation Value (LEV) were calculated. Each of these steps are described in detail in this section.
Figure 7. Scheme of methodology part with the sequence of work done
3.1. Data collection
The data used in this thesis was collected from the NFI. The figures were taken from the period from 1998, when the NFI began in Lithuania, until 2017. This means, that the data includes the information
Intensity of thinnings Calculations with "R Studio" Alternative managament models Simulation with "Heureka" NPV and LEV calculations Data collection Data frame Objectives
21
from five fully completed 5-year periods. In total, the data consisted of 35 687 lines of records with information about permanent NFI sample plots.
In NFI database, the information on more than 100 different forest parameters within a sample plot are saved (table 5; annex 1). All of it may be analysed in various ways to get different information about Lithuanian forest, i. e. the height structure of different tree species, distribution of age, cutting volume etc.
Table 5. Stand parameters in NFI data (source: SFSS, 2002)
Dimensions of plants State of plants Area characteristics
Trees Diameter 1,3 m Height Length of crown Age Volume V=f(D,H,FDH) Increment ZV=f(VA,VA-n) Understorey Height Age Underbrush Height Species Storey Growing Dead Removed Quality class Damages Type Cause Position Intensity Defoliation Ownership Land use category
Protective status (forest group, subgroup) Administrative region Site type Forest type Age class Site index HAB DAB Stocking level Species composition 3.2. Data frame
To reach the objectives of examining the intensity of thinnings in Scots pine stands and alternative management models in Lithuania, a subset of plots were selected. Criteria for plots to be included were:
1. Pure Scots pine plots (80 % or more of Scots pine); 2. Group IV (commercial forest);
3. The plot area larger than 400 m2; 4. Some cuttings must be done.
From the total data, 576 permanent sample plots were chosen following the four criteria mentioned above. 237 of those sample plots were from the period 1998–2002, 68 sample plots from 2003–2007,
22
123 sample plots from 2008–2012, and 148 sample plots from 2013–2017 period. Four groups of data from four different five-year periods were prepared for further calculations.
3.3. Intensity of thinnings
To assess the intensity of thinnings in Lithuanian pine forests calculations with the collected data were done using the programme “R Studio”. It is a software designed for statistical computing using R programming language. The most important parameters for the calculations were the following:
1. Identification number;
2. Mean height of dominant species; 3. Volume of the 1st and the 2nd storeys;
4. Harvested volume (the 1st storey; the 2nd storey; living trees; dead trees). To calculate the value of interest, the following formulas have been used:
Volume after harvesting:
𝑉𝑉𝑎𝑎ℎ = 𝑉𝑉1+ 𝑉𝑉2;
where: 𝑉𝑉1 – volume of 1st storey (m3/ha); 𝑉𝑉2 – volume of 2nd storey (m3/ha).
Harvested volume of living and dead trees:
𝑉𝑉ℎ= 𝑉𝑉ℎ1+ 𝑉𝑉ℎ2+ 𝑉𝑉𝑑𝑑ℎ1+ 𝑉𝑉𝑑𝑑ℎ2;
where: 𝑉𝑉ℎ1; 𝑉𝑉ℎ2 – harvested volume of living trees 1st and 2nd storey (m3/ha); 𝑉𝑉𝑑𝑑ℎ1; 𝑉𝑉𝑑𝑑ℎ2 – harvested volume of dead trees 1st and 2nd storey (m3/ha).
Volume before harvesting:
𝑉𝑉𝑏𝑏ℎ= 𝑉𝑉𝑎𝑎ℎ+ 𝑉𝑉ℎ.
The calculated data was used to draw a graph illustrating the intensity of thinnings in Scots pine forest (figure 8). The thinnings were differentiated depending on the forest owner (either state or private) which allowed to compare the thinning models by ownership.
23
3.4. Alternative management models
The alternative management models were simulated with the “Heureka” software. For continuous simulation five representative plots were chosen from the NFI data including common heights and volumes. The economic analysis was meant to calculate the optimal rotation length for different representative stands in Scots pine stands in Lithuania. The calculation of rotation length was based on pure economic calculations of the Net Present Value (NPV) and the Land Expectation Value (LEV).
Table 6. Stands selected for economic analysis
Number of the plot
Name Age Basal
Area
Diameter Height Site
Index Number of stems Volume 1 A 30 29 16,3 16 32 1500 192 2 B 40 28 17,9 19,4 32 1188 253 3 C 60 28 18,5 20,7 28 1100 268,6 4 D 75 45 23 23 25 1100 463 5 E 75 35 30 31 35 500 477
3.4.1. Simulation with “Heureka”
To create the simulations (the examples of work can be found in annexes 2–11), programme “Heureka” has been chosen. It is a free-accessible software developed by Swedish University of Agricultural Sciences (SLU). The system is designed to process the information related to forestry – from forest inventory data processing to choosing alternatives through multi-criteria decision support methods. It is for both, tasks related to timber management and other ecosystem service’s problem solving (Heureka, 2019). Heureka has various modules, such as “PlanWise”, “StandWise”, “RegWise”, “PlanEval”. The “StandWise” module was chosen for this thesis, because it makes stand level analysis. The aim of this module is to evaluate specific management options and study growth, revenues, costs, and forest development for single stands.
Despite the differences in forestry of Lithuania and Sweden, a variety of “Heureka” tools can be applied in Lithuania. While creating the simulations for this project, the settings of forest management model of a region in Sweden that matches the conditions of Lithuania in a maximum level were chosen.
24
For creating the simulations with the “Heureka” software, default values for cost of harvesting and income at thinnings and final felling were used. Prices for different diameter and quality saw logs and proportion in various quality classes were set as default values in “Heureka” (table 7). For all plots, three different thinning models were tested: 15 % removal, 35 % removal and no thinning. In addition, Lithuanian thinning recommendations were used to mimic thinning model for one stand (annex 5).
Table 7. Prices of timber in “Heureka” software (source: Heureka)
3.4.2. Net Present Value and Land Expectation Value calculations
For the economic calculations, an interest rate (IR) of 2% was used, following Brukas et al. (2001) studies related to Lithuanian economy. An IR-sensitivity analysis was done in one stand where interest rates of 1 %, 2 %, 3 %, 4 %, and 5 % were tested.
The Net Present Value is outlined as the sum of present value of the revenues minus the sum of the present value of the costs (Lawrence, 2001).
𝑁𝑁𝑁𝑁𝑉𝑉 = �(1 + 𝑖𝑖)𝑅𝑅𝑡𝑡 𝑡𝑡− �(1 + 𝑖𝑖)𝐶𝐶𝑡𝑡 𝑡𝑡 𝑛𝑛 𝑡𝑡=0 𝑛𝑛 𝑡𝑡=1 DIAMETER CLASS PRICE EUR/M3
Quality 1 Quality 2 Quality 3 Quality 4
13 30 30 30 30 14 41,5 41,5 36,5 32,5 16 44 44 39 32,5 18 47,5 47,5 42,5 34 20 57,5 48,5 46 34 22 62,5 48,5 48,5 34 24 67,5 50 50 34 26 70 52,5 52,5 34 28 72,5 54,5 54,5 36,5 30 75 56,5 56,5 36,5 32 75 57 57 36,5 34 75 57,5 57,5 36,5 36 70 47,5 47,5 30
25 where Rt = revenue in period t
Ct = cost in period t
t = period length i = interest rate
n = number of planning periods.
In 1849, a German forester Martin Faustmann created the formula to count what is the maximum an investor could pay for bare land and still earn the minimum acceptable rate of return. The Faustmann formula is a stand-level economic decision model that was originally conceived for pure even aged stands (Heshmatol Vaezin, 2009). Calculations using this formula help us estimate economically optimal rotation age, because the most profitable choice is assumed to correspond to the highest Land Expectation Value (Lawrence, 2001).
Land Expectation Value is a net present value designed for bare forestland – the present value of future revenues minus the present value of future costs, calculating just before the appearance of a new forest (Klemperer, 1996).
𝐿𝐿𝐿𝐿𝑉𝑉 =𝑁𝑁𝑁𝑁𝑉𝑉(1 + 𝑖𝑖)1(1 + 𝑖𝑖)𝑡𝑡− 1𝑡𝑡
where NPV1 = net present value of 1 full rotation t = period length
i = interest rate.
Since the costs of regeneration and net income in previous thinnings were unknown, it was assumed that the NPV from thinnings was equal to the costs of regeneration and the sum NPV at the beginning of the calculation was zero.
26
4. RESULTS
4.1. Thinning intensity
Thinning intensity increases with height of the trees (Fig 8). The majority of thinnings were done between 19 and 25 meters of height. The volume of the stand before thinning was around 200 m3/ha in the stands lower than 20 m. The mean volume before thinning the stands of 20–25 m height was 300 m3/ha and stands higher than 25 m contained about 400 m3/ha. Surprisingly, the volume of some of the stands was even more than 600 m3/ha. The illustrated thinning intensity by different heights meets the legal thinning recommendations of Lithuania. The green line of the graph shows the upper limit where the stock level is 1,0. All the stands above this line need to be thinned. The blue line shows the lower limit of stocking level which could be reached after thinning. There are some stands that are out of the range.
A large proportion of thinnings in Scots pine stands in Lithuania were light or very light intensity thinnings in different height classes (Fig. 8). The removal grade was less than 10 % of 60 % of the stands. In more than 40 % of the thinnings, average height was above 25 meters (figure 9). The average tree height for thinnings was 23 meters. 60 % of the thinnings were done when the trees were between 21 and 27 meters in mean height. Thinnings in stands higher than 25 meters had the variation of volume from 150 to 600 cubic meters before and after cutting (Fig 8).
27
Figure 8. Thinnings in Scots pine stands in Lithuania. Each red and black lines represent the removal of volume (m3/ha) from stand, respectively, of living and dead trees. Green and blue lines represent stocking level of stands.
Yellow circles show the area that has been chosen as a representative stand for the economic analysis
Figure 9. Number of thinnings in different height classes
The most common thinning grade was 3 %. The frequency of thinnings constantly decreased as the thinning grade increased. When the thinning grade was 27 %, the frequency became stable – around 10 for each ownership. Only a few plots were thinned with thinning grade above 33 %. The maximum
0 20 40 60 80 100 120 11 13 15 17 19 21 23 25 27 29 31 33 F req u en cy Height, m
28
thinning grade was 63 %. The proportion of light thinnings was higher in state forests than in private forests ((Fig 10)
Figure 10. Thinning intensity by frequency of different owners from NFI data period 1998–2017
4.2. Economic analysis
All the simulations show that unthinned stands reach maximum NPV + LEV earlier than the thinned ones. With increasing thinning grade, the rotation age also gets longer. In young stands (A; B), there is no noticeable difference for the best rotation age between light thinning (15 %) and unthinned control; 35 % thinning grade increases the rotation length by 5 years. Thinning in young stands increases the NPV only slightly. For the stand of 21 m height and 270 m3 volume (C), the best rotation age without thinnings is 80 years. Light thinnings extend the rotation length to 85 years, heavy thinning extends it to 90 years. Older stands with big volume (D; E) have already passed the best rotation age for unthinned stand. Light and heavy thinnings increase the rotation length, respectively, by 5 and 15 years. Earlier commercial thinning allows to achieve the biggest NPV value for rotation at a younger age. 0 20 40 60 80 100 120 140 160 3 9 15 21 27 33 39 45 51 63 F req u en cy Thinning grade, % State Private
29
Figure 11. Value of NPV (€/ha) of different thinning intensity in different age for representative stands
When using the Faustmann formula to calculate the LEV, the interest rate must be chosen. Differences between NPV and optimal rotation age are significant if the interest rate varies (Table 8). The NPV is inversely proportional to the interest rate – when the first one increases, the second one decreases. The best optimal rotation age also increases when interest rate decreases (Table 8).
Unthinned stands have the biggest NPV among all the thinning models with 2 %, 4 % and 5 % interest rate. Light thinnings (15%) have the biggest NPV when the interest rate is 1 % and 3 %. The MIMIC thinnings have the lowest NPV. It is lower by 3,5 %, 8 %, 15 %, 24 %, and 31 %, when the interest
30
rate is, respectively, 1–5 % compared to heavy thinnings. Despite that, the rotation length for MIMIC is from 30 to 55 years longer than the best economical rotation age.
The best optimal rotation age is the same for three different thinning models with the interest rate of 2 %, 3 % and 4 %. With interest rate of 1 %, an unthinned stand has 5-year lower rotation age, and with the interest rate of 5 %, a light thinning has a rotation age longer by 5 years.
Table 8. NPV and best optimal rotation age using different interest rates. All calculations have been done with stand A. MIMIC* – thinnings that have been made when stocking reached 1,0 following the thinning recommendations (30 % of the thinnings at the age of 30, 40, 55, 75 years)
Thinning model Interest rate 1% 2% 3% 4% 5% NPV Rot. Age NPV Rot. Age NPV Rot. Age NPV Rot. Age NPV Rot. Age 0% 23 558 65 11 280 60 7 135 55 5 288 50 4 187 45 15% 23 656 70 11 130 60 7 206 55 5 269 50 4 184 50 35% 22 792 70 10 669 60 6 857 55 5 065 50 4 092 45 MIMIC* 21 990 101 9 802 101 5 775 101 3 856 101 2 794 101
31
5. DISCUSSION
5.1. Thinnings
Intermediate cuttings are as important as final-fellings, managing them is essential for future development of stands. It is announced more and more frequently about the damage in the forests done by the climate change. Snow and especially storm damage appear to have increased in Europe during recent decades. Climate change leads to a higher frequency of heavy storms, so more widespread damage in forest systems can be expected if stands are not managed to reduce their vulnerability (Schelhaas et al., 2003; Gardiner et al., 2012). Even though Scots pine is resistant to natural disturbances, it is constantly damaged because pine forests have a large proportion of all stands. To avoid or at least reduce this in the future, it is important to carry out the initial thinning at a young stand age or apply pre-commercial thinning to improve tree stability right from the early development stages.
One of the most important tree attributes for stability is tree height (del Rio et al., 2017). Therefore, thinnings in old and high stands increase vulnerability. In Lithuania, the most common are light thinnings which reduce the risk of windthrow and snow damage. However, as these thinnings are of lower intensity they need to be done more often. This leads to a bigger probability of mechanical tree injuries made by heavy harvest-machines. Also, frequent movement of machinery puts a lot of pressure on the soil and ground vegetation. In addition, light thinnings are unbeneficial economically as the price of the cutting is rather high compared to the income gained. Thus, it would be useful to avoid light thinnings and carry out the intensive ones that would be done in an earlier age.
The average diameter of the final Scots pine stand is increased by thinning. There have been several studies carried out that show similar results (Mäkinen and Isomäki, 2004; Nilsson et al., 2011). One of the aims of the “Regulations of forest felling” in Lithuania is to increase the dimensions and sortiments structure of timber. This purpose is fulfilled by thinning. Firstly, the average diameter increases when the smallest trees from the stands are removed. Secondly, diameter annual increment is increased by thinnings. The net income from a tree depends on its size. The economically optimal rotations are shorter if the price premium for large-diameter saw logs is low (Roberge, 2016). Moreover, nowadays sawmills do not want big diameter logs for their production. Pricelist of one of the sawmills called “Storaenso” shows that Scots pine saw logs with diameter 20–25 cm on the bottom part have the same price as 26–40 cm saw logs (Storaenso, 2019). Naturally, modern wood industry always looks for better alternatives than solid wood. I. e. builders more and more often use glued
32
wood constructions which are firmer by 50–70 % than the structures made from whole trees (Raftery and Harte, 2011). To produce this product large dimension saw logs are not needed.
5.2. Rotation age
Rotation age has an impact on various ecosystem services. These services are essential for humanity as they lead to production of oxygen, water detoxification and soil formation (Mizaras et al., 2013). One of those services is cultural ecosystem service as forest management directly affects aesthetical and recreational values. Even though people often have different preferences, the tendency in Lithuania is clear a forest stand’s attractiveness for recreational activities generally increases with the size of the trees, and consequently old forests are usually preferred to young stands (Juodvalkis and Kairiūkštis, 2009). This means, shortened rotations would impact aesthetic and recreational values negatively due to larger landscape-scale proportions of clear-cuts and dense young stands at the expense of old forest, while extended rotations should have positive effects (Curtis, 1997). From increased activeness in the social media and civil movements to protect the trees from cutting, it becomes clear that society sees the bigger changes in the forest as a threat. This distinguishes the positive aspects of current thinning intensity, because Scots pines are grown for a long period. On the other hand, high levels of green-tree retention may alleviate to some extent the negative aesthetic impacts of more frequent clearcutting under shortened rotations (Ribe, 2005). In this case, clear-cuts would still have many big and old trees for retention. The other solution is to carry out the clear-cuts in the areas that are rarely visited by people.
Other ecosystem services could also be affected by rotation age. Carbon sequestration is a very important process for combating climate change. Climate change mitigation becomes an additional concern to be considered in silvicultural decisions. Current Scots pine forest management is inducing carbon sequestration. Carbon stock level is very high in Scots pine stands which grow up to 101 year and even longer. On the other hand, by reducing rotation length we would not have major losses on carbon sequestration because the effect would only be felt during the transitory period. According to Lundmark et al. (2018), the climate benefit would only be temporary as it is restricted to the first new rotation with the increased rotation length (above 85 for Scots pine) due to the increased standing forest carbon stock being conjugated to a permanently lowered yield.
The rotation length can also influence the biodiversity. Even though Scots pine forests are not very rich in variety of different species compared to broadleaves, they still maintain a unique fauna and flora (Kuliešis, 2008). Scientists have different opinions about biodiversity conservation’s
33
dependence on different rotation lengths. Some state that only old forest supports microhabitats that are rare or absent in younger forest and critical to large numbers of red-listed forest species (Bernes, 2011). In addition to that, shorter rotations imply more frequent clear felling and soil scarification events, which typically result in the destruction of a large proportion of the dead wood (Hautala et al., 2004). According to others, shorter rotation would not violate biodiversity. Shortened rotation lengths increase the frequency at which lost retention trees are replaced. As such, retention practices can reduce the impact of shortening rotation lengths on the availability of some types of habitat (Felton et al., 2017). From the economical point of view, the main purpose of the IV forest group is to grow as much quality timber as possible. Evaluating only this, forest with red-listed species be set aside for protection and the rest of commercial forest should be economically productive.
5.3. Critical approach
When only economic factors are taken into consideration, other relevant ecosystem services are often neglected. Because of long forest rotation period a lot of factors must be considered when economic indicators are calculated. Various circumstances, such as disturbances or market fluctuations, are difficult to foresee; this means, that the calculations can mismatch in the future. Economic calculations are very sensitive to the change of the interest rate. It is important to take this into account, thus very difficult to anticipate because of the rotation length. As it was noted in the this thesis, the economic rotation age can vary as much as 25 years. Similar tendency was also noticed in the research of V. Brukas et al. (2001).
After evaluating the results (figure 8), it would be incorrect to state that the NFI data can precisely describe the features of forest management in Lithuania. The area of permanent sample plots is 500 m2, so the parameters of each measured tree can make a huge impact on the final results. The fact that there have been no records of the type of implemented cuttings in the NFI data leads to assumption that very heavy thinnings (figure 8) at high trees could represent the shelter wood management system. More studies need to be carried out to figure out whether it is proper to rely on the NFI data to make the conclusions about forest management.
34
6. CONCLUSIONS
After analysing the intensity of thinnings in Scots pine stands in Lithuania according to the NFI data, it was concluded that too many light and very light thinnings are done. Cuttings of this kind are less profitable than optimal thinning regimes and increase the risk of mechanical damage.
In Lithuania, thinnings are carried out in Scots pine stands of large heights. More than half of all the thinnings are done in stands of 23 m and higher. Thinnings in stands of this height increase the risk of windthrow and this can cause economic and forest sustainability losses.
Heavy thinnings in Scots pine stands increases the rotation length in which the biggest profit is gained. Light thinnings carried out in young stands have no impact on the rotation age. To maximize the economic profitability, older stands should rather be final felled than thinned.
With the rotation length, which is set now in Lithuania, the forestry sector loses additional income. It would be more profitable to grow the Scots pine stands of shorter rotation age. However, the current rotation length is probably positive for other ecosystem services such as recreational values and for biodiversity conservation.
35
7. ACKNOWLEDGEMENTS
I would like to kindly thank my supervisors Urban Nilsson (Swedish University of Agricultural Sciences) and Gintautas Mozgeris (Vytautas Magnus University) for the great help during the realization of the research and leading me the right way. Also, I would like to thank the examiner of this work Adam Felton (Swedish University of Agricultural Sciences) whose critical overview and effort lead to a better final version of this thesis. Finally, I feel really grateful for all the people who supported me during this responsible period.
36
8. REFERENCE
1. Bernes, C. 2011. Biodiversity in Sweden. Stockholm: Swedish Environmental Protection Agency.
2. Brukas, V., Thorsen, B.J., Helles, F. & Tarp, P. 2001. Discount rate and harvest policy : implications for Baltic forestry. Forest policy and economics. Volume: 2 Number: 2, 143-156 pp.
3. Curtis, R.O. 1997. The role of extended rotations. In Creating a forestry for the 21st century, ed. K.A. Kohm, and J.F. Franklin, 165–170 pp. Washington: Island Press.
4. del Río, M., Bravo-Oviedo, A.,Pretzsch, H.,Löf, M.,and Ruíz-Peinado, R. 2017. A review of thinning effects on Scots pine stands: From growth and yield to new challenges under global change. Forest Systems. 26 (2), eR03S, 19 pages (2017) eISSN: 2171-9845
https://doi.org/10.5424/fs/2017262-11325
5. Deltuvas, R 2008. Miškonaudos teoriniai pagrindai [Princples of forest use], In: Mažeika, JA (Ed.), Miško naudojimas ir logistika [Forest use and logistics], Lietuvos žemės ūkio universitetas, 11-98 pp. [in Lithuanian]
6. ENFIN: European National Forest Inventory Network, 2019. [http://enfin.info]. Accessed March 07, 2019.
7. EUFORGEN. European Forest Genetic Resources Programme. 2019. [image online], [http://www.euforgen.org/species/pinus-sylvestris/]. Accessed April 03, 2019.
8. Felton, A., Sonesson, J., Nilsson, U., Lamas, T., Lundmark, T., Nordin, A., Ranius, T., Roberge J.M. 2017. Varying rotation lengths in northern production forests: Implications for habitats provided by retention and production trees. Ambio, DOI 10.1007/s13280-017-0909-7
9. Gardiner B, Shuck A, Schelhaas MJ, Orazio C, Blennow K, Nicoll B (Eds.), 2012. Living with storm damage to forests: What science can tell us. Eur Forest Inst Joensuu, Finland, 129 pp.
10. Hautala, H., J. Jalonen, S. Laaka-Lindberg, and I. Vanha-Majamaa. 2004. Impacts of retention felling on coarse woody debris (CWD) in mature boreal spruce forests in Finland. Biodiversity and Conservation 13: 1541–1554 pp.
11. Heureka. Introduction, 2019.
[https://www.heurekaslu.se//help/en/index.html?standwise.htm]. Accesed March 13, 2019. 12. Heshmatol Vaezin, S.M., Peyron, J.-L., and Lecocq, F. 2009. A simple generalization of the
37
13. Juodvalkis A. 2003. Kai kurie medynų produktyvumą ir stabilumą lemiantys faktoriai [Some of the factors influencing the productivity and stability of stands]. Miškininkystė, nr. 2. 30–47 pp. [in Lithuanian]
14. Juodvalkis, A., Kairiūkštis, L. 2009. Medynų formavimas ir kirtimai [Shaping of stand and cuttings]. Lututė, Kaunas. 224 pp.
15. Juodvalkis, A., Karazija, S., Mikšys, V. 2011. Miško kirtimų rekomendacijos [Recommendations for forest cutting], Ministry of environment of the Republic of Lithuania, 100 pp. [in Lithuanian]
16. Klemperer, W. David. 1996. Forest resource economics and finance. 551 pp. 17. Kairiūkštis, L., Juodvalkis, A. 1979. Miškininkystė[Forestry] Vilnius
18. Kuliešis A. 2008. Miško naudojimas ir logistika [Usage and logistics of forest]. Akademija. [in Lithuanian]
19. Lawrence, S. D., Norman Johnson K., Bettinger, P., E. Howard, T. 2001. Forest
Management: To Sustain Ecological, Economic, and Social Value. Long Grove, Illinois. 804 pp.
20. LRS (Lietuvos Respublikos Seimas). 2010. [Seimas of the Republic of Lithuania].Miško kirtimo taisyklės. [Regulations for forest fellings].Lietuvos Respublikos Seimas: 2010-01-27, Nr.D1-79. Valstybės žinios: 2010-02-03, Nr.14-676.
21. Lrv.lt: Patvirtinta metinė pagrindinių miško kirtimų norma [Approved annual forest felling norm]. 2018. [http://lrv.lt/lt/naujienos/patvirtinta-metine-pagrindiniu-misko-kirtimu-norma]. Accessed March 12, 2019. [in Lithuanian]
22. Lundmark, T., Poudel, B.C., Stål, G., Nordin, A., and Sonesson, J. 2018. Carbon balance in production forestry in relation to rotation length. Can. J. For. Res. 48: 672–678 pp.
dx.doi.org/10.1139/cjfr-2017-0410
23. Mizaras, S. 2012. Miškininkavimo ekonominė analizė [Economic analysis of forest management]. Aleksandro Stulginskio universitetas, Akademija. 112 pp. [in Lithuanian] 24. Mizaras, S., Kavaliauskas, M., Činga, G. 2013. Daugiafunkcinio miško vertinimas pajamų
kapitalizavimo metodu [Economic assessment of multifunctional forests using direct income capitalization approach]. ŽEMĖS ŪKIO MOKSLAI. 2013. T. 20. Nr. 2. 100–110 pp. [in Lithuanian]
25. Mozgeris, G., Petrauskas, E., Juknelienė, D., Danikauskas, T., Lekstutis, A., Palicinas, M., Stanislovaitis, A., 2017. Project development for a forest management and land use scenario modeling subsystem within the National forest inventory information system”, Final report. Research project is implemented following the conditions of the agreement between
38
Aleksandras Stulginskis University and State forest service No. 22 from 26-05-2016. 411 pp. [in Lithuanian]
26. Mozgeris, G.,Makrickienė, E.,Brukas V. and Palicinas M. 2018. Forest management models. Lithuania. Alterfor. [https://www.alterfor-project.eu/deliverables-and-milestones.html]. Accesed March 12, 2019.
27. Mäkinen H, Isomäki A. 2004. Thinning intensity and growth of Scots pine stands in Finland. Forest Ecology and Management 201; 311-325 pp.
28. Navasaitis M., Ozolinčius R., Smaliukas D., Balevičiūtė J. 2003. Lietuvos dondroflora [Dendroflora of Lithuania]. [in Lithuanian]
29. Nilsson, U., Agestam, E., Ekö, P-M., Elfving, B., Fahlvik, N., Johansson, U., Karlsson, K., Lundmark, T. and Wallentin, C., 2010. Thinning of Scots pine and Norway spruce
monocultures in Sweden – Effects of different thinning programmes on stand levelgross- and net stem volume production. Studia Forestalia Suecia 219. 46 pp. ISSN 0039-3150, ISBN 978-91-86197-76-6
30. Pretzsch, Hans. 2009. Forest Dynamics, Growth and Yield: From Measurements to Model. 664 p. 301 illus. Springer. ISBN 978-3-540-88306-7, 167 pp.
31. Płotkowski, L., Zając, S., Wysocka-Fijorek, E., Gruchała, A., Piekutin, J., Parzych, S. 2016. Economic optimization of the rotation age of stands. Folia Forestalia Polonica, Series A – Forestry, Vol. 58 (4), 188–197 pp.
32. Raftery, G. M., Harte, A. M. 2011. Low-grade glued laminated timber reinforced with FRP plate. Composites Part B: Engineering. Volume 42, Issue 4, June 2011, 724-735 pp.
33. Ribe, R.G. 2005. Aesthetic perceptions of green-tree retention harvests in vista views: The interaction of cut level, retention pattern and harvest shape. Landscape and Urban Planning 73: 277–293 pp.
34. Roberge, J.-M., Laudon, H., Björkman, C., Ranius, T., Sandström, C., Felton, A., Sténs, A., Nordin, A., Granström, A., Widemo, F., Bergh, J., Sonesson, J., Stenlid,J., and Lundmark,T. 2016. Socioecological implications of modifying rotation lengths in forestry. Ambio,
45(Suppl.2):109–123.doi:10.1007/s13280- 015-0747-4. PMID:26744047.
35. Schelhaas MJ, Nabuurs GJ, Schuck A, 2003. Natural disturbances in the European forests in the 19th and 20th centuries. Glob Chang Biol 9: 1620-1633. https://doi. org/10.1046/j.1365-2486.2003.00684.x
36. SFS: State Forest Service, Ministry of Environment. 2017. Lithuanian Statistical Yearbook of Forestry 2017. Lututė. Kaunas. 300 pp.
39
37. SFSS: Ministry of Environment State Forest Survey Service 2007. Lithuanian national forest inventory 2003-2007. Forest resources and their dynamic. Lututė, Kaunas. 284 pp. [in Lithuanian]
38. SFSS: Ministry of Environment State Forest Survey Service. 2002. Lithuanian national forest inventory 1998-2002. Sampling design, Methods, Results. Kaunas: Naujasis lankas, 256 pp.
39. Storaenso. 2019. Pricelist of sawlogs.
40. Valstybinė miškų tarnyba. Nacionalinė miškų inentorizacija. Atrankos metodas, 2015.[image online], [http://www.amvmt.lt/index.php/nacionaline-misku-inventorizacija2/apskaitos-bareliu-schema]. Accesed March 12, 2019.
40
9. ANNEXES
Annex 1. Formulas of height and volume in NFI data
The height of each tree is calculated by formula (SFSS, 2002):
ℎ𝑖𝑖𝑖𝑖 = 𝐻𝐻𝑖𝑖 ∙ 𝑅𝑅𝑖𝑖𝑖𝑖; (1.1)
where 𝐻𝐻𝑖𝑖 – mean height of trees of i species on the analysed storey of a sample plot,
𝐻𝐻𝑖𝑖 =𝐻𝐻𝑅𝑅𝑎𝑎𝑎𝑎𝑎𝑎𝑖𝑖 ; (1.2)
where 𝐻𝐻𝑎𝑎𝑖𝑖 – mean height of sample trees of i species,
𝑅𝑅𝑖𝑖𝑖𝑖 – reductional height value obtained from the dependence model of relative tree height on relative diameter (Kuliešis, 1993),
𝐻𝐻𝑎𝑎𝑖𝑖 =
∑𝑘𝑘𝑎𝑎𝑎𝑎𝑖𝑖=1ℎ𝑎𝑎𝑎𝑎∙𝑑𝑑𝑎𝑎𝑎𝑎𝑖𝑖2
∑𝑘𝑘𝑎𝑎𝑎𝑎𝑖𝑖=1𝑑𝑑𝑎𝑎𝑎𝑎𝑖𝑖2
; (1.3)
where ℎ𝑎𝑎𝑖𝑖, 𝑑𝑑𝑎𝑎𝑖𝑖 – height (m) and diameter (cm) of sample tress respectively, 𝑘𝑘𝑎𝑎𝑖𝑖 – number of sample trees of i spieces in a plot,
𝑅𝑅𝑖𝑖𝑖𝑖 = 𝑓𝑓�𝑑𝑑𝑖𝑖𝑖𝑖, 𝐷𝐷𝑖𝑖�; (1.4)
where 𝑑𝑑𝑖𝑖𝑖𝑖 - diameter of j tree at 1.3m height, cm for i tree species, 𝐷𝐷𝑖𝑖 – mean diameter of i species trees in a plot,
𝐷𝐷𝑖𝑖 = �∑𝑖𝑖=1𝑘𝑘𝑎𝑎 𝑑𝑑𝑎𝑎𝑖𝑖2
𝑘𝑘𝑎𝑎 ; (1.5)
where 𝑘𝑘𝑖𝑖 – number of i species trees in a plot. Then tree volume in a plot is:
𝑉𝑉𝑖𝑖𝑖𝑖 = 𝜋𝜋𝑑𝑑𝑎𝑎𝑖𝑖
2
4∙10000∙ ℎ𝑖𝑖𝑖𝑖 ∙ 𝐹𝐹ℎ𝑎𝑎𝑖𝑖𝑑𝑑𝑎𝑎𝑖𝑖; (1.6)
where 𝑑𝑑𝑖𝑖𝑖𝑖 – measured diameter of j tree of i species at 1.3m height, cm, ℎ𝑖𝑖𝑖𝑖 – height of the same tree estimated by 1.1 formula, m,
𝐹𝐹ℎ𝑎𝑎𝑖𝑖𝑑𝑑𝑎𝑎𝑖𝑖 – form factor of a tree derived from its dependence on tree height and diameter
41 A nne x 2 . H eu rek a s im ul a ti o n a nd c a lc ul a ti o n r es ul ts of s ta nd A t hi nne d by 35 % Re su lt ty pe Var iab le Un it Pe rio d 0 Pe rio d 1 Pe rio d 2 Pe rio d 3 Pe rio d 4 Pe rio d 5 Pe rio d 6 Pe rio d 7 Pe rio d 8 Pe rio d 9 Pe rio d 1 0 Pe rio d 1 1 Pe rio d 1 2 Pe rio d 1 3 Pe rio d 14 [ Fin an cial V alu e Gr os s R ev en ue SE K/ ha 13438 0 0 0 0 0 0 0 0 0 0 0 0 0 287333 Fin an cial V alu e Net R ev en ue SE K/ ha 4652 26739 44961 67193 89011 111461 131741 151721 169771 187294 202933 216939 231242 243002 254326 Fin an cial V alu e To tal C os t SE K/ ha 8786 0 0 0 0 0 0 0 0 0 0 0 0 0 33007 Fo re st D ata Bas al ar ea ( in cl o ve rs to re y) Af te r m 2/ ha 18, 85 24, 3515 29, 9763 34, 945 39, 3653 43, 2831 46, 6788 49, 521 52, 0066 54, 1477 55, 9681 57, 5073 58, 8023 59, 8923 0 Fo re st D ata Bas al ar ea ( in cl o ve rs to re y) B ef or e m 2/ ha 29 24, 3515 29, 9763 34, 945 39, 3653 43, 2831 46, 6788 49, 521 52, 0066 54, 1477 55, 9681 57, 5073 58, 8023 59, 8923 60, 8118 Fo re st D ata Dgv A fte r cm 16, 6 19 21, 2 23, 1 24, 8 26, 3 27, 7 28, 9 30, 1 31, 2 32, 3 33, 4 34, 4 35, 4 0 Fo re st D ata Dgv B ef or e cm 16, 3 19 21, 2 23, 1 24, 8 26, 3 27, 7 28, 9 30, 1 31, 2 32, 3 33, 4 34, 4 35, 4 36, 3 Fo re st D ata Do m in an tH eig ht B ef or e m 14, 1 16, 49 18, 54 20, 35 21, 93 23, 32 24, 52 25, 56 26, 47 27, 25 27, 94 28, 54 29, 07 29, 53 29, 94 Fo re st D ata Hg v A fte r m 13, 1 15, 4 17, 4 19, 2 20, 8 22, 1 23, 3 24, 3 25, 2 26 26, 7 27, 3 27, 8 28, 3 0 Fo re st D ata Hg v B ef or e m 13 15, 4 17, 4 19, 2 20, 8 22, 1 23, 3 24, 3 25, 2 26 26, 7 27, 3 27, 8 28, 3 28, 7 Fo re st D ata M ea n A ge ( ex cl o ver st or ey ) B ef or e yr s 30 35, 1 40, 1 45, 2 50, 2 55, 2 60, 2 65, 1 70, 1 75, 1 80, 1 85, 1 90 95 99, 9 Fo re st D ata SIH (es tim at ed ) B ef or e m 29, 08 29, 13 29, 17 29, 2 29, 23 29, 25 29, 26 29, 27 29, 28 29, 29 29, 29 29, 3 29, 3 29, 3 29, 31 Fo re st D ata SIS (p ro jec ted ) B ef or e H100 m 32 32 32 32 32 32 32 32 32 32 32 32 32 32 32 Fo re st D ata St an d A ge B ef or e yr s 30 35 40 45 50 55 60 65 70 75 80 85 90 95 100 Fo re st D ata St em s A fter Tr ees /h a 925, 4 914, 3 904, 5 888, 3 870, 6 872, 4 868, 7 860, 1 847, 6 831, 7 813, 2 797 779, 2 760, 6 6146, 3 Fo re st D ata St ems B ef ore Tr ees /h a 1500 914, 3 904, 5 888, 3 870, 6 872, 4 868, 7 860, 1 847, 6 831, 7 813, 2 797 779, 2 760, 6 741, 6 Fo re st D ata Vo lu m e ( in cl o ver st or ey ) A fter m 3s k/ ha 125, 5 185, 4 253, 1 320, 3 385, 4 446, 8 503, 2 553, 4 598, 8 639, 4 675, 1 706, 3 733, 4 756, 9 0, 5 Fo re st D ata Vo lu me (i nc l o ve rs to re y) B ef ore m 3s k/ ha 192 185, 4 253, 1 320, 3 385, 4 446, 8 503, 2 553, 4 598, 8 639, 4 675, 1 706, 3 733, 4 756, 9 777, 2 Tre at me nt s Vo lu m e H ar ve st ed All S pe cie s m ³s k/ ha 66, 5111 0 0 0 0 0 0 0 0 0 0 0 0 0 776, 1892 NPV EU R/ ha 465 2422 3688 4993 5990 6794 7273 7586 7689 7683 7540 7300 7048 6708 6359 SU M NPV EU R/ ha 2887 4154 5458 6455 7259 7738 8052 8154 8148 8005 7765 7513 7173 6824 KO EF 2, 23 2, 00 1, 83 1, 70 1, 59 1, 51 1, 44 1, 38 1, 33 1, 29 1, 26 1, 23 1, 20 1, 18 1, 16 Ro ta tio n N PV EU R/ ha 257 1594 2293 3013 3564 4008 4272 4445 4502 4498 4419 4287 4148 3960 3767 LE V EU R/ ha 3188 4191 5109 5671 6040 6145 6140 6002 5815 5559 5265 4987 4672 4371 NPV+ LE V EU R/ ha 5774 7592 9253 10272 10941 11131 11122 10872 10533 10070 9537 9033 8463 7917 Thi nning int ens ity 35 %
42 A nne x 3 . H eur ek a s im ul a ti o n a nd c a lc ul a ti o n r es ul ts of s ta nd A t hi nne d by 1 5 % Re su lt ty pe Var iab le Un it Pe rio d 0 Pe rio d 1 Pe rio d 2 Pe rio d 3 Pe rio d 4 Pe rio d 5 Pe rio d 6 Pe rio d 7 Pe rio d 8 Pe rio d 9 Pe rio d 1 0 Pe rio d 1 1 Pe rio d 1 2 Pe rio d 1 3 Pe rio d 14 [ Fin an cial V alu e Gr os s R ev en ue SE K/ ha 5574 0 0 0 0 0 0 0 0 0 0 0 0 0 286150 Fin an cial V alu e Net R ev en ue SE K/ ha 1235 35852 52349 74805 96864 117414 139811 157194 173162 190428 204008 219463 231939 242746 252333 Fin an cial V alu e To tal C os t SE K/ ha 4340 0 0 0 0 0 0 0 0 0 0 0 0 0 33817 Fo re st D ata Bas al ar ea ( in cl o ve rs to re y) Af te r m 2/ ha 24, 65 30, 3115 35, 9561 40, 7539 44, 872 48, 3542 51, 2242 53, 4049 55, 2388 56, 7817 58, 0828 59, 1893 60, 1356 60, 9478 0 Fo re st D ata Bas al ar ea ( in cl o ve rs to re y) B ef or e m 2/ ha 29 30, 3115 35, 9561 40, 7539 44, 872 48, 3542 51, 2242 53, 4049 55, 2388 56, 7817 58, 0828 59, 1893 60, 1356 60, 9478 61, 6503 Fo re st D ata Dgv A fte r cm 16, 5 18, 5 20, 3 22 23, 5 24, 9 26, 2 27, 4 28, 6 29, 7 30, 7 31, 8 32, 8 33, 8 0 Fo re st D ata Dgv B ef or e cm 16, 3 18, 5 20, 3 22 23, 5 24, 9 26, 2 27, 4 28, 6 29, 7 30, 7 31, 8 32, 8 33, 8 34, 7 Fo re st D ata Do m in an tH eig ht B ef or e m 14, 1 16, 54 18, 63 20, 46 22, 06 23, 45 24, 65 25, 7 26, 61 27, 4 28, 09 28, 69 29, 22 29, 68 30, 08 Fo re st D ata Hg v A fte r m 13, 1 15, 4 17, 4 19, 2 20, 7 22, 1 23, 3 24, 3 25, 2 26 26, 7 27, 3 27, 9 28, 4 0 Fo re st D ata Hg v B ef or e m 13 15, 4 17, 4 19, 2 20, 7 22, 1 23, 3 24, 3 25, 2 26 26, 7 27, 3 27, 9 28, 4 28, 8 Fo re st D ata M ea n A ge ( ex cl o ver st or ey ) B ef or e yr s 30 35, 1 40, 1 45, 2 50, 2 55, 2 60, 2 65, 2 70, 2 75, 2 80, 2 85, 2 90, 2 95, 1 100, 1 Fo re st D ata SIH (es tim at ed ) B ef or e m 29, 08 29, 14 29, 19 29, 22 29, 24 29, 26 29, 28 29, 29 29, 29 29, 3 29, 3 29, 31 29, 31 29, 31 29, 31 Fo re st D ata SIS (p ro jec ted ) B ef or e H100 m 32 32 32 32 32 32 32 32 32 32 32 32 32 32 32 Fo re st D ata St an d A ge B ef or e yr s 30 35 40 45 50 55 60 65 70 75 80 85 90 95 100 Fo re st D ata St em s A fter Tr ees /h a 1225, 4 1209, 2 1190, 2 1157, 7 1119, 8 1095, 2 1063, 7 1028 991, 1 954, 2 918 887, 2 857, 6 829, 4 6146, 3 Fo re st D ata St ems B ef ore Tr ees /h a 1500 1209, 2 1190, 2 1157, 7 1119, 8 1095, 2 1063, 7 1028 991, 1 954, 2 918 887, 2 857, 6 829, 4 802, 7 Fo re st D ata Vo lu m e ( in cl o ver st or ey ) A fter m 3s k/ ha 163, 9 230, 9 304, 2 374, 5 440, 6 500, 9 554, 3 599, 3 639 673, 8 704, 3 730, 9 754, 2 774, 6 0, 5 Fo re st D ata Vo lu me (i nc l o ve rs to re y) B ef ore m 3s k/ ha 192 230, 9 304, 2 374, 5 440, 6 500, 9 554, 3 599, 3 639 673, 8 704, 3 730, 9 754, 2 774, 6 792, 5 Tre at me nt s Vo lu m e H ar ve st ed All S pe cie s m ³s k/ ha 28, 1034 0 0 0 0 0 0 0 0 0 0 0 0 0 791, 5316 NPV EU R/ ha 124 3247 4294 5558 6519 7157 7719 7860 7842 7811 7579 7385 7069 6701 6309 SU M NPV EU R/ ha 3371 4418 5682 6642 7280 7842 7984 7966 7935 7703 7509 7193 6825 6433 KO EF 2, 23 2, 00 1, 83 1, 70 1, 59 1, 51 1, 44 1, 38 1, 33 1, 29 1, 26 1, 23 1, 20 1, 18 1, 16 Ro ta tio n N PV EU R/ ha 68 1861 2439 3137 3667 4019 4329 4408 4398 4381 4253 4145 3971 3768 3551 LE V EU R/ ha 3722 4458 5318 5835 6058 6227 6088 5864 5663 5350 5091 4774 4445 4120 NPV+ LE V EU R/ ha 6742 8075 9633 10569 10973 11280 11028 10622 10258 9691 9222 8648 8052 7463 Thi nning int ens ity 15 %