1(3)
FRICTION IN ROAD DESIGN SAFETY
Yongseok Kim
Korea Institute of Civil engineering and building Technology (KICT) 283, Goyangdae-Ro, Ilsanseo-Gu, Goyang-Si, Gyeonggi-Do, Republic of Korea
Phone: +82-31-9100-173 E-mail: safeys@kict.re.kr
1.
AIM
Since the quantity of the friction demand is highly influenced by the speed choice behavior of drivers, it seems more reasonable to regard friction demand as a performance indicator of the road design safety. The study aims to assess the quantity of the friction demand at four lane rural highways with design speed of 80 km/h. A field survey about the speed selection of drivers was carried out using portable sensors, and data analysis was done to appreciate the quantity of the friction demand. Comparison of the friction demand and friction assumed at design stage was made for the reference of the friction balance, so curve design safety.
2.
METHOD
Portable NC 97 sensors were used to measure the speeds of the drivers while they are negotiating a twenty one horizontal curves with radius ranged from 500 to 1,000 meters. 10 seconds of headway between vehicles were applied as a sorting criteria for the free flow speed data. The speeds at the mid points of curves were measured and stored at laptop for the lab-analysis. A brief statistics of speed survey of the study is described in Table 1.
Tablel 1: A Summary of the statistics of the speed survey
Site Number Radius of Curve (m) Superelevation V85 Speed (km/h) Standard Deviation Number of Sample
1 500 0.05 106.0 15.9 102 2 500 0.05 117.5 15.7 186 3 500 0.06 129.0 17.6 172 4 600 0.04 126.3 18.4 132 5 700 0.04 113.0 14.8 533 6 700 0.04 122.0 16.0 451 7 700 0.05 114.0 14.4 391 8 1000 0.02 116.0 13.0 414 9 1000 0.02 113.0 13.8 487 10 1000 0.02 114.0 17.3 413 11 1000 0.03 117.0 14.6 410 12 1500 0.01 125.9 14.7 468 13 1500 0.01 124.0 15.5 489 14 1500 0.02 122.0 13.0 414 15 1500 0.02 121.0 16.3 71 16 1500 0.02 116.0 16.3 442 17 1500 0.02 116.8 19.0 62 18 1500 0.02 119.0 18.6 112 19 1500 0.02 134.0 16.8 96 20 1500 0.03 118.3 15.7 90 21 2000 0.02 129.2 15.9 53
2(3)
3.
RESULTS
Point mass equation (Eq. 1) widely used for the derivation of curve minimum radius was used to derive the friction demand by applying the 85 percentile speeds measured in this study.
𝑓𝑑𝑒𝑚𝑎𝑛𝑑 = 𝑣2
𝑅 − 𝑒 (Eq. 1)
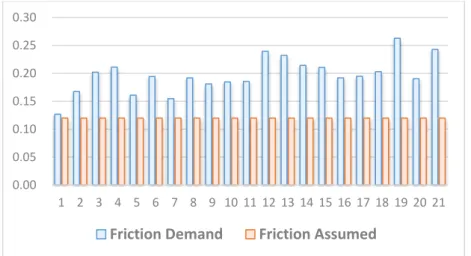
The friction demand in all study curves results higher than the friction assumed as in Figure 1. The highest, the lowest, and the 85th percentile friction demands are 0.26, 0.13, and 0.24 respectively. Again, the differences between friction demand and friction assumed are ranged 0.01 to 0.14. According to Korea MOLIT (2013), the friction assumed corresponding to the design speed 80 km/h is 0.12, and this value is based on the drivers discomfort and safety implicitly while negotiating a curve.
Figure 1: Comparison of Friction Demand and Friction Assumed
In addition to the main results about friction demand, the data also showed a tendency of the proportional increase of the friction demand to the size of curve radius as in Figure 2.
Figure 2: Curve Radius and Friction Demand
0.00 0.05 0.10 0.15 0.20 0.25 0.30 1 2 3 4 5 6 7 8 9 10 11 12 13 14 15 16 17 18 19 20 21
Friction Demand Friction Assumed
0.00 0.10 0.20 0.30 0 500 1000 1500 2000 2500
Frict
ion
D
ema
n
d
Curve Radius (m)
3(3)
4.
CONCLUSION
The study observed the speed choice behaviour of drivers at four lane rural highways. Because friction demand reflects the behaviour of drivers after roads are opne to public, friction demand can be regarded as a performance indicator of the road design safety. A field survey about drivers speed selection was carried out to assess the quantity of the friction demand. Friction demand was derived through point mass equation by applying the 85th percentile speed and compared with the friction assumed at design stage. Friction demand in all curve cases results higher than friction assumed, and this results can be used as a feedback tool to highway authorities for the improvement of the operational safety of curves. In addition to the main study results, a tendency of the proportional increasing of friction demand to the size of curve radius shows the further study about the relationship between friction demand and curve geometry conditions including superelevation distribution.
