by
John R. Conley Thomas B. McKee
Department of Atmospheric Science Colorado State University
Fort Collins, Colorado
AN ANALYSIS OF SOLAR RADIATION DATA FOR FORT COLLINS, COLORADO
by
John R. Conley Thomas B. McKee
Department of Atmospheric Science Colorado State University
Fort Collins, CO 80523 February 1983
Atmospheric Science Paper No. 369 Climatology Report No. 83-2
Work with solar radiation reaching the earth's surface frequently requires a knowledge of the extraterrestrial solar radiation. A method of calculating extraterrestrial solar radiation over various time scales (i.e. instantaneous, hourly, daily, etc.) with known errors is detailed.
Solar radiation data for Fort Collins, Colorado, for the years 1977-1980 are examined to determine extended periods of low surface solar radiation. During the 58 days from 5 January to 5 March 1978 the normalized direct component is shown to have been less than 0.15 for three separate periods totaling 29 days.
From this same data set correlation equations between the hemi-spheric/extraterrestrial and diffuse/extraterrestrial ratios are developed, allowing prediction of the diffuse component, given the hemispheric, for this high altitude, dry environment.
ACKNOWLEDGEMENTS
The author would like to thank Mr. John Kleist for his aid and guidance in computer programming, Ms. Odilia Panella for her help in preparing the manuscript, and Dr. Stephen K. Cox for his many helpful suggestions.
ABSTRACT . . . . iii
ACKNOWLEDGEMENTS iv
LIST OF FIGURES. vi
LIST OF TABLES . vii
LIST OF SYMBOLS. . viii
I. INTRODUCTION. 1
II. CALCULATION OF EXTRATERRESTRIAL SOLAR RADIATION 3
A. The Method 4
B. The Computational Procedure 7
C. Accuracy of the Method. 8
III. ANALYSIS OF FORT COLLINS SOLAR RADIATION DATA 10
A. Data Handling. 10
B. Results of Analysis 12
C. Relationships Between Solar Radiation Components. 21
IV. SUMMARY AND CONCLUSIONS 27
REFERENCES. 29
APPENDIX. . 30
Figure 1.
LIST OF FIGURES
Time series plots of average daylight hours cloudiness, average daily direct/direct extraterrestrial ratios, and average daily
hemispheric/extraterrestrial ratios for 5 January to 5 March 1978. . . .
2. Correlation equations between daily hemispheric/ extraterrestrial and diffuse/extraterrestrial
. . . . 20
ratios for means, 80%, and 20% confidence levels . . . . 24 3. Comparison of the hemispheric/extraterrestrial
to diffuse/extraterrestrial correlations of the present study with those of Liu and Jordan
(1960) for Blue Hill, MA and Orgill and Hollands
(1976) for Toronto Airport, Canada . . . 26
Table
1. Frequency distribution of the daily Diffuse/
Hemispheric ratio . . . . .13 2. Frequency distribution of the daily Diffuse/
Extraterrestrial ratio . . . . . . . . . 14
3. Frequency distribution of the daily Hemispheric/
Extraterrestrial ratio . . . 15 4. Frequency distribution of the Direct/
Direct extraterrestrial ratio . . . 16
ANGVEL DIF DIF/ETR DIF/HEM DIR DIRETR DIR/DIRETR ET ETR GMT h HEM hr HEM/ETR m NOON R LIST OF SYMBOLS Angular velocity of the earth.
diffuse component of the incoming solar radiation. dimensionless ratio of the diffuse component and the extraterrestrial solar radiation.
dimensionless ratio of the diffuse and hemispheric components of incoming solar radiation.
direct component of the incoming solar radiaion.
normal component of the extraterrestrial solar radiation. dimensionless ratio of the direct component and the nor-mal component of the extraterrestrial solar radiation.
number of days from an established base date. extraterrestrial solar radiation.
Greenwich mean time. local hour angle.
hemispheric component of the incoming solar radiation. hour.
dimensionless ratio of the hemispheric component and the extraterrestrial solar radiation.
meter.
local noon in Greenwich mean time.
instantaneous extraterrestrial solar radiation.
extraterrestrial solar radiation integrated over some time interval.
distance between the sun and the earth.
S T TIME W
z
p solar constant. equation of time.mid-point of an integration interval. watt.
solar zenith angle.
time parameter for calculating the relative sun-earth distance.
solar declination.
time parameter for calculating solar declination and the equation of time.
1 at i tude. longitude.
CHAPTER I INTRODUCTION
The emphasis in recent years concerning alternate sources of energy has resulted in a large body of research concerning the solar radiation received at the earth1s surface. This surface solar radiation, termed insolation or hemispheric radiation, is comprised of two components; the direct and diffuse. The hemispheric radiation, variously called the total or total hemispheric, is the total irradiance received from the upward hemisphere. The direct, variously termed direct beam or simply beam, component is that irradiance received directly from the sun (usu-ally within a field of view of about 5°). The direct irradiance multi-plied by the cosine of the solar zenith angle gives the contribution to the hemispheric irradiance from the direct component. The remainder of the hemispheric irradiance, which comes from all angles in the upward hemisphere not contained in the direct measurement, is called the dif-fuse component. One final definition is required. The extraterrestrial solar radiation is that irradiance available at the top of the atmos-phere on a surface normal to the local vertical. The value of this extraterrestrial irradiance is affected by variations in the sun-earth geometry. These effects include an annual variation of about ±3.3% in the sun-earth distance due to the ellipticity of the earth1s orbit, the inclination of the earth1s axis, and the rotation of the earth about
its axis. These effects are predictable and a method of calculating the extraterrestrial solar radiation ;s detailed in Chapter II.
Liu and Jordan (1960) pioneered research in determining the rela-tionship between the hemispheric and the diffuse component. Their work was based primarily on data measured at Blue Hill, Massachusetts. Since this initial study, many authors have investigated these relationships for various other locations. Most notable among these studies are those by Ruth and Chant (1975) for selected Canadian locations, Orgill and Hollands (1976) for Toronto, Canada, and Collares-Pereira and Rabl (1978) for locations in New Mexico, Texas, California, and Massachu-setts. Chapter III of this paper will deal with the diffuse-hemispheric relationship based on data measured at Fort Collins, Colorado -- a high altitude, dry environment.
CHAPTER II
CALCULATION OF EXTRATERRESTRIAL SOLAR RADIATION
Normalization of the hemispheric irradiance and its components is accomplished by forming the dimensionless ratio of the hemispheric
and/or a given component to an appropriate value of the extraterrestrial solar radiation (ETR). It should be pointed out, however, that the direct component should be normalized by that irradiance available at the top of the atmosphere on a surface normal to the sun's rays. For the purposes of this study, this modified ETR is termed the direct ETR (DIRETR). The purpose of this normalization procedure is to eliminate the dependence of the surface values on solar position. This is espe-cially important whenever comparisons are to be made for different times (i.e. one hour to another, one day to another, etc.) or for different locations.
Sellers (1965) gives procedures for calculating instantaneous and daily extraterrestrial solar radiation values and a graphical method for determining daily and monthly values. Guttman and Mathews (1979) out-line a method for calculating values for variable time periods of an hour up to one day. The remainder of this chapter will deal with a method of calculating extraterrestrial solar radiation over various time spans and with known errors.
A. The Method
Instantaneous extraterrestrial solar radiation can be calculated from the relationship (Sellers, 1965):
Q
=
S(R/R)2 cos Z [2.1]where,
Q is the extraterrestrial solar radiation,
S is the solar constant, taken to be 1377 Watts per square meter (U.S. Department of Commerce, 1978),
(R/~) is the ratio of the mean to actual sun-earth distance,
cos Z is the cosine of the solar zenith angle.
Determination of the relative sun-earth distance parameter ((R/R)2) and the solar position using Fourier Series was first proposed by Spencer (1971). Thompson (1981) devised more accurate Fourier Series represen-tations for these parameters. The Fourier Series presented in this paper are based on the formulations of Thompson (1981). They have been modified, however, to facilitate computer programming. All series
formulations were based on data obtained from the American Ephemeris and Nautical Almanac for 1965. The Fourier Series formulation for calcu-lating the relative sun-earth distance parameter is detailed in section II A.1. The solar position is determined from the geometric formula:
cos Z = sin <I> sin
o
+ cos <I> cos 0 cos h [2.2]where,
<I> is the latitude of the observation,
0 is the solar declination, + for north 1 atitudes, - for south latitudes,
5
The Fourier Series formulation for calculating solar declination ;s detailed in section II A.2. The local hour angle ;s related to Green-wich mean time (GMT) as follows:
where,
h
=
2n (GMT - 12 + T) - ~ 24~ is the longitude of the observation in radians, + for west longitude, - for east longitude,
T is the equation of time.
[2.3]
The equation of time corrects for the difference between true solar time and mean time which is in common use. The Fourier Series used to calcu-late the equation of time is detailed in section II A.3.
The Fourier series formulations are approximations to the exact values. Data was obtained from the American Ephemeris and Nautical Almanac for the years 1974, 1979, 1980 and 1981 and compared to values calculated using these series representations. The errors thus obtained are given at the end of the section detailing each series.
1. Relative sun-earth distance
The Fourier series representation for the relative sun-earth dis-tance parameter is:
(R/R)2 = 1.000145 + 0.033382 cos a + 0.001952 sin a
+ 0.000698 cos (2a)
The time parameter (a) is given by:
a
=
0.0172017221 [ET + (NOON/24)]where,
[2.4]
[2.5J
ET is the number of days from a base date of 0 January 1974 (i.e. 1 January 1974 is day one),
NOON is local noon (in Greenwich mean time) for the longitude of the point for which the calculation is being made, the constant (0.0172017221) is 2n divided by the annual
period for the earth to return to the same distance from the sun (365.2649 days).
The maximum error in the calculated square of the relative sun-earth distance using this formula is ± 0.011%.
2. Solar declination
The Fourier series representation of the sun's declination is:
o
=
0.00666 - 0.400866 cos p + 0.06523 sin p0.00667 cos (2p) + 0.00057 sin (2p)
- 0.00274 cos (3p) + 0.00124 sin (3p) The time parameter (p) is given by:
where,
p
=
0.0172027912 [ET + (TIME/24)]TIME is the mid-point of the integration period (in Greenwich mean time),
the constant is derived from an annual period of 365.2422 days.
[2.6]
[2.7J
The maximum error in the calculated declination using this formula is ± 1 minute.
3. Equation of time
The Fourier series for calculating the equation of time is: T
=
0.0098 cos P - 0.1227 sin p - 0.0510 cos (2p)- 0.1581 sin (2p) 0.0056 sin (3p)
- 0.0021 cos (4p) 0.0030 sin (4p) [2.8]
7
The maximum absolute error in the calculated equation of time using this formula is ± 12 seconds.
B. The Computational Procedure
Integration of equation [2.1] over some time interval for which the declination and relative sun-earth distance can be assumed constant yields:
Q
1=
S(R/R)2 [sin $ sin 0 (h2 - hI)+ cos $ cos 0 (sin h2 - sin h1)]/ANGVEl [2.9] where,
ANGVEl is the earth's angular velocity in radians per hour. Because it changes so slowly the relative sun-earth distance was cal-culated for noon of each day and assumed constant for that day. Thomp-son (1981) points out that calculation of the solar declination once every four hours gives satisfactory results; however, for this study values of both declination and the equation of time were calculated at the midpoint of each integration interval and assumed constant for that interval. A one hour time interval was chosen for use in this study, except that when hI was less than the sunrise hour angle it was set equal to the sunrise hour angle and, similarly, when h2 was greater than the sunset hour angle is was set equal to the sunset hour angle.
The appendix is a program listing (FORTRAN V) of this computational scheme with the time interval (TIMINe) set to one hour. The program will output daily total extraterrestrial solar radiation for the years and location specified. Values other than daily totals (i.e. instantan-eous, hourly, etc.) can be obtained by changing the beginning (BEGGMT)
and ending (ENDGMT) times. For mean monthly values a simple averaging loop should be added.
C. Accuracy of the Method
Given the errors inherent in calculating the relative sun-earth distance, declination, and equation of time, the maximum error in cal-culated extraterrestrial solar radiation has been determined. The errors were maximized with the declination set at 23° and the hour angles (which are a function of the equation of time) set at 900for the
instantaneous error determination and at 0° and 15° for the hourly determination. Hourly errors were then summed for 15 hourly calcula-tions to arrive at the daily errors. It should be noted that the im-proved performance of the daily calculation over the hourly calculation
is due to the fact that the equation of time correction is symmetrical about true solar noon. For this reason whenever the calculation is performed over an interval which is also symmetrical about true solar noon, the equation of time correction is cancelled and the error associ-ated with it makes no contribution to the calculassoci-ated extraterrestrial solar radiation. It should be emphasized that the stated errors are due solely to the computational procedure and do not ,account for any changes in solar output of long term changes in sun-earth geometry.
1. Instantaneous values
Maximum absolute error 1.3 Wm- 2 Maximum percent error 0.10% 2. Hourly values
Maximum absolute error 4 W hr m- 2hr- 1 Maximum percent error 0.32%
9 3. Daily values
Maximum absolute error 5 W hr m- 2day-l Maximum percent error 0.05%
ANALYSIS OF FORT COLLINS SOLAR RADIATION DATA
Both the direct component (DIR) and hemispheric irradiance (HEM) have been measured at the Atmospheric Science Department of Colorado State University since the spring of 1975. The hemispheric irradiance is measured by an Eppley Precision Pyranometer in the spectral interval 0.3 ~m to 3.0 ~m, while an Eppley Pyrheliometer measures the direct component in the same wave length band. Cox and McKee (1978) and Cox and McKee (1980) give a complete description of the facility and the instrumentation, as well as hourly, daily, and monthly values of the direct component and hemispheric irradiance. Because of the complete-ness of the data, the years 1977 through 1980 were chosen as the data base for this study. The diffuse component (DIF) was calculated from the relation:
DIF
=
HEM - (DIR)(cos Z). [3.1]The method described in Chapter II for determining solar position was used in calculating cos Z.
A. Data Handling
Quality of solar radiation data can be affected by the calibration of the pryanometer or pyrheliometer, mechanical or electronic problems with the recording system, misalignment of the pyrheliometer, and/or dirty or snow covered optical surfaces. Therefore, the following
11
decision criteria were applied to the data prior to further analysis and resulted in a total data set of 707 days.
1. Missing data
Data for an entire day was disregarded if for one or more hours either the direct or hemispheric values were missing. A total of 506 days fell into this category.
2. Suspicious data
If the calculated diffuse component was less than zero the entire day's data was disregarded. This condition results from the direct component being too large or the hemispheric being too small, either of which indicate instrument problems. Only nine days fell into this category.
3. Problems at sunrise/sunset
Near the times of sunrise and sunset it is possible for the solar zenith angle to exceed ±90o, in which case the cosine of the solar zenith angle will be negative and the resulting calculated diffuse com-ponent will be greater than the hemispheric (assuming the direct is non-zero). For these events the hourly diffuse component was set equal to the hemispheric value.
4. Excessively large values of diffuse All hours for which the inequality
DIF ~ 0.5(S x cos Z) [3.1J
was not true were eliminated (Collares-Pereira and Rabl, 1978). This condition results from the direct component being too small with respect to the hemispheric, the most probable cause being misalignment of the
pyrheliometer. A total of 239 days were eliminated for not satisfying the above inequality.
B. Results of Analysis 1. Frequency distributions
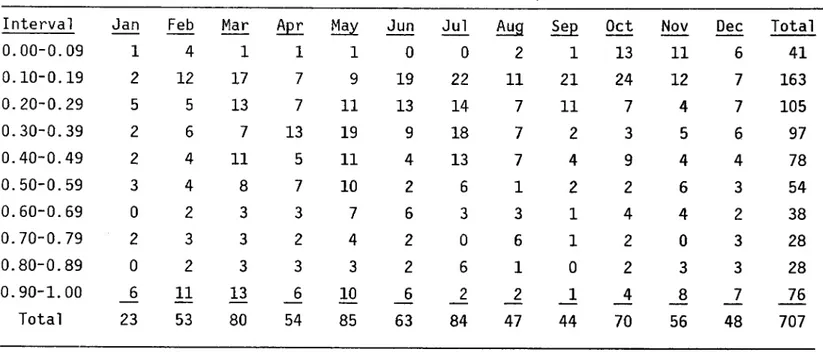
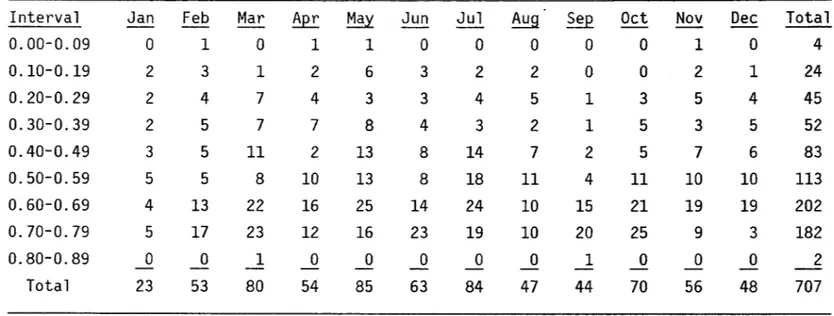
Table 1 gives the number of days, by month for which the diffuse component to hemispheric COIF/HEM) ratio fell within the various inter-vals. Table 2 and Table 3 are similar, but for the diffuse to extrater-restrial COIF/ETR) and hemispheric to extraterextrater-restrial (HEM/ETR) ratios, respectively. Inspection of Table 1 reveals a maximum occurrence of days (23%) in the 0.10-0.19 range. These represent days of relatively clear conditions. A secondary peak (11%) ;s observed in the range 0.90-1.00, representing overcast conditions when the daily direct compo-nent is equal to or very nearly zero. From Table 2 we find that on 75% of the days the OIF/ETR ratio falls in the 0.10-0.29 range. Table 3 in-dicates that on 29% of the days the HEM/ETR ratio falls in the 0.60-0.69 range, and no evidence of a secondary maximum exists. Table 4 gives the frequency distribution of the direct to direct extraterrestrial ratio (DIR/DIRETR). Most notable here is the relatively uniform distribution in the range of 0.00 to 0.59, with the difference in the maximum and minimum occurrences being only about 9.8 percent.
2. An extended period of low surface solar radiation
The Front Range of the Colorado Rocky Mountains has the reputation of being generally sunny and mild and, therefore, an excellent environ-ment for solar energy applications. The question arises as to how well deserved this reputation may be. In an attempt to at least partially answer this question, the data was scanned to determine the number of
Interval 0.00-0.09 0.10-0.19 0.20-0.29 0.30-0.39 0.40-0.49 0.50-0.59 0.60-0.69 0.70-0.79 0.80-0.89 0.90-1. 00 Total
Table 1. Frequency distribution of the daily Diffuse/Hemispheric ratio. Entries are the number of days.
Jan Feb Mar Apr May Jun Jul Aug Sep Oct Nov
1 4 1 1 1 0 0 2 1 13 11 2 12 17 7 9 19 22 11 21 24 12 5 5 13 7 11 13 14 7 11 7 4 2 6 7 13 19 9 18 7 2 3 5 2 4 11 5 11 4 13 7 4 9 4 3 4 8 7 10 2 6 1 2 2 6 0 2 3 3 7 6 3 3 1 4 4 2 3 3 2 4 2 0 6 1 2 0 0 2 3 3 3 2 6 1 0 2 3 6 11 13 6 10 6 2 2 1 4 8 23 53 80 54 85 63 84 47 44 70 56 Dec Total 6 41 7 163 7 105 6 97 4 78 3 54 2 38 t-' 3 28 w 3 28 7 76 48 707
ratio. Entries are the number of days.
Interval Jan Feb Mar Apr May Jun Jul Aug Sep Oct Nov Dec Total
0.00-0.09 1 11 6 2 2 9 2 5 12 24 18 10 102 0.10-0.19 10 16 26 18 34 33 46 26 21 21 14 13 278 0.20-0.29 7 16 33 29 37 13 34 14 10 23 16 17 249 0.30-0.39 5 10 14 5 12 7 2 2 1 2 8 7 75 0.40-0.50 0 0 1 0 0 1 0 0 0 0 0 1 3 Total 23 53 80 54 85 63 84 47 44 70 56 48 707 ... ..j:::o
Table 3. Frequency distribution of the daily Hemispheric/Extraterrestrial ratio. Entries are the number of days.
Interval Jan Feb Mar Apr May Jun Jul Aug Sep Oct Nov Dec Total
0.00-0.09 0 1 0 1 1 0 0 0 0 0 1 0 4 0.10-0.19 2 3 1 2 6 3 2 2 0 0 2 1 24 0.20-0.29 2 4 7 4 3 3 4 5 1 3 5 4 45 0.30-0.39 2 5 7 7 8 4 3 2 1 5 3 5 52 0.40-0.49 3 5 11 2 13 8 14 7 2 5 7 6 83 0.50-0.59 5 5 8 10 13 8 18 11 4 11 10 10 113 0.60-0.69 4 13 22 16 25 14 24 10 15 21 19 19 202 0.70-0.79 5 17 23 12 16 23 19 10 20 25 9 3 182 ~ <.T1 0.80-0.89 0 0 1 0 0 0 0 0 1 0 0 0 2 Total 23 53 80 54 85 63 84 47 44 70 56 48 707
Interval 0.00-0.09 0.10-0.19 0.20-0.29 0.30-0.39 0.40-0.49 0.50-0.59 0.60-0.69 Total
extraterrestrial ratio. Entries are the number of days.
Jan Feb Mar Apr May Jun Jul Aug Sep Oct Nov Dec
7 14 17 11 16 10 8 7 2 10 11 12 3 4 9 4 15 8 7 6 1 4 7 5 4 5 11 10 13 4 18 12 5 10 7 6 2 7 12 12 20 9 17 6 6 2 5 10 4 8 11 10 12 18 16 7 11 12 9 5 2 13 16 6 8 13 18 7 18 29 16 10 1 2 4 1 1 1 0 2 1 3 1 0 23 53 80 54 85 63 84 47 44 70 56 48 Total 125 73 105 108 123 156 17 707 ... m
17
times when the daily hemispheric to extraterrestrial ratio was less than 0.35 for a period of three or more consecutive days. The criteria
(HEM/ETR) < 0.35 was chosen because Orgill and Hollands (1976) point out that values in this interval represent extremely cloudy days with over 90% of the total insolation being diffuse. Six such cases were found. They were 27-29 April 1977, 16-18 August 1977, 6-9 February 1978, 1-3 May 1978, 6-8 May 1980. Because of the duration of the February 1978 event, the fact that this is the only period which was found in the primary heating season, and having noted that the HEM/ETR values for 11 and 12 February were also below the threshold, a closer examination of this period was made.
a. The meteorological situation. A high pressure cell was cen-tered over southwestern Colorado on 5 February with a stationary front lying just east of Fort Collins. Fort Collins experienced light (less than 5 knots) south easterly flow throughout the entire day and by 1900 LST began observing the classic upslope conditions (ceiling at 100 feet and two miles visibility in fog). On 6 February the front moved west over the Rocky Mountains. Ceilings were generally at 500 feet, visi-bility three to four miles in fog, and winds remained light out of the south through southeast. A cold front, having moved off the Pacific Ocean, merged with the stationary front on the 8th and produced, on the 7th and 8th of February, ceilings 100 to 300 feet, visibility ~ to ~ mile in fog and occasional light snow, and winds calm to light south-easterly. On the morning of the 9th, a second frontal system moved on shore and stagnated over central Nevada and central California and remained in this location through the 10th as the low pressure cell centered over central Nevada intensified. The system began a slow eastward movement on 11 February which continued until around midnight
when it merged with the stationary front over the Colorado Rockies. During this entire period Fort Collins continued to experience up-slope conditions, with ceilings generally 300 to 800 feet (except 5,000 to 7,000 on the 10th), visibilities from less than one up to five miles and light southeasterly flow. The active portion of the cold front then dropped south into east central New Mexico, and by 0800 LST the station-ary front had dissipated and the surface winds became light out of the northeast, although the ceiling remained at between 200 and 500 feet throughout most of the daylight hours. By early morning on the 13th the clearing trend was well established.
b. Radiative observations. The hemispheric/extraterrestrial ratio and direct/direct extraterrestrial for each day during this period is given below. DAY 6 7 8 9 10 11 12 HEM/ETR 0.25 0.21 0.11 0.29 0.43 0.15 0.23 DIR/DIRETR 0.00 0.00 0.00 0.00 0.09 0.00 0.11
In reviewing the weather records for this February 1978 case, it appeared that there were other periods of extreme cloudiness that had not been detected by the proposed threshold. Time series plots of
average cloudiness during daylight hours, the DIR/DIRETR ratios, and the HEM/ETR ratios for the period 5 January to 5 March were made, and are given in Figure 1. Three periods stand out in the cloudiness and DIR/ DIRETR plots -- 12-20 January, 5-16 February, and 24 February through 3 March. Average cloudiness during the 5-16 February event was 9.6/10, while the climatological mean for February is only 5/10. The average
Figure 1. Time series plots of average daylight hours cloudiness, average daily direct/direct extraterrestrial ratios, and the average daily hemispheric/ extraterrestrial ratios for 5 January to 5 March 1978. Points indicated
20
'J
~
to .s:::. (J 10-C ~ UJ :IE to C\J 0 C\J to ~ 10-C ::l UJ UJ 0 10.. .0~
;;
If
to :;: :?; :E :E~
to C\J 0 ~ C\J 10-C ::l UJ c:J
to c J 0 :E ~ :E ~ LO QaXO¢C\JO (SlaUa~) O<oWq-NO "':0000 pnolJ ID!J~SaJJa~DJ~X3 ~:>aJ!G / ~:>aJ!G21
(observed average minus climatological mean) were: Maximum (OF) -13.8
Minimum (oF) +2.3
The synoptic situation during the January and February/March cases proved to be practically identical to that detailed for 5-12 February. The results of further investigation are as foll ows:
12-20 Januar~ 24 Februar~ - 3 March
Mean Observed Mean Observed
Cloudiness 4.5/10 8.9/10 5/10 9.9/10
DIR/DIRETR 0.03 0.04
Maximum Temperature (oF) 40.6 33.0 44.8 36.5
Minimum Temperature (OF) 14.6 10.0 18.0 20.2
We therefore have three events covering 29 days in a total period of only 58 days where the average daylight hours cloudiness exceeded 88% cloud cover, the average daily DIR/DIRETR ratio was only 0.04, and temperatures where highly variable with maximums from 7.6 to 13.8 de-grees below the means and minimums from 2.3 dede-grees above to 4.6 dede-grees below mean values.
A four year data base is insufficient to establish a real solar radiation climatology. In general, however, it would seem that the reputation of the Front Range is well deserved, though occasional ex-tended periods (three days or more) of low insolation may be expected. The January-March 1978 event is certainly an anomally and should not be considered representative of a normal year.
C. Relationships Between Solar Radiation Components
Subsequent to the initial work by Liu and Jordan (1960) relating the diffuse and hemispheric irradiance, many authors have investigated
this relationship for various other locations. Among these Ruth and Chant (1975), Orgill and Hollands (1976), and Collares-Pereira and Rabl (1978) found correlations which deviated significantly from those of Liu and Jordan (1960). The remainder of this chapter will deal with the diffuse-hemispheric irradiance correlations determined from the 1977 through 1980 data base for Fort Collins, Colorado.
1. Method of correlation
The daily DIF/ETR and HEM/ETR ratios were calculated. For each HEM/ETR interval of 0.10 the corresponding values of DIF/ETR were ave-raged and these mean values were plotted against the value of HEM/ETR for the mid-point of that interval. The only exception to this approach was for the HEM/ETR interval 0.00-0.09. Only four days fell into this
interval with values of 0.07-0.09. Therefore, the mean DIF/ETR value (0.08) was plotted against the mean HEM/ETR value (0.08). A least squares polynomial fit was then obtained for these means.
The cumulative density function of DIF/ETR values within each HEM/ETR interval was also obtained, and the 20 and 80 percent levels determined. The values of each of these levels were again plotted against the value of HEM/ETR for the mid-point of that interval (except that values for the lowest interval were again plotted against a HEM/ETR value of 0.08), and a least squares ploynomial fit obtained for each of these levels.
2. Correlation equations
The interval 0.35 ~ (HEM/ETR) ~ 0.80 included approximately 86.3 percent of the total number of days. The following correlations were obtained:
23 Mean -0.348 + 3.93(HEM/ETR) -7.51(HEM/ETR)2 + 4.14(HEM/ETR)3 20% level 80% level -0.129 + 2.72(HEM/ETR) -5.81(HEM/ETR)2 + 3.42(HEM/ETR)3 0.243 + 0.386(HEM/ETR) -0.124(HEM/ETR)2 - 0.750(HEM/ETR)3
There were no points in the interval (HEM/ETR) > 0.81.
[3.2]
[3.3]
[3.4]
The remaining days fell in the interval 0.00 ~ (HEM/ETR) < 0.35. The correlations obtained were:
Mean 0.010 - 0.863(HEM/ETR) 20% level 80% level + 0.200(HEM/ETR)2 - 1.13(HEM/ETR)3 0.0913 - 0.724(HEM/ETR) + 7.62(HEM/ETR)2 - 12.0(HEM/ETR)3 0.0006 + 1.34(HEM/ETR) - 1.20(HEM/ETR)2 + 0.273(HEM/ETR)3 [3.5] [3.6] [3.7] It interesting to note that while 32.4 percent of the values in the Orgill and Hollands (1976) study (based on four years of data for To-ronto Airport, Canada) fell in this interval, which again represents ex-tremely cloudy conditions, only 13.7 percent of Fort Collins days were included. Caution should be used in any direct comparison, however, since their work was based on hourly values and the present study deals only with daily totals.
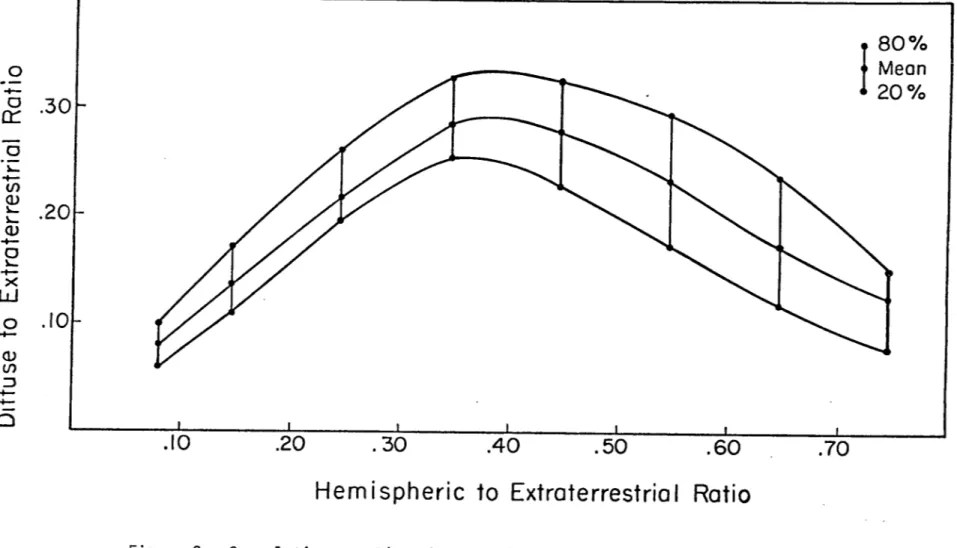
Figure 2 shows plots of the above correlation equations. A compar-ison of the correlation equations for the mean values in the present study with those developed by Liu and Jordan (1960), based on ten years of data for Blue Hill, Massachusetts, and by Orgill and Hollands (1976),
o
-&
.30
0 lo....-
(/) OJ.20
lo.... lo.... OJ-
0 lo....-
Xw
0./0'--
OJ (/) :J '+-0/ / /
./0
.20
.30
.40
.50
.60
Hem i spheric to Extraterrestria I Ratio
~
.70
I
Mean20%
Figure 2. Correlation equations between daily hemispheric/extraterrestrial and
diffuse/extraterrestrial ratios for. means, 80 percent, and 20 percent levels.
N
25
based on four years of data for Toronto Airport, Canada, is given in Figure 3. The correlations for the three different regions are very similar for HEM/ETR values less than 0.15. This is no doubt due to the fact that in this range the direct component is zero (or very nearly so) and, therefore, the total insolation is very nearly all diffuse. In the HEM/ETR range of 0.15 to around 0.45, the present study gives DIF/ETR values that lie about midway between the other two correlations, while above HEM/ETR values of 0.60 the present study and that of Liu and Jordan (1960) agree quite well.
-
0 0:: 0 ),..-
(j) OJ L ),.. OJ-
0 L-~
0-
OJ (j) :::l'+-
.-0.30
.20
.10
/ , / "/ "/.10
, / Figure 3. / , /Toronto Airport, Canada
---
--.
/.,.. Fort Collins, ... ,
,//
C o . "
, / ... /---
,
/ . , . . - -
-
,
/.
,,/ Blue Hill, Mo.
"
b , / / , /
...
_-/ ' , / /.20
.30
.40.50
.60
Hemispheric to Extraterrestrtal Ratio
.70
Comparison of the hemispheric/extraterrestrial to diffuse/extraterrestrial correlations of the present study with those of Liu and Jordan (1960) for Blue Hill, MA and Orgill and Hollands (1976) for Toronto Airport, Canada.
N
CHAPTER IV
SUMMARY AND CONCLUSIONS
An investigation of the solar radiation environment of Fort
Collins, Colorado, was performed. A method of calculating the extrater-restrial solar radiation over various time scales and with known errors was accomplished. Uncertainty of the extraterrestrial values resulting from thi; calculation are 1.3 W m-2 in calculating instantaneous values, 4 W hr m- 2 hr- 1 for hourly values, and 5 W hr m- 2 day-1 for daily total calculations. These errors are certainly less than those to be expected in the measurement of surface solar radiation. The computer program developed to perform the ETR calculation is given in the Appendix and will produce daily totals for one year for about $1.20 on a Control Data Corporation CYBER system. (Note: This is not intended to be an endorse-ment of the CDC CYBER and is given only as an example of expected cost.)
Equations correlating the diffuse and hemispheric components were developed. Since establishment of confidence intervals for these cor-relations would entail assumptions regarding the statistical normal icy of the data, correlations for the 20 percent level and 80 percent level obtained from cumulative density functions of the actua1 data were determined. This was done in an attempt to provide the maximum infor-mation with the fewest assumptions. Using these correlations the mean daily diffuse component of the insolation can be predicted, given the value of the hemispheric component. These present correlations were also compared to those found by Liu and Jordan (1960) and Orgill and
Hollands (1976) and were found to agree well with the results of Liu and Jordan (1960) except in the HEM/ETR range of 0.20 to 0.60 where the present work gives values of DIF/ETR ranging from 0.01 to 0.04 higher. Except in the very lowest values ((HEM/ETR) ~ 0.20) the correlations of Orgill and Hollands (1976) consistently over estimate the DIF/ETR values of the present study by as much as 0.05. While this study was based on data taken only at Fort Collins, Colorado, and the correlations have not been applied to an independent data set for other locations, the author believes the correlations given should prove useful for other climato-logically· similar, high altitude sites.
Finally, an investigation into extended periods of low insolation was made. For the four year data set six periods of three days or more were found where the diffuse component would account for more than 90% of the total insolation received. Additionally, during a 58 day period three cases totaling 29 days were found in which the direct component to extraterrestrial direct component ratio did not exceed 0.15. The four year data set is certainly too short a time period to establish a clima-tology. However, the results of this study tend to lend creedence to the reputation of the Colorado Front Range as being very suitable for solar energy applications.
REFERENCES
Collares-Pereira, M., A. Rabl, 1979: The average distribution of solar radiation -- correlations between diffuse and hemispherical and between daily and hourly insolation values. Solar Energy, 22, 155-164.
Cox, S. K., T. B. McKee, 1978: Fort Collins solar radiation data --May 1975 through December 1977. Climatology Report 78-1, Depart-ment of Atmospheric Science, Colorado State University, Fort Collins, Colorado.
Cox, S. K., T. B. McKee, 1980: Fort Collins solar radiation data --January 1978 through December 1979. Climatology Report 80-1, Department of Atmospheric Science, Colorado State University, Fort Collins, Colorado.
Liu, B. Y. H., R. C. Jordan, 1960: The interrelationship and character-istic distribution of direct, diffuse and total radiation. Solar Energy, IV, 1-9.
Orgill, J. F., K. G. T. Hollands, 1976: Correlation equation for hourly diffuse radiation on a horizontal surface. Solar Energy, 19, 325-329.
Ruth, D. W., R. E. Chant, 1976: The relationship of diffuse radiation to total radiation in Canada. Solar Energy, 18, 153-154.
Sellers, W. D., 1965: Physical Climatology. The University of Chicago Press, Chicago, Illinois.
Spencer, J. W., 1971: Fourier Series representation of the sun. Search, ~, 172.
Thompson, T. M., 1981: Pyrheliometer observations as an indication of the climatological persistance of clouds. Technical Memo NOAA ERL ARL-97. Air Resources Laboratory, Silver Spring, MO, Feb., 78 pp. U. S. Department of Commerce, 1978: SOLMET, Volume 1 -- Users Manual,
Hourly Solar Radiation -- Surface Meteorological Observations. NOAA, Environmental Data and Information Service, National Climatic Center, Asheville, North Carolina.
This Appendix is a listing of a program to compute daily values of extraterrestrial solar radiation (HEMETR), the normal component of the extraterrestrial solar radiation (DIRETR), and the length of the day (DAYLEN).