This project has received funding from the European Union’s Horizon 2020 research and innovation programme under grant agreement No. 723201
D3.3 Tools for
assessing the traffic
impacts of automated
vehicles
Version: 1.0
Date: 17.04.2020
Author: Iman Pereira, Charlotte Fléchon, Fredrik Johansson, Johan
Olstam, Alexander Dahl, Paola Tiberi, Andrea Paliotto, Antonino
Tripodi
The sole responsibility for the content of this document lies with the authors. It does not necessarily reflect the opinion of the European Union. Neither the EASME nor the European Commission are responsible for any use that may be made of the information contained therein.
Document Control Page
Title Tools for assessing the traffic impacts of automated vehicles
Creator Johan Olstam
Editor Johan Olstam
Brief Description Description of the assessment tools and how to apply them
Reviewers Daniel Franco
Contributors
Iman Pereira, Charlotte Fléchon, Fredrik Johansson, Johan Olstam, Alexander Dahl, Paola Tiberi, Antonino Tripodi, Edoardo Mazzia, Andrea Paliotto, Adriano Alessandrini
Type (Deliverable/Milestone) Deliverable
Format Report
Creation date 18.10.2019
Version number 1.0
Version date 28.04.2020
Last modified by Johan Olstam Rights
Audience
Internal Public
Restricted, access granted to: EU Commission Action requested
To be revised by Partners involved in the preparation of the Deliverable
For approval of the WP Manager
For approval of the Internal Reviewer (if required) For approval of the Project Co-ordinator
Deadline for approval
Version Date Modified by Comments
0.1 18.10.2019
Johan Olstam Disposition and included drafts from Charlotte on the safety part
0.2 06.11.2019 Johan Olstam & Iman Pereira
Revised section 1-3 and reviewed section 4
0.3 10.12.2019
Iman Pereira New version of the safety part from Charlotte
0.4 11.12.2019 Fredrik Johansson Revised introduction
0.5 13.12.2019
Fredrik Johansson Revised section 2-3, incorporated sec 2 in sec 3 (new sec 2).
0.6 17.12.2019 Iman Pereira Added input from Charlotte and
revised section 2 and appendix
0.7 19.12.2019
Johan Olstam Final revision to final draft stage
0.8 31.01.2020
Johan Olstam Final version
0.9 17.04.2020
Paola Tiberi
Input on methodology for safey assessment based on safety inspections.
0.91 17.04.2020
Johan Olstam Final draft
0.92 21.04.2020 Charlotte Fléchon Review
0.93 23.04.2020 Paola Tiberi & Andrea
Paliotto Review
0.94 28.04.2020 Johan Olstam Final version for submission
1.0 29.04.2020
Iman Pereira Final version for submission
Table of contents
1
Introduction ... 6
1.1
Structure of the deliverable ... 6
1.2
Relation to other CoEXist deliverables ... 7
1.3
Outline ... 7
2
Traffic performance and space efficiency assessment tool ... 7
2.1
Metrics and thresholds for traffic impact of automation ... 7
2.3
Tool structure overview ...10
2.4
Development process ...10
2.5
Input ...11
2.5.1 Considered metrics ... 12
2.5.2 Experimental design ... 12
2.5.3 Value extraction script (Micro) ... 14
2.5.4 Value extraction (Macro)... 14
2.6
Output ...14
2.6.1 Quality check (micro) ... 14
2.6.2 Automation Impact (micro/macro) ... 15
2.6.3 Score Cards (micro/macro) ... 15
2.7
Other possibilities ...15
2.8
Step by step guide ...16
2.8.1 Step 0 ... 16 2.8.2 Step 1a ... 16 2.8.3 Step 1b ... 16 2.8.4 Step 2 ... 17
2.9
Discussion ...17
2.9.1 Tool limitations ... 17 2.9.2 Conclusions ... 183
Qualitative safety assessment approach ... 19
3.1
Approach and main assumptions ...20
3.1.1 Driving functions ... 20
3.1.2 Types of accident ... 25
3.1.3 Road environments ... 26
3.1.4 The approach ... 26
3.2
The safety assessment tool ...27
3.3
Concepts for an extended tool ...28
3.3.1 Embedding of the tool into the CoEXist approach ... 30
3.3.2 Results ... 31
3.3.3 What the user would need to do ... 31
3.3.4 Metric specification ... 33
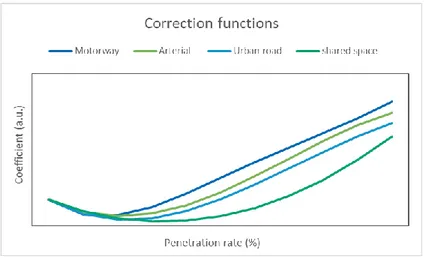
3.3.5 One step deeper: conversion to qualitative assessment and sensitivity analysis36 3.3.6 Behaviour of the tool as a function of the penetration rate ... 37
3.4
Conclusion safety impact assessment tool ...38
4.1
Approach ...39
4.1.1 Current situation ... 40
4.1.2 Automated scenarios ... 46
4.1.3 Comparison ... 48
4.1.4 Conclusions ... 49
4.2
Overview of the application of the methodology ...49
4.3
Conclusion for the safety inspection-based assessment methodology ...52
5
References ... 53
6
Partners ... 55
Appendix A - Extraction of performance metrics ... 56
1
Inputs ... 56
1.1
Storing of vehicle and pedestrian records ...59
2
Outputs ... 61
3
The scripts ... 62
3.1
Script descriptions ...62
3.2
Extract_tot_space_time ...63
3.3
Main.py ...63
3.3.1 LoadData.py ... 63 3.3.2 Metrics.py ... 633.4
Running the scripts ...64
4
Step by Step Instructions ... 65
1 Introduction
A key goal of the CoEXist project is to enable local road authorities and other urban mobility
stakeholders to evaluate the impact of the introduction of connected and automated vehicles (CAVs). One part of achieving this goal is the development of extended traffic models able to model traffic with various mixes of different types of CAVs, as presented in CoEXist deliverables D2.10/D2.11 and D2.7/D2.8. However, there are large uncertainties associated not only with the behaviour of the automated vehicles and the reactions of non-automated road users to the CAVs, but also the rate of introduction of various types of CAVs into the vehicle fleet. These uncertainties make interpreting the output of traffic models significantly harder.
The aim of this document is to present the approach that has been used in CoEXist, that in a structured and sound way can be used by road authorities to assess the traffic impact of automation on a given road design, traffic controllers, regulations, etc. The traffic performance and space efficiency assessment approach utilizes outputs from automation-ready transport modelling tools as input. The traffic models are applied to a set of consistent experiments with respect to penetration rates and different mixes of AV classes, as described in deliverable D3.1. Relevant performance metrics, presented in deliverable D3.2, are calculated from the model outputs and used to assess the traffic impact of automation in terms of traffic performance for different infrastructure designs. An essential functionality of the assessment approach is to consider and visualize effects of the large uncertainties with respect to how different types of AVs might behave and which mixes of different types of AVs that are likely to CoEXist at different stages of the transition period towards full automation.
Assessing traffic safety based on traffic models is difficult and in addition to the traffic performance and space efficiency assessment tool, two different safety assessment tools are developed: one qualitative safety assessment approach, which assess potential safety effects in relation to the accident types and automation functions that are relevant for an infrastructure design; and one more detailed safety
assessment approach based on safety inspections. These two safety assessment approaches are not relying on the results of modelling tools and can be used independently
1.1 Structure of the deliverable
This deliverable consists of five different parts of which this report is one part. The other parts are: • Scripts for calculation of the traffic performance and space efficiency metrics specified in D3.2
(Olstam et al., 2019) based on outputs from a microscopic traffic simulation model
• A spreadsheet-based tool for calculation of use-case specific impacts on traffic performance and space efficiency based on microscopic traffic simulation outputs (Traffic performance and space efficiency assessment tool - micro.xlsm)
• A spreadsheet-based tool for calculation of use-case specific impacts on traffic performance based on macroscopic traffic model outputs (Traffic performance assessment tool – macro.xlsm + assessment_tool_input.xlsx)
• A spreadsheet-based tool for qualitative safety estimations of traffic safety effects of different AV-functions for a specific use-case (Qualitative safety assessment tool.xlsx)
The scripts and the spreadsheet-based tools are available for download at the CoEXist webpage, https://www.h2020-coexist.eu/.
1.2 Relation to other CoEXist deliverables
The assessment tool presented in this report constitute an important step in achieving the CoEXist goal of enabling automation-ready transportation and road infrastructure planning. The tool uses the output of the models presented in D2.10 / D2.11 (Sukennik, 2020a, Sukennik, 2020b) and D2.7 / D2.8
(Sonnleitner and Friedrich, 2018, Sonnleitner and Friedrich, 2020) to assess the traffic impact of automation in terms of the metrics presented in D3.2 (Olstam et al., 2019). The models and the
assessment tool are applied to the eight CoEXist use cases specified in D1.3 (Olstam and Johansson, 2018a), D1.4 (Olstam and Johansson, 2018b), through applications of the experimental designs
specified in D3.1 (Olstam, 2018) to the use case models presented in D4.1 (Liu and Olstam, 2018), with the results of the assessment tool for the eight use cases that will be presented in D4.3.
1.3 Outline
As described in section 1.1, the tool presented in this report consist of several components. These can be grouped into two parts: the quantitative evaluation of traffic performance and space efficiency, and the qualitative assessment of traffic safety effects. In chapter 2 the traffic performance and space efficiency part, both for macroscopic and microscopic models, is presented, including required inputs, produced output, and a detailed step-by-step guide to applying the tool. Also, a brief discussion on the limitations of the tool and some conclusions are provided. In chapter 3 the qualitative traffic safety assessment part of the assessment tool is presented, including a description of the general approach to qualitative safety assessment taken, a discussion around the assumptions underlying the tool, and a description of how it is meant to be applied. A more detailed safety assessment approach based on safety inspections is presented in chapter 4.
2 Traffic performance and space efficiency
assessment tool
2.1 Metrics and thresholds for traffic impact of automation
Previous studies that have been conducted with a focus on automation or ADAS (Advanced Driver Assistance Systems) show that the metrics of interest do not differ much from those used in traditional applications of traffic modelling. This indicates that all the usual metrics may be suitable to measure the traffic performance implications of the automation. However, when applying metrics to calculate a performance difference, care must be taken to compare the metrics for corresponding classes of road users. Various travel time-based metrics are commonly used to evaluate traffic performance. In this case the problem is twofold: firstly, value of time for automated vehicles is likely to differ, possibly significantly, from that of other road users due to the possibility to engage in other activities during the ride. Thus, comparing the travel time for all cars, including AVs, to a baseline with no AVs may result in a misleading
quantification of the traffic impact of automation. Therefore, it is recommended to mainly consider the effects on the traffic performance of non-automated modes when evaluating the traffic impact of
automation on traffic performance. An important effect of this is also that total delay for conventional cars is problematic to use as a metric of the traffic impact of automation, since the number of conventional cars decreases when the penetration rate of automated cars increases. Thus, averaged metrics are used instead of total.
Many road authorities have policies to prioritize active modes above private cars in traffic planning. This often implies that a road authority can accept a marginal decline in traffic performance for private cars to achieve an improvement for pedestrians and cyclists. However, the details of such policies differ
between road authorities. To allow road authorities to define thresholds of acceptable decline for
different modes and road users, the assessment of traffic impact of automation should be conducted per mode or road user category (e.g. pedestrians, bikes, conventional cars, automated cars, etc.). For example, in order to ensure that the introduction of AVs do not counteract mobility goals on prioritization of walking, cycling and public transport over private cars.
To summarize, the traffic impact of automation on traffic performance is assessed by comparing the relative improvement in a performance metric for a specific road user category for a case with a specific penetration rate and mix of AVs with the baseline case of no AVs. This relative improvement is then compared to the road authority requirements, e.g. no acceptance on decrease in improvement for pedestrians, bikes or buses but 5% decrease in performance for cars.
2.2 Handling uncertainties related to the transition period
Traffic models have traditionally been applied to investigate traffic performance of different road or traffic control designs. In such applications the driver population is assumed to be constant for all investigated design alternatives. When assessing the traffic impact of automation, it is instead the infrastructure that is constant and the driver population that changes. The pace of changes of the mix of driving behaviours is highly uncertain. Thus, there is a need to consider several possible AV behaviours and that these different types of AVs might CoEXist. The combinations of penetration rates for several types of AVs lead to a large space of possibilities, too large for exhaustive exploration to be feasible. To confine the possible combinations of penetration rates it is assumed that both penetration rate of AVs and the level of automation will increase during the transition period towards full automation. That is, as time goes by, the penetration rate of AVs will increase, and the AVs will become more capable. This reduces the two-dimensional space of possibilities to a one-two-dimensional space. Furthermore, we explore the resulting space in steps as described below.
When conducting investigations of the transition period the mixes of different AVs should be taken into consideration. Depending on the assumptions made on the behaviour of AVs the resulting estimate of capacity, delay, travel time, etc. will vary significantly. The transition period is therefore suggested to be divided into a limited set of stages (not defined in terms of specific number of years in the future, but rather by the level of automation). In CoEXist three stages have been defined and are presented in the bullet points below. For more information on the different stages and what type of AV mixes to be expected in the different stages see D3.1.
• Introductory: Automated driving has been introduced, but most vehicles are conventional cars. Automated driving is in general significantly constrained by limitations (real or perceived) in the technology.
• Established: Automated driving has been established as an important mode in some areas. Conventional driving still dominates in some road environments due to limitations (real or perceived) in the technology.
• Prevalent: Automated driving is the norm, but conventional driving is still present. Further it is recommended to define a set of consistent experiments within each stage. These
experiments should specify which penetration rates and which mixes of different AV behaviour that can be expected to be present during each stage. The experiments can, and should if necessary, also include variations of other uncertain variables as e.g. transport demand and behavioural adaptation of non-automated road users. The result of this is an experimental design defining each
experiment/scenario that is being conducted. Details about the experimental design are presented in D3.1 (Olstam, 2018) and section 2.5.2 gives an overview of the experimental design and the functionality of it in the traffic performance and space efficiency assessment tool.
Traffic model runs are conducted for all the combinations of uncertain factors specified by the
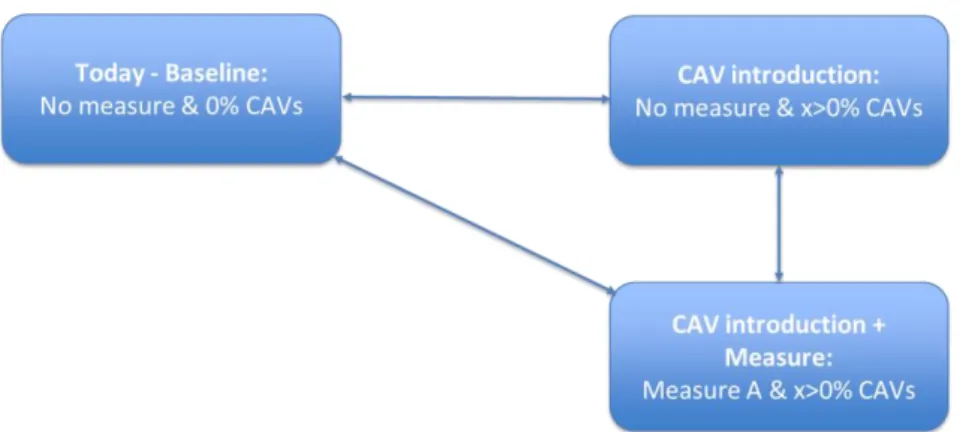
experimental design and the output is used to calculate the traffic impact of automation, i.e. the relative improvement in the performance metrics for each case with AVs and compare it to the baseline without any AVs. The comparisons of interest are shown in figure 1.
The results from the simulation experiments belonging to the same stage of CoEXistence can be seen as “samples” of the traffic impact of automation during that stage. The traffic impact of automation at a specific stage is presented in terms of the median, the minimum, and the maximum values for that stage, to compactly represent the results, including the uncertainty. In order to determine whether the traffic impact of automation is acceptable at a given stage, these values can be compared to the acceptable thresholds defined by the cities or road authorities.
The aim of the traffic performance and space efficiency assessment tool is to present the expected traffic impact of automation for each stage in a comprehensible manner, clearly showing the impact on traffic performance and space efficiency and it’s relation to the mobility goals that are defined by the cities and road authorities.
The comparisons are made with the baseline to see if there’s any relative improvement, for the defined metrics, by the introduction of CAVs. The same comparison is done for the cases where CAV’s are introduced together with potential infrastructural measures to be investigated. The tool then allows for a visual comparison between the cases with only CAVs and with CAVs and the implemented measure.
2.3 Tool structure overview
The assessment tool is excel based and all calculations are done with formulas or array formulas. Macros are applied in order to import the experimental design and to import metric values. For micro simulation cases, a script has been provided to extract the metric values from the simulations. As for macro cases there is a template where values can be imported from the several skim matrices. Due to the properties of excel the tool is “sheet/tab based” where the different sheets are colour coded, representing different functionalities within the tool. There are two versions of the tool where one is meant to be used for analysis with microscopic models and the other for cases where macroscopic models have been applied.
Both of the tools have introductory sheets providing the user with necessary base information about CoEXist, and a small compact step by step guide on how to use the tool. Both the tools are similar to each other in regard to design and the methodology used in order to assess the traffic impact of automation. However, there are some differences that are clarified in the upcoming sections.
2.4 Development process
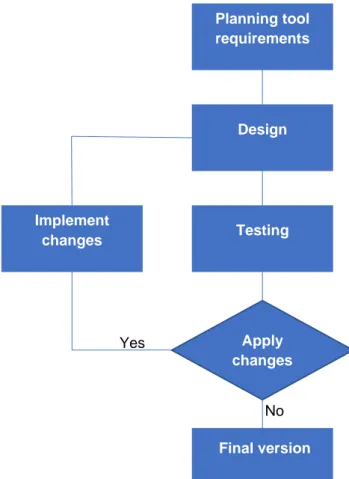
As the final version of the tool is going to be accessible for external parties one important aspect of the tool is its usability. To ensure user friendliness and eliminating any potential bugs or faults, several versions of the tool have been circulated to the parties involved in CoEXist. This has allowed for preliminary tests of the tool and also allowed actual end users to give feedback on both design and functionality. The development process is illustrated in figure 2.
Figure 2 Development process
The iterative process of testing the tool showed to be beneficial, as feedback from the parties has given insight in lacking features of the early versions as well as design recommendations. Some of the
implemented changes during the development process are listed in the bullet list below.
• Added functionality for importing data generated from both microscopic and macroscopic models. • Added comparison flexibility, allowing the user to compare any two experiments.
• Increased user control over figure details. • Colour scheme changes.
2.5 Input
The input to the tool can be classified into two different types of input.
1. The experimental design: which gives information of each individual experiment and defines the
order of the experiments in the scenario management structure in Vissim and Visum.
2. Numeric inputs: which are the results from each experiment and gives information of the
networks performance given a specific configuration.
Both the macro and micro version of the tool utilizes an experimental design and numeric inputs for further calculations and assessment of the traffic impact of automation in the studied area. There is also a python script developed to extract performance metrics from micro simulations performed in Vissim. Extraction of the relevant values in Visum, on the other hand, is done manually.
Final version Planning tool requirements Design Testing Implement changes Apply changes ? No Yes
2.5.1 Considered metrics
The evaluation is done with regards to specified metrics defined within CoEXist, presented in D3.2 (Olstam et al., 2019) and summarized in the bullet lists below.
For microscopic models:
• Served demand ratio • Average travel time
• Average travel time per distance unit • Average delay
• Vehicle hours travelled • Person hours travelled • Average space claim
• Average space time footprint • Average space time utilisation
For macroscopic models:
• Average travel time
• Average travel time per distance unit • Average delay
• Vehicle hours travelled • Person hours travelled • Vehicle kilometres travelled • Person kilometres travelled
The tool is limited to assess the traffic impact of automation at a site with the presented metrics as a base.
2.5.2 Experimental design
There are many uncertainties related to autonomous vehicles and the introduction of them into the traffic system. As mentioned in section 2.2 an experimental design is created in order to systematically capture a large space of potential future scenarios.
In the experimental design, different experiments are set up in order to be able to make an assessment of the studied area. The experimental design determines the number of experiments needed and the configuration that should be applied to each experiment.
Each experiment configuration in the experimental design is, and needs to be, unique since the tool utilizes this feature when performing calculations. The variables of an experimental design are presented in the bullet list below:
• AV penetration rate configuration: Penetration rate of AV for each transport user class, is dependent on the stage of automation. It is stated in combination with the actual stage. Where the stage is described in text and the penetration rates in parenthesis.
• AV-class configuration: The AV-class is dependent on the stage of automation. It is stated in combination with the stage where the stage is described in text and the ratios of the different AV-classes are given in the parenthesis.
• Demand configuration: The traffic demand, stated as a number, should be described further in another sheet in the same file or in a separate document.
• Non automated road user behaviour: How the behaviour of non-AV road users is changed due to introduction of automated vehicles is stated as not changed (normal), aggressive or passive behaviour. The definition of each non-AV behaviour is case specific and should also be described in a separate sheet in the same excel file or in a separate document.
• Measures: Potential measure to be investigated (i.e. legislation or infrastructural changes). The measures are also stated as numbers or “no” and should also be described in another sheet in the same excel file or in a separate document.
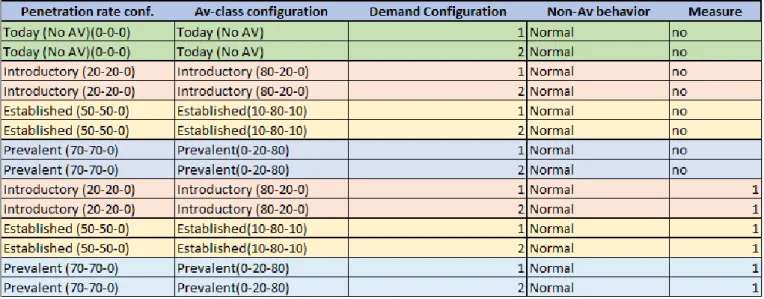
The other function of the experimental design is to define the order of how simulations are carried out in Vissim. This is of importance since the different metrics that are used for the assessment need to be associated with the corresponding experiment. For a more detailed overview on how this could be structured see Appendix A. Figure 21 and Figure 22 show an example of how the experimental design could be structured.
Figure 4 Example 2 on experimental design sorted on stage
2.5.3 Value extraction script (Micro)
Scripts for extraction of the different metrics have been developed, partly to facilitate the workflow for the different parties involved in the project, but also to ensure that the metrics are computed coherently throughout the different use cases in the project. By following the instructions given in Appendix A it is possible to get the relevant metrics that are needed when using the tool. The values for each metric are given in an excel file which corresponds to the 4 input sheets in the tool. These are named “Traffic
Performance Input data”, “Traffic Performance STD”, “Space Efficiency Input data”, and “Space efficiency STD”. In addition, one tab in the output from the script gives additional columns with the
number of served vehicles which are used in the tab named “Quality check”. For details on how to use the scripts read appendix A.
2.5.4 Value extraction (Macro)
For the macroscopic cases a template of how to structure the values of the metrics is provided. The template is excel based and named “assessment_tool_input.xlsx”. Using the template is not mandatory as values can be pasted directly into the tool by the user. However, structuring the
performance metrics from the macroscopic model in the template allows the user to utilise the built-in function to import the values from the “assessment_tool_input.xlsx”.
2.6 Output
Since there are two versions of the tool where each version corresponds to either an assessment of a microscopic simulation case or a macroscopic simulation case there’s also some differences in the output from the two tools. The expected output from both of the tools is explained in this section.
2.6.1 Quality check (micro)
As stated in section 2.5.1 one of the performance-metrics in a microsimulation case is the served demand ratio. Together with a calculation of how many simulation iterations are needed, these two values establish a form of initial check, indicating if the capacity of the network is enough and if more simulation iterations per experiments are needed.
2.6.2 Automation Impact (micro/macro)
As the main purpose of the tool is to assess the traffic impact of automation at an investigated site, the relative improvement of performance metrics compared to the baseline for each experiment is presented in the sheet “Automation impact”. The tool will automatically generate the relative improvement
considering the default baseline, which in general would be the present network with the same demand configuration and non-AV behaviour, see Figure 1 for clarification. However, the tool provides a
possibility of adding a customised baseline, meaning that the user can select any of the experiments as a baseline.
2.6.3 Score Cards (micro/macro)
The traffic impact of automation is computed for each transport user class, metric, and experiment. In order to give the user an overview of the metrics and transport user class of interest, the tool provides the user with score cards. The function of these is to give a range of the traffic impact of automation in each stage, for each measure, metric and transport user class. Each score card generates a mean and median value along with the minimum and maximum value of each stage, and the selected measure, metric and transport user class. In addition, there is also an option to select a relative improvement threshold which would indicate the minimum accepted level of the traffic impact of automation for the specific case.
In the sheets next to each score card there are sheets providing the user with figures which visualises the median relative improvement as bars and the min and max values as error bars. The threshold of minimal accepted level of improvement is depicted in the figures as a horizontal line over each group of bar/bar.
The limitation to the score cards lies in how many performance measures, transport user classes or measures that can be portraited in the same figures, as for now the limit is set to eight.
The difference between the score cards lies in how they relate to the layout of the figures and how the relative improvement threshold is set. Score card 1 generates figures where all three stages are visualized together, and one threshold is set over the three stages. In contrast, score card 2 generates figures for each stage where the threshold level can be set independently for each stage, metric, measure and transport user class.
2.7 Other possibilities
In general, the tool can be considered to be rather static and confined to do the comparisons that are defined within the CoEXist project. This could be considered a drawback of the tool, since other comparisons could be of interest. In order to enable some flexibility in what experiments that are compared to each other there’s a “Customised Baseline” column which can be used.
As each experiment generates a unique key, this can be used in order to define a new baseline which is then possible to select for computations of the relative difference between the defined performance indicators.
2.8 Step by step guide
To compliment the overview of the tool, a detailed step by step guide on how to use the tool is presented in this section. Following each step thoroughly is crucial in order to get the desired output, putting
information in the wrong cell or in the wrong format into the tool, will cause errors or give results that are wrong which in turn will lead to misinterpretations.
2.8.1 Step 0
Before starting with the actual tool, there’s a couple of prerequisites that need to be fulfilled. 1. Create an experimental design in accordance with section 2.5.2.
2. Run simulations. Use scenario management functionality in Vissim/Visum and let each experiment be configurated so that it matches each row in the experimental design.
3. Micro: Extract vehicle/pedestrian records from Vissim. Specifications on what attributes that are needed can be found in table 3 in Appendix A.
Macro: Extract relevant skim matrices.
4. Micro: Run the provided python script to calculate traffic performance and space efficiency metrics and get a new file called “Assessment_tool_input.xlsx”.
Macro: Fill the template “Assessment_tool_input.xlsx” with values from macro simulations.
5. Save the tool, the experimental design and your “Assessment_tool_input.xlsx” in the same folder.
6. Create a copy of the tool, just in case. 7. Open the assessment tool.
2.8.2 Step 1a
1. In the info tab of the tool, insert the name of your experimental design. The name has to be correct otherwise the tool will fail in importing the experimental design.
2. Go to the tab named “Generate Data” and press the two buttons that are there for importing the
necessary data.
3. Copy all the experiments except the baseline experiments and paste them in the tab “Automation Impact”, starting in column B.
4. Type the stage, “Introductory”, “Established”, or “Prevalent” in the corresponding row in column A. It is important that the stages are typed in correctly and that there are no spaces in the beginning of, or at the end of each word.
2.8.3 Step 1b
Micro:
1. Assuming that the provided python script has been executed and the data has been imported correctly into the tool the user can now go to the tab “Quality check” and insert the demand of
each experiment. This has to be done manually and is used in order to calculate the “SDR” (served demand ratio). The default threshold for accepted SDR is set to 0.9 but can be changed by the user in cell R3.
2. Cell T3, U3 and V3 are dedicated to the parameter values used to calculate number of simulation iterations needed according to equation (1).
In this step there might be a risk of the number of simulations iterations being too little and therefore new simulations may be carried out.
𝑛 = (𝑠𝑖∗𝑡𝛼 2⁄ 𝑥̅ ∗𝜖𝑖 )
2
(1)
where:
𝑛 = the number of iterations needed 𝑠𝑖 = standard deviation of measure 𝑖
𝑡𝛼 2⁄ = critical 𝑡 value from t − distribution table for confidence level of 𝛼 2⁄ 𝜖 = percental error margin
Macro:
Step 1b is not relevant for any macro case.
2.8.4 Step 2
1. Assuming that everything in step 1b passes the initial checks, the next step is to choose what metrics, modes and measures to analyse. These are selected in drop down lists in the different score cards which are located under the tabs “Score Card 1” and “Score Card 2”.
2. Next the relative improvement threshold is chosen. In “Score Card 1” the relative improvement threshold is located in column E. Selecting a threshold here will affect the figures connected to this score card where the relative improvement threshold spans over the 3 stages. In contrast, the relative improvement threshold in “Score Card 2” is located in columns G, M and S. The threshold is here chosen for each stage and selecting a threshold here will have an effect on the figures associated with this specific score card.
2.9 Discussion
2.9.1 Tool limitations
Even though the tool has been completed successfully and has increased its functionality since the initial versions, there are still some limitations with regards to the technical capabilities and also in the
assessment of the traffic impact of autonomous vehicles.
Firstly, the tool can handle a maximum of 200 experiments, which is approximately 50 experiments per stage, (Today, Introductory, Established, and Prevalent). For the needs within the project this has been enough since no use case has more than 200 experiments in its experimental design. However, there might be a need of handling a larger number of experiments in other projects. In case more experiments
are needed, it is possible to extend the areas where the computations are made. This will have no other effect on the tool except allowing it to handle an extended number of experiments.
The score cards and figures are limited to display 8 results from each stage of coexistence and shows the impact of the introduction of autonomous vehicles in regard to the traffic performance and space efficiency metrices defined in D3.2. As the approach for the qualitative safety assessment differs from the one applied here to the traffic performance and space efficiency metrics, this is done in a separate tool. For more details on the qualitative safety assessment see chapter 3.
2.9.2 Conclusions
The traffic performance and space efficiency assessment tool is essentially a practical application of the theoretical approach, described in section 2.2, of how to assess the potential impact that autonomous vehicles are going to have on a given site. The iterative development process in which different versions of the tool have been tested have contributed to the implementation of features that were not originally considered and have increased the functionality of the tool, resulting in a user friendly excel based interface.
An important strength of the assessment approach and the implementation of the tool is that it is not CoEXist specific, meaning that practitioners within the field can apply the assessment approach and the developed tools to their specific use cases, using common microscopic and macroscopic modelling tools.
The tool produces results in the form of score cards and figures showing the relative improvement of specified metrics per stage and transport user class, illustrating two aspects of the impact that automated vehicles can potentially have on the transportation system.
3 Qualitative safety assessment approach
Connected & automated vehicles’ (CAVs) safety is generating a lot of interest from the transportation industry, policymakers, and the public as well. Determining how safe CAVs should be before allowing them on the roads will influence how CAVs are introduced onto the market and, therefore, how cities need to prepare for this entry (Kalra and Groves, 2017).
Road safety relies traditionally on accident statistics as main data source. For many reasons, such as the lack of data, the fact that accidents are rare events and often the result of a series of unhappy realisations of many small probabilities; current road safety studies are challenging (Laureshyn et al., 2010). Therefore, studying CAVs safety, for which very few data are available and a large part relies on projections of what CAVs will be, can only be extremely challenging!
Some attempts of accident analysis can however be found: Dixit et al. (2016), for example, studied the number of disengagements and the reaction times for data collected in California between September 2014 and November 2015. Favarò et al. (2017) studied the accident reports from data collected between September 2014 and March 2017 from the same database in California (Favarò et al., 2017). However, all these articles are relying on very few data, their results and conclusions are, therefore, lacking statistical significance.
Another approach for quantifying safety impacts, based on results of microscopic simulation, is the so-called surrogate safety assessment model (SSAM)1. It automatically identifies safety conflicts based on trajectory data of the simulation and calculates several indicators, so called surrogate safety measures, for each of the conflicts. Based on thresholds for surrogate safety measures or correlations between surrogate safety measures and accident indicators, it is then possible to quantify the accident situation for the analysed road site. A US team (Kockelman et al., 2016) has been running a very similar study to what CoEXist is aiming at, and estimated how many crashes per year are likely to occur on different road configurations given different rates of AV market penetration. However, many limitations are linked to the use of SSAM, such as the fact that conflict analysis is sensitive to the model:
• The number of conflicts is very sensible to the model: small changes in the geometric specification of road links has an influence on the number of conflicts.
• The model in Vissim might not be an accurate model of AV behaviour2. • One needs to define thresholds without data available to define them.
• It could end up very time-consuming for the cities/the modellers to perform such an analysis for a very rough output.
• It focuses on one type of source of accident: vehicles crashes.
For all the reasons mentioned above, SSAM has not been chosen for the impact assessment developed in CoEXist, but a third approach, similar to the one presented in Rösener et al. (2018), has been selected. The approach focuses on the analysis of driving functions. Scenarios which are potentially affected by the
1 SSAM has been developed by the Federal Highway Administration (FHWA)
2 The way automated cars are modelled in PTV Vissim is to best of the current knowledge and the data made available within the project. There is however no possible calibration since there are no actual automated cars on the road at this point of time. The accuracy of the model can therefore at the moment not be verified.
respective driving function are identified. Afterwards the impacts of the respective driving function on accidents (severity and number of accidents) of the respective scenarios are analysed by accident simulations. Finally, the impacts of each driving function are extrapolated on national level. This approach has recently been applied to Germany to assess the impacts of driving functions on German roads. The results of these studies will be published soon, hence not available for CoEXist.
Since assessing safety impacts quantitively is problematic, the project partners of CoEXist have been working on a qualitative assessment instead, following the general ideas of the above-mentioned approach but not going that much into detail: Conflict situations incorporating boundary conditions such as road environment, road characteristics, type of accident, etc. which are potentially addressed by the driving functions that are identified and a qualitative assessment of the impacts of each driving function on road safety is carried out.
3.1 Approach and main assumptions
3.1.1 Driving functions
In the literature one can read many claims such as “In Europe and the United States, about 90-95% of road crashes are due to human errors” (Fagnant and Kockelman, 2015). The hope is that by replacing human drivers by automated cars, one could decrease the number of accidents by the same share. Obviously, that is assuming that the human errors are not going to be replaced by new types of error (Utrainen, 2018).
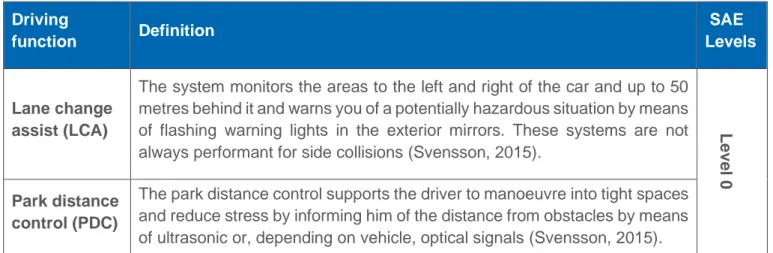
In the present work, it is considered that human drivers will be step by step replaced by automated cars through driving functions. What differentiates today’s cars from automated cars is that the driving functions will be more and more sophisticated and have more and more control over the vehicle. 22 driving functions that are thought to be representative have been chosen as shown in Table 1.
Table 1 Driving function chosen for the safety assessment tool with their definition and corresponding SAE Level (SAE International, 2018) Driving function Definition SAE Levels Lane change assist (LCA)
The system monitors the areas to the left and right of the car and up to 50 metres behind it and warns you of a potentially hazardous situation by means of flashing warning lights in the exterior mirrors. These systems are not always performant for side collisions (Svensson, 2015).
Le
ve
l 0
Park distance control (PDC)
The park distance control supports the driver to manoeuvre into tight spaces and reduce stress by informing him of the distance from obstacles by means of ultrasonic or, depending on vehicle, optical signals (Svensson, 2015).
Lane departure warning (LDW)
Lane departure warning helps to prevent accidents caused by unintentionally wandering out of lane and represents a major safety gain on motorways and major trunk roads. If there is an indication that the vehicle is about to leave the lane unintentionally (without using the blinkers), the system alerts the driver visually and in some cases by means of a signal on the steering wheel (Svensson, 2015).
Forward collision warning (FCW)
The forward collision warning monitoring system uses a radar sensor to detect situations where the distance to the vehicle in front is critical and helps to reduce the vehicle’s stopping distance. In dangerous situations the system alerts the driver by means of visual and acoustic signals and/or with a warning jolt of the brakes. Front collision warning (FCW) operates independently of the ACC automatic distance control. Forward collision warning best detects vehicles in front of you. However, not all features will be capable of detecting motorcycles, bicycles, pedestrians, some farm machineries and other vehicles smaller than a car (Svensson, 2015).
Blind spot monitoring
Blind spot monitoring detects objects in the driver's blind spot and informs/warns them of a potential collision when they intend to change lanes. Optimised for motorway, does not work well for very fast speed vehicles and slow-moving vehicles like VRUs (VDA Magazine, 2015).
Intelligent speed assist (ISA)
Intelligent speed assist (ISA) is a safety technology that alerts drivers when they exceed the speed limit. ISA activates when a driver exceeds the posted speed limit for a section of road by a set speed (e.g. 2km/h or more). Audio and visual warnings remind the driver if they are going too fast. ISA can also be fitted with a speed limiting function which increases the pressure on the accelerator when you exceed the posted speed limit, making it harder to accelerate (Svensson, 2015).
Adaptive cruise control (ACC)
The cruise control system with “Adaptive distance control ACC” uses a distance sensor to measure the distance and speed relative to vehicles driving ahead, usually using perception information coming from cameras and lasers. The driver sets the speed and the required time gap with buttons on the multifunction steering wheel or with the steering column stalk (depending on model). The target and actual distance from following traffic can be shown as a comparison in the multifunction display. Does not have the capability to stop the car on its own, only to reduce the speed (Svensson, 2015).
Le
ve
Park assist (PA)
Park assist automatically steers the car into parallel and bay parking spaces, and out of parallel parking spaces. The system assists the driver by automatically carrying out the optimum steering movements to reverse-park on the ideal line. The measurement of the reverse-parking space, the
allocation of the starting position and the steering movements are
automatically undertaken by park assist – all the driver must do is operate the accelerator and the brake. This means that the driver always retains control of the car (Svensson, 2015).
ACC including stop & go
Adaptive cruise control with stop & go function includes automatic distance control (control range 0–250 km/h) and, within the limits of the system, detects a preceding vehicle. It maintains a safe distance by automatically applying the brakes and accelerating. In slow-moving traffic and
congestion, it governs braking and acceleration (Svensson, 2015).
Lane keeping assist (LKA)
Lane keeping assist has a typical speed range comprised between 65 and 180 km/h (VDA, 2019). The system detects the lane markings and works out the position of the vehicle. If the car starts to drift off lane, the LKA takes corrective action. If the maximum action it can take is not enough to stay in lane, or the speed falls below 65 km/h LKA function warns the driver (e.g. with a vibration of the steering wheel). Then it's up to the driver to take correcting action (Svensson, 2015).
Vulnerable road users safety systems
Vulnerable road users (VRU) detection systems are mostly used for urban environment. VRUs are considered vulnerable road users, since they are not protected and even not aware about the dangerous situations. The pedestrian detection can be classified like a collision warning system (CWS, Level 0). However, since the reaction time of the driver is slow (around 2 seconds), these systems usually have access to the brake system (longitudinal control). For speed around 40 km/h (Svensson, 2015).
Automatic emergency steering & autonomous emergency braking (AES & ABS)
The automatic emergency steering & autonomous emergency braking systems can apply emergency braking when it determines that an accident is unavoidable, helping the driver to avoid a potential collision. When the system detects the risk of collision with an obstacle in front that cannot be avoided by braking only, it determines a direction without an obstacle (an escape zone). It then automatically steers the vehicle to help avoid a collision.
The primary goal of the technology is to prevent crashes by detecting a potential conflict and alerting the driver, and, in many systems, aiding in brake application or automatically applying the brakes.
Level 2
Park assistance
Partial automated parking into and out of a parking space, working on public parking area or in private garage. Via smartphone or key parking process is started, vehicle accomplishes parking manoeuvres by itself. The driver can be located outside of the vehicle, but must constantly monitor the system, and stop the parking manoeuvre if required (Svensson, 2015).
Traffic jam assist
The function controls the vehicle longitudinal and lateral to follow the traffic flow in low speeds (ca. 50 km). The system can be seen as an extension of the ACC with stop & go functionality (Svensson, 2015).
Highway driving assistant
The driving function "highway driving" assumes lateral and longitudinal control during highly automated driving on motorways up to 180 km/h. The driver must consciously activate the system but does not have to monitor it at all times. Under certain circumstances the system prompts the driver to resume control. No lane changes possible (can be completed by an automatic lane change for speed range of 60 to 130 km/h, not considered here) (VDA Magazine, 2015).
Traffic jam chauffeur
Conditional automated driving in traffic jam up to 70 km/h on motorways and motorway similar roads. The system can be activated, if traffic jam scenario exists. It detects slow driving vehicle in front and then handles the vehicle both longitudinal and lateral.
Driver must deliberately activate the system but does not have to monitor the system constantly. Driver can at all times override of switch off the system. Note: There is no take over request to the driver from the system (Svensson, 2015). lev el 3 Highway chauffeur
Conditional automated driving up to 130 km/h on motorways or motorway similar roads. From entrance to exit, on all lanes, incl. overtaking. The driver must deliberately activate the system but does not have to monitor the system constantly. The driver can at all times override or switch off the system. The system can request the driver to take over within a specific time, if automation gets to its system limits (Svensson, 2015).
Parking garage pilot
Highly automated parking includes manoeuvring to and from parking place (driverless valet parking). In parking garage, the driver does not have to monitor the system constantly and may leave once the system is active. Via smartphone or key parking maneuverer and return of the vehicle is initiated (Svensson, 2015). Le ve l 4 Motorway pilot
Automated driving up to 130 km/h on motorways or motorway similar roads from entrance to exit, on all lanes, incl. overtaking. The driver must
deliberately activate the system but does not have to monitor the system constantly. The driver can at all times override or switch off the system. There are no requests from the system to the driver to take over when the systems are in normal operation area (i.e. on the motorway). Depending on the deployment of cooperative systems ad-hoc convoys could also be created if V2V communication is available (Svensson, 2015).
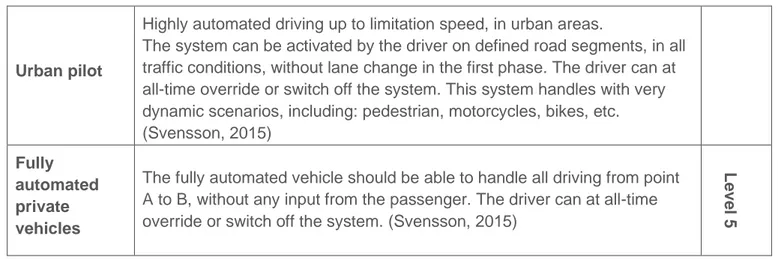
Arterial pilot
Highly automated driving up to limitation speed on arterial roads. The system can be activated by the driver on defined road segments, in all traffic conditions, without lane change in the first phase. The driver can at all-time override or switch off the system. This system handles with very dynamic scenarios, including: pedestrian, motorcycles, bikes, etc. (Svensson, 2015)
Urban pilot
Highly automated driving up to limitation speed, in urban areas.
The system can be activated by the driver on defined road segments, in all traffic conditions, without lane change in the first phase. The driver can at all-time override or switch off the system. This system handles with very dynamic scenarios, including: pedestrian, motorcycles, bikes, etc. (Svensson, 2015)
Fully automated private vehicles
The fully automated vehicle should be able to handle all driving from point A to B, without any input from the passenger. The driver can at all-time override or switch off the system. (Svensson, 2015)
Le
ve
l 5
To avoid counting the same function several times, it is important to identify how the different driving functions are linked to each other as shown in Figure 5.
Figure 5 Link between the driving functions used in the CoEXist safety impact assessment
The figure illustrates how driving functions are included as parts of other more advanced functions. For example: Blind spot monitoring is included in highway driving assistant and highway driving assistant is
included in highway chauffeur. It is important to consider this when evaluating the impacts of a combination of driving functions.
3.1.2 Types of accident
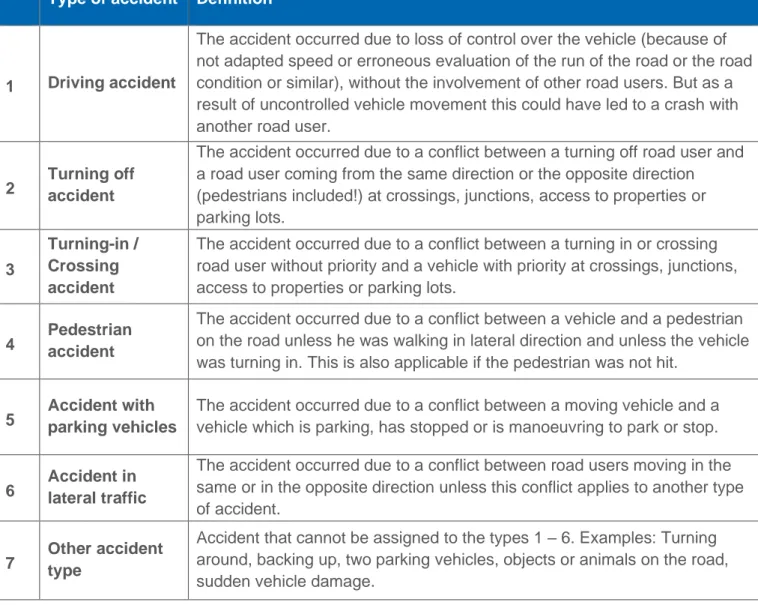
One way of assessing safety is to have a look at conflict situations. There is no harmonized accident type classification used in Europe. However, there are European projects reflecting on this, such as SafetyNET3. In the SafetyNET project, a classification based on types of accident and the German approach (so called GDV4) has been published. The 7 types of accident are explained in Table 2 (See Appendix B – Types of accident for a complete description of all subcategories).
Table 2 The 7 types of accident and their definition. All the definitions are taken from Reed and Morris (2008)
Type of accident Definition
1 Driving accident
The accident occurred due to loss of control over the vehicle (because of not adapted speed or erroneous evaluation of the run of the road or the road condition or similar), without the involvement of other road users. But as a result of uncontrolled vehicle movement this could have led to a crash with another road user.
2 Turning off accident
The accident occurred due to a conflict between a turning off road user and a road user coming from the same direction or the opposite direction (pedestrians included!) at crossings, junctions, access to properties or parking lots.
3
Turning-in / Crossing accident
The accident occurred due to a conflict between a turning in or crossing road user without priority and a vehicle with priority at crossings, junctions, access to properties or parking lots.
4 Pedestrian accident
The accident occurred due to a conflict between a vehicle and a pedestrian on the road unless he was walking in lateral direction and unless the vehicle was turning in. This is also applicable if the pedestrian was not hit.
5 Accident with parking vehicles The accident occurred due to a conflict between a moving vehicle and a vehicle which is parking, has stopped or is manoeuvring to park or stop.
6 Accident in lateral traffic
The accident occurred due to a conflict between road users moving in the same or in the opposite direction unless this conflict applies to another type of accident.
7 Other accident type
Accident that cannot be assigned to the types 1 – 6. Examples: Turning around, backing up, two parking vehicles, objects or animals on the road, sudden vehicle damage.
3http://erso.swov.nl/safetynet/content/safetynet.htm 4 Gesamtverband der Deutschen Versicherungswirtschaft
“To determine the accident type, only the conflict situation which led to the accident is important. If and how road users collided (the accident manner) is of no importance for the determination of the accident type. The mistake of the road users (the accident cause) is basically never of importance. If for example an accident occurs due to a conflict between vehicle and a pedestrian crossing the road, it is a pedestrian accident. This is independent of the following course of the accident (e.g. if the pedestrian was hit or not, if the car leaves the road due to an avoidance manoeuvre, or if the car was hit by following traffic due to harsh braking) and independent of who is to blame for the accident (e.g. if the pedestrian or the vehicle had priority).” (Reed and Morris, 2008)
This classification does not perfectly fit CoEXist’s purposes, mostly because driving functions are not aimed at solving specific types of accident, making the assessment of the efficacity of a driving function on a specific type of accident sometimes difficult. It however presents the tremendous advantage to be well illustrated, understandable and complete.
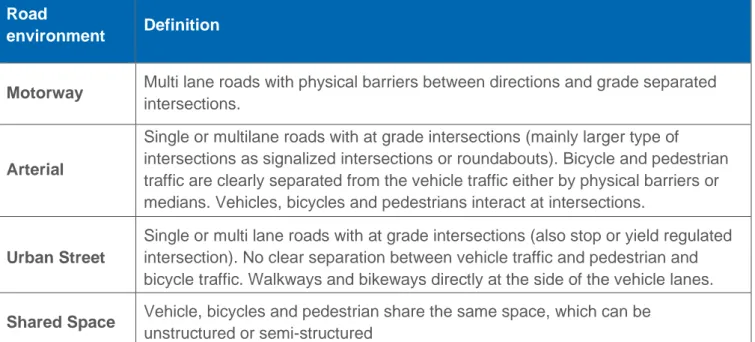
3.1.3 Road environments
The safety assessment tool presented in this document relies on the expected influence of the driving functions on the type of accident. Since not all driving functions and not all types of accident are applicable in all road environments, one should also take the road environment into account. In the CoEXist project, four road environments are considered (see Table 3):
Table 3 The four road environments considered in CoEXist and their definition (Olstam and Johansson, 2018b)
Road
environment Definition
Motorway Multi lane roads with physical barriers between directions and grade separated
intersections.
Arterial
Single or multilane roads with at grade intersections (mainly larger type of intersections as signalized intersections or roundabouts). Bicycle and pedestrian traffic are clearly separated from the vehicle traffic either by physical barriers or medians. Vehicles, bicycles and pedestrians interact at intersections.
Urban Street
Single or multi lane roads with at grade intersections (also stop or yield regulated intersection). No clear separation between vehicle traffic and pedestrian and bicycle traffic. Walkways and bikeways directly at the side of the vehicle lanes.
Shared Space Vehicle, bicycles and pedestrian share the same space, which can be
unstructured or semi-structured
3.1.4 The approach
The approach of the safety assessment is depicted in Figure 6. The approach relies on evaluating the expected impact of the driving function on accident types in combination with the road environment.
Figure 6 Basic approach of the safety assessment tool
Due to the high uncertainty linked with estimating the impact of CAVs on road safety completed with a lack of data, a qualitative impact assessment has been chosen. Furthermore, the accident types – driving functions evaluation contains almost only neutral or positive rating, since it is unexpected that driving functions that are, at least in the long run, jeopardising safety will be brought to the market. The possibility that driving functions enhance the occurrence of some accident type is, however, not excluded and has been identified for very few cases.
Two approaches linked to each other: the second one being the extension of the first one, are described in the present document.
3.2 The safety assessment tool
The safety assessment tool relies on what has been described in part 3.1.It is an excel based advanced filter for displaying the results.
The user can select which accident types and driving functions are relevant for its use case and display the results for each road environment.
This is done in 3 steps:
1. Select the relevant type of accident based on facts or educated guesses on which types of accident are recurrent in the area covered by the use case.
2. Select the relevant driving functions – the one of interest for the use case. 3. Display the results.
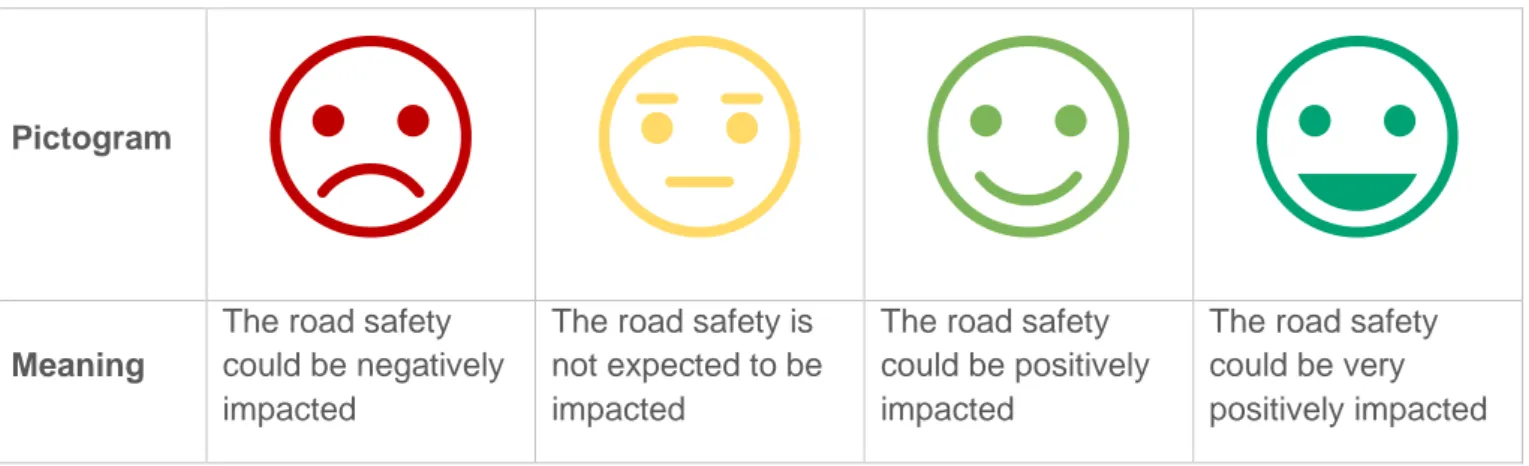
The tool is implemented in a Visual basic for applications (VBA) program, which is fetching the results from a database and giving an indication if the driving function is expected to have a positive, neutral or negative impact on an accident situation for each road environment with the help of the four pictograms shown in Table 4:
Table 4 Pictograms used in the road safety impact assessment tool and their meaning
Pictogram
Meaning
The road safety could be negatively impacted
The road safety is not expected to be impacted
The road safety could be positively impacted
The road safety could be very positively impacted
The database contains the information of the influence of the driving functions on each type of accident for each road environment. The database has been developed by Charlotte Fléchon and Alexander Dahl (PTV Group) and Johan Olstam and Niklas Strand (VTI) based on estimation to the best of their
knowledge. Modifications based on experience or gain of knowledge are expected. The tool gives the results in the form shown in Figure 7:
Figure 7 Screenshot of the road safety impact assessment tool
The tool described above is the tool that has been chosen for the impact assessment of the use cases studied in the CoEXist project.
The following part describes the reflections on an extended tool, more sophisticated, that has not been chosen for CoEXist because of the lack of information to calibrate and validate it. However, since such a concept could be interesting for further research, it has been decided to describe it in the present document.
3.3 Concepts for an extended tool
As mentioned, the safety aspects of traffic are in general challenging to study due to reasons mentioned in section 3. Due to the lack of data with regards to CAVs in every aspect there is no reason to assume
Type of
accident Description Sketch
Lane change assist (LCA) Lane departure warning (LDW) Blind Spot Monitoring [VDA] Adaptive cruise control (ACC) Lane keeping assist (LKA) Highway
chauffeur Motorway pilot
Type 10 In a curve
Type 14 On a straight road
Type 23 Conflict between a vehicle turning off to the right and the following traffic
Type 51 Conflict between a vehicle swinging out to avoid a parking vehicle and a following vehicle.
Type 62 Conflict between a veh. wh. Is braking, standing or going slow due to traffic or non priority and a following vehicle.
that this task would be less challenging. Nevertheless, a method for a safety assessment has been developed.
One of the limitations of the qualitative assessment described above is that it does not consider potential positive or negative safety impacts on neither the surrounding conventional vehicles which are not equipped with the respective driving function nor other road users as pedestrians or bicyclists.
In order to consider these effects which – especially in case of low penetration rates of CAV – might be the determining factor for the safety impacts of a driving function, an overall function has been developed representing those effects. As the approach described in the upcoming sections is a concept, no tool has been developed taking this approach into consideration. This is merely a framework of how such an approach could be used when performing an assessment of the safety aspect when CAV’s are introduced to the system.
The function describing the impacts of the penetration rate is not defined in detail (see Figure 8 ), although it covers the following aspects: The introduction of CAVs with low penetration rates would lead to higher uncertainty and a deterioration of human drivers’ road safety because of unexpected behaviours of the CAVs. This assumption might become plausible if one thinks about CAVs following the all-knowing or rail safe driving logic5: Their driving behaviour will differ widely from the one of conventional vehicles. Furthermore, it is assumed that human drivers would learn to adapt their own behaviour with increasing penetration rates to cope with the behaviour and driving manoeuvres of CAVs. Therefore, it is assumed that road safety for conventional vehicles increases with increasing CAVs penetration rate. The assumption is strong and relies on an educated guess, which means that the functions are not exact but should reflect a trend that is seen as one of many possibilities of what could happen with the introduction of automated cars on different road environments. Furthermore, this function might be refined according to new knowledge gained over time.
An additional assumption is that the more advanced the function, the more safety will be achieved. This assumption stems from the fact that technical failures or misjudgement from the CAVs are not taken into account within CoEXist. Therefore, a driving function with level 3 and control over the vehicle is safer than
5 For more details about the driving logics, please see annex A of D1.4 Scenario specification for eight use cases Olstam, J. and Johansson, F. 2018b. D1.4 Scenario specifications for eight use cases. Deliverable D1.4 of the CoEXist Project.
a driving function level 0 that generates only warnings and does not have any control over the car. Furthermore, neither weather nor road conditions are included. It is however important to bear them in mind as they are both of extreme importance for the well-working of the sensors.
It is assumed that the more complex the environment the later and slower the increase of safety will take place and the probability of an accident will remain higher. This doesn’t reflect the gravity of the accidents. By combining the evaluation of the driving functions and the penetration rate function for relevant conflict situations, a qualitative impact assessment is generated, giving an indication of the change in road safety one could expect.
3.3.1 Embedding of the tool into the CoEXist approach
The assessment tool should also fit to the way the use cases and the scenarios are planned within CoEXist.
First of all, the driving logics are expected to have an influence on the safety, mostly during the transition period. Indeed, if a car is very cautious, one can expect less accident or lighter accidents than if the vehicle is forcing its way. For this reason, each driving logics has a factor whose value has been given arbitrarily, the highest being for the rail-safe driving behaviour and the lowest for all-knowing. Manual driving is assigned a factor of one, since it is the “reference”. Table 1 from deliverable D1.4 has been taken as basis to link the road environment and AV classes to the driving logics.
Table 5 Driving logic for the different road types and AV classes – taken from D1.4
Road type Basic AV Intermediate AV Advanced AV
Motorway C N AK
Arterial C C AK
Urban Street M C N
Shared space M RS C
The penetration rates are also linked to the AV classes, using the same procedure as in D1.4 for example: Table 6 Example for the scenario table, showing the penetration rate parameter that could be used in an extended tool
Scenarios Stage AV penetration basic AV Intermediate
AV Advanced AV 1 Introductory 25% 70% 30% 0% 2 Introductory 25% 70% 30% 0% 3 Introductory 25% 70% 30% 0% 4 Established 50% 0% 50% 50% 5 Established 50% 0% 50% 50%
The safety impact assessment tool is, therefore, embedding the concept of driving logics, stages of coexistence and AV classes developed in the project.
3.3.2 Results
The results could then be calculated, converted in a qualitative indication and displayed separately for each road environment and each stage of coexistence as shown in the Table 7 below.
Table 7 Results
Introductory Established Prevalent
Motorway
Arterial road
Urban road
Shared space
The result reflects the improvement of the safety of the traffic situation and is taking into account, among others, the type of conflict relevant for the scenario, the effect of the driving functions on safety, the penetration rate of the automated vehicles, the correction function. The exact calculation procedure is explained in section 3.3.4. The results are displayed in a qualitative manner, the possible results are: -, 0, +, ++, +++. – reflects a negative impact and +++ a very positive impact.
3.3.3 What the user would need to do
The user must evaluate the importance of each type of accident for the use case he is studying. His evaluation is either based on available accident data, or if none are available on his estimation.
For each type of accident and each road environment, the user must enter a weight as shown in Figure 9. This weight can be derived from the number of accidents or if not available an estimate.
Figure 9 Screenshot of the table that must be fill in by the user depending on the type of accident recurrent for the studied use case.
Additionally, the user needs to define which driving functions he wants as reference and for the different AV classes as shown in Figure 10. Instead of or in addition to AV classes, it is possible to work with a personalised profile.
Figure 10 Driving function specification.
Finally, the user needs to fill in the scenarios with their penetration rates as shown in Table 6. The tool is, therefore, fairly easy to fill in for the user.
3.3.4 Metric specification
The approach explained in the parts above, can be summarised in the metric specification table as followed