Two-Level Multi-Objective Genetic
Algorithm for Risk-Based Life Cycle
Cost Analysis
Yamur K. Al-Douri
Operation and Maintenance Engineering
Department of Civil, Environmental and Natural Resources EngineeringDivision of Operation, Maintenance and Acoustics
ISSN 1402-1544 ISBN 978-91-7790-454-0 (print)
ISBN 978-91-7790-455-7 (pdf) Luleå University of Technology 2019
DOCTORA L T H E S I S
Y
am
ur K.
Al-Dour
i
Tw
o-Le
vel Multi-Objecti
ve Genetic
Algor
ithm for Risk-Based Life Cycle Cost
Two-Level Multi-Objective Genetic Algorithm
for Risk-Based Life Cycle Cost Analysis
Yamur K. Al-Douri
Division of Operation, Maintenance and Acoustics
Luleå University of Technology
Printed by Luleå University of Technology, Graphic Production 2019 ISSN 1402-1544 ISBN 978-91-7790-454-0 (print) ISBN 978-91-7790-455-7 (pdf) Luleå 2019 www.ltu.se
Dedication
to my parents, Professor Kahtan Al-Douri and Tahera Al-Douri, and
to my brothers, Professor Yarub Al-Douri, Doctor Asma Al-Douri and Doctor Yala Al-Douri,
ACKNOWLEDGEMENTS
The research work described in this thesis was carried out at the Division of Operation, Maintenance and Acoustics at Luleå University of Technology (LTU), Luleå, Sweden. First, I express my deepest gratitude to my main supervisor, Professor Uday Kumar, head of the Division of Operation, Maintenance and Acoustics at LTU, who has enriched my knowledge through stimulating discussions and fruitful guidance. You have always believed in me and shown a positive attitude.
I express my sincere gratitude to Professor Jan Lundberg and Doctor Hussan Al-Chalabi, my cosupervisors, for their invaluable guidance, suggestions and support. I am grateful to all in the Swedish Railway Administration (Trafikverket) for their valuable time in meetings in which they shared their experiences and suggestions for design improvement. Specific gratitude is extended to Professor Peter Soderholm, Trafikverket, Professor Nadhir Al-Ansari, LTU, Doctor Ammar Hazim, Chalmers University of Technology, and Doctor Mohammad Ezz-Aldeen, LTU, Doctor Florian Thiery, LTU for helping and sharing their expertise.
I also sincerely and gratefully acknowledge my colleagues (present and past) at the Division of Operation, Maintenance and Acoustics for providing a friendly and open-minded working environment. Special thanks are due to the university administrative support from Rima Al-Soukhni, which is gratefully acknowledged.
I wish to express my sincere gratitude to my dearest parents, Professor Kahtan Al-Douri and Tahera Al-Douri, who have always offered their full support throughout my life and who taught me the meaning of life. Gratitude is extended to my siblings Professor Yarub Al-Douri, Dr. Asma Al-Douri and Dr. Yala Al-Douri. I am thankful for all the support given to me. It would not have been possible to complete this journey without you by my side.
Yamur K. Al-Douri December 2019 Luleå, Sweden
ABSTRACT
Artificial intelligence (AI) is one of the fields in science and engineering and encompasses a wide variety of subfields, ranging from general areas (learning and perception) to specific topics, such as mathematical theorems. AI and, specifically, multi-objective genetic algorithms (MOGAs) for risk-based life cycle cost (LCC) analysis should be performed to estimate the optimal replacement time of tunnel fan systems, with a view towards reducing the ownership cost and the risk cost and increasing company profitability from an economic point of view. MOGA can create systems that are capable of solving problems that AI or LCC analyses cannot accomplish alone.
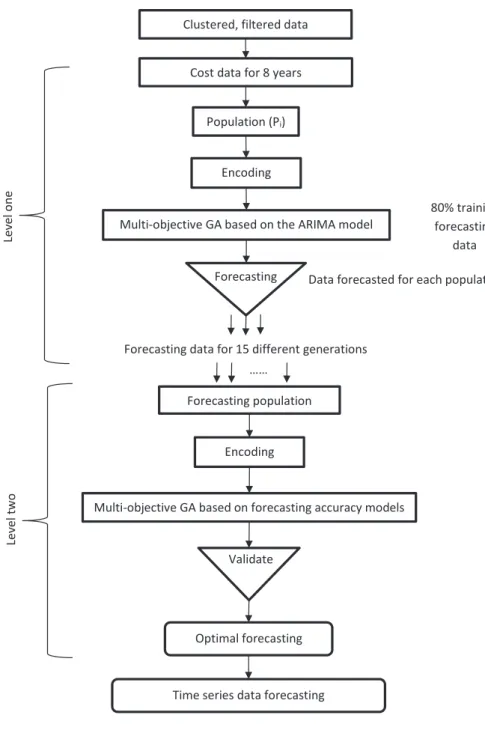
The purpose of this thesis is to develop a two-level MOGA method for optimizing the replacement time of reparable system. MOGA should be useful for machinery in general and specifically for reparable system. This objective will be achieved by developing a system that includes a smart combination of techniques by integrating MOGA to yield the optimized replacement time. Another measure to achieve this purpose is implementing MOGA in clustering and imputing missing data to obtain cost data, which could help to provide proper data to forecast cost data for optimization and to identify the optimal replacement time. In the first stage, a two-level MOGA is proposed to optimize clustering to reduce and impute missing cost data. Level one uses a MOGA based on fuzzy c-means to cluster cost data objects based on three main indices. The first is cluster centre outliers; the second is the compactness and separation (𝑣𝑘) of the data points and cluster centres; the third is the intensity of data points belonging to the derived clusters. Level two uses MOGA to impute the missing cost data by using a valid data period from that are reduced data in size. In the second stage, a two-level MOGA is proposed to optimize time series forecasting. Level one implements MOGA based on either an autoregressive integrated moving average (ARIMA) model or a dynamic regression (DR) model. Level two utilizes a MOGA based on different forecasting error rates to identify proper forecasting. These models are applied to simulated data for evaluation since there is no control of the influenced parameters in all of the real cost data. In the final stage, a two-level MOGA is employed to optimize risk-based LCC analysis to find the optimal replacement time for reparable system. Level one uses a MOGA based on a risk model to provide a variation of risk percentages, while level two uses a MOGA based on an LCC model to estimate the optimal reparable system replacement time.
The results of the first stage show the best cluster centre optimization for data clustering with low 𝑣𝑘 and high intensity. Three cluster centres were selected because these centres have a geometry that is suitable for the highest data reduction of 27%. The best optimized interval is used for imputing missing data. The results of the second stage show the drawbacks of time series forecasting using a MOGA based on the DR model. The MOGA based on the ARIMA model yields better forecasting results. The results of the final stage show the drawbacks of the MOGA based on a risk-based LCC model regarding its estimation. However, the risk-based LCC model offers the possibility of optimizing the replacement schedule.
However, MOGA is highly promising for allowing optimization compared with other methods that were investigated in the present thesis.
Keywords
: Artificial intelligence (AI), Life cycle cost (LCC), Machine learning (ML), Multi-objective genetic algorithm (MOGA), Risk-based life cycle cost (LCC), Tunnel fans, Two-level system.SAMMANFATTNING
Artificiell intelligens (AI) är en av de nyaste områdena inom vetenskap och teknik. Det innefattar ett stort antal forskningsområden, allt från det allmänna lärandet och mekanismer bakom uppfattningsförmåga till mer väldefinierade områden såsom matematisk. AI och specifikt multi-objective genetic algorithms (MOGA) för riskbaserad livscykelkostnadsanalys (LCC) kan användas för att uppskatta optimala ersättningstiden för tunnelfläktar med mål att minska kostnad och minimera risk. MOGA kan generera optimala lösningar som är svåra att ta fram manuellt. Syftet med denna avhandling är att utveckla en två-nivå MOGA-metod för ersättningstidsoptimering av tunnelfläktsturbinsystemet. MOGA bör vara användbart för maskiner i allmänhet och speciellt för turbinanläggning. Detta ska uppnås genom att utveckla ett system som ger en smart kombination genom att integrera MOGA för att få bästa möjliga optimeringstid. En annat applikationsområde för MOGA är att använda resulterande kluster till imputera saknad data. Detta möjliggör prediktion av kostnadsdata och för att hitta den optimala ersättningstiden där det inte annars skulle vara möjligt.
I det första steget erbjuder en tvånivå MOGA optimering av klustring för att minska och imputera saknad kostnadsdata. I nivå 1 använder en MOGA baserad på fuzzy c-medel för att klustra kostnadsdataobjekt baserad på tre huvudindex. Den första är utjämnare för klustercentra; den andra är kompaktheten och separationen (𝑣𝑘) av datapunkterna och klustercentra; den tredje är intensiteten av datapunkter som tillhör de härledda klustren. I nivå 2 använder MOGA för att påföra den saknade kostnadsreduceringsdatan inom en giltig dataperiod. I andra etappen optimerar en tvånivå MOGA prognoser för tidsserier. I nivå 1 implementerar MOGA antingen baserat på en autoregressiv integrerad rörlig genomsnitts (ARIMA) modell eller dynamisk regression (DR) modell. I nivå 2 använder en MOGA baserad på olika prognosfelpriser för att identifiera en korrekt prognos. I det sista steget föreslår en tvånivå MOGA att optimera en riskbaserad LCC-analys för att hitta den optimala underhållsutbytetiden för vägtankersystem. I nivå 1 använder en MOGA baserad på en riskmodell för att ge en variation av riskprocenter, medan nivå 2 använder en MOGA baserad på en LCC-modell för att uppskatta den optimala fläktutbytetiden.
Resultaten från första etappen visar att den bästa optimering av klustercentren ger låg 𝑣𝑘 och hög intensitet. Tre klustercentraler har valts eftersom de har en lämplig geometri med den högsta datareduktionen på 27%. Det bästa optimeringsintervallet används för att fördröja saknad data. Resultaten från det andra steget visar nackdelarna med prognoser i tidsserier med användning av en MOGA baserad på DR-modellen. En MOGA baserad på ARIMA-modellen ger bättre prognosresultat. Resultatet av slutskedet visar nackdelen med MOGA baserat på en riskbaserad LCC-modell avseende dess uppskattning. Samtidigt erbjuder riskbaserad LCC-modell möjligheten att optimera ersättningsplanen.
MOGA visar emellertid möjligheten att optimera jämfört med andra metoder som den har undersökts i denna avhandling p.g.a. av dess förmåga att lösa problem där andra metoder inte är applicerbara.
Keywords
: Artificial intelligence (AI), Life cycle cost (LCC), Machine learning (ML),Multi-objective genetic algorithm (MOGA), Risk-based life cycle cost (LCC), Tunnel fans, Two-level system.
LIST OF APPENDED PAPERS
Paper I
Yamur K. Al-Douri, Hussan Al-Chalabi, and Liangwei Zhang. "Data Clustering and Imputing
using a Two-Level Multi-Objective Genetic Algorithm (GA): A Case Study of Maintenance Cost Data for Tunnel Fans." Cogent Engineering 5.1 (2018): 1-16.
Paper II
Yamur K. Al-Douri, Hussan Al-Chalabi, and Jan Lundberg. "Time Series Forecasting Using a
Two-Level Multi-Objective Genetic Algorithm: A Case Study of Maintenance Cost Data for Tunnel Fans." Algorithms 11.8 (2018): 123.
Paper III
Yamur K. Al-Douri, Hussan Al-Chalabi, and Jan Lundberg. “Risk-based Life Cycle Cost
Analysis using a Two-Level Multi-Objective Genetic Algorithm: A Case Study of Maintenance Cost Data for Tunnel Fans.” Submitted to the Journal of Quality in Maintenance Engineering.
ABBREVIATIONS
AI Artificial intelligence
ARIMA Autoregressive integrated moving average
DR Dynamic regression
iid Independent and identically distributed
ML Machine learning
K-S Kolmogorov-Smirnov test
GA Genetic algorithm
LCC Life cycle cost
MC Maintenance cost (cu)
MOGA Multi-objective genetic algorithm NHPP Non-homogenous Poisson process
OC Operating cost (cu)
ORT Optimal replacement time (months)
PP Purchase price (cu)
TBF Time between failures (h) TOC Total ownership cost (cu) 𝑇𝑂𝐶𝑣𝑎𝑙𝑢𝑒 Total ownership cost value (cu)
NOTATIONS
𝛾 positive random number between 0 and 1
𝑧𝑐 cost of the 𝑧𝑡ℎ values in the current population of the object 𝑚 number of objects; in this case, m = 2
𝑧𝑘𝑗 object’s data points 𝐶 number of cluster centres
𝑁 number of data points belonging to cluster centres ‖𝑣𝑖− 𝑣̅‖2 average distance between 𝐶 cluster centres 𝑚𝑖𝑛𝑖≠𝑗‖𝑣𝑖− 𝑣𝑗‖
2
minimum distance between 𝐶 clusters 𝑌𝑖 actual value of 𝑖th training
𝑃𝑖 generated value of 𝑖th training 𝑦𝑡 the actual data over time
𝜇 the mean value of the time series data 𝑝 the number of autoregressive lags
𝑑 the number of differences calculated with the equation ∆𝑦𝑡= 𝑦𝑡− 𝑦𝑡−1
𝑞 the number of lags of the moving average process 𝜎 autoregressive coefficients (AR)
𝜃 moving average coefficients (MA) 𝜖 the white noise of the time series data 𝑥𝑡 the actual data over time
𝛼 constant estimated value of the time series data 𝐻1 the hypothesis is either 𝐻1 = 1 or 𝐻1 < 1
𝑡 time {𝟏, … , 𝒌}
𝐹𝑡 the forecasted data over time
𝑥 constant value calculated with the normal equation, where 𝑋𝑇𝑋𝐴 = 𝑋𝑇𝑏
𝑏1 𝑎𝑛𝑑 𝑏2 calculated with the normal equation, where 𝑋𝑇𝑋𝐴 = 𝑋𝑇𝑏 𝑌𝑡 related to 𝑌𝑡−1 and 𝑌𝑡−2
CM corrective maintenance cost (cu)
PM preventive maintenance cost (cu)
𝑆𝑃𝑐 spare part cost for corrective maintenance (cu) 𝐿𝐶𝑐 labor cost for corrective maintenance (cu)
𝑆𝑡 resale value (cu)
BV1 booking value on first day of operation (cu) Dr depreciation rate
t fan’s lifetime (months)
RT replacement time (months) {1,…, t} 𝑟 interest rate
M number of fan replacement cycles
𝐸𝑐𝑡 the expected risk cost over 𝑡 monthly time scale {0, … , 𝑡}
𝑅𝑓𝑖 the failure monthly rate, which is the rate of the interval times of two
regular repairable failures
𝐶𝑓𝑖 the failure cost (labor and material cost) associated with the occurrence
TABLE OF CONTENTS
ACKNOWLEDGEMENTS ... 5
ABSTRACT ... 7
SAMMANFATTNING ... 9
LIST OF APPENDED PAPERS ... 11
ABBREVIATIONS ... 13
NOTATIONS ... 15
TABLE OF CONTENTS ... 17
INTRODUCTION ... 21
1.1. Background ... 21
1.1.1. AI and machine learning (ML) ... 21
1.1.2. Multi-objective genetic algorithm (MOGA) ... 23
1.1.3. Risk-based life cycle cost (LCC) ... 27
1.1.4. Reliability assessment ... 28
1.1.5. Two-level multi-objective optimization theory ... 29
1.2. Problem statement ... 30
1.3. Research purpose, questions and objectives ... 31
1.4. Limitations ... 32
1.5. Distribution of work ... 32
STATE OF THE ART AND RESEARCH GAPS ... 33
2.1. Data clustering and imputing ... 33
2.2. Time series forecasting ... 37
2.3. Risk-based LCC analysis ... 40 RESEARCH METHODOLOGY ... 45 3.1. Research methodology ... 45 3.2. Data collection ... 47 3.3. Data clustering ... 48 3.3.1. K-means clustering ... 48
3.3.2. Two-level MOGA system ... 49
3.4. Time series forecasting ... 55
3.4.1. Data simulation method ... 55
3.4.2. ARIMA model ... 59
3.4.3. Two-level system of MOGA based on the ARIMA model ... 60
3.4.4. Two levels of MOGA based on the DR model ... 65
3.5. Model optimization ... 67
3.5.1. Risk-based LCC model ... 67
3.5.2. Two-level MOGA system ... 69
RESULTS AND DISCUSSIONS ... 73
4.1. Results related to data clustering and imputing ... 73
4.1.1. Results of K-means data clustering ... 73
4.1.2. Results of two-level MOGA ... 74
4.2. Results related to time series forecasting ... 82
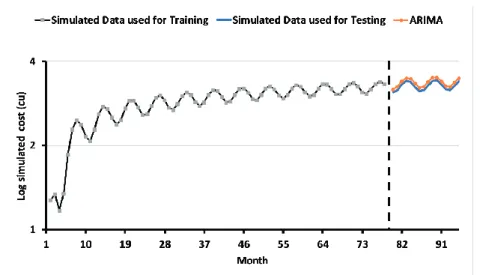
4.2.1. Results of the ARIMA model for simulated data ... 82
4.2.2. Results of the ARIMA model for case study ... 85
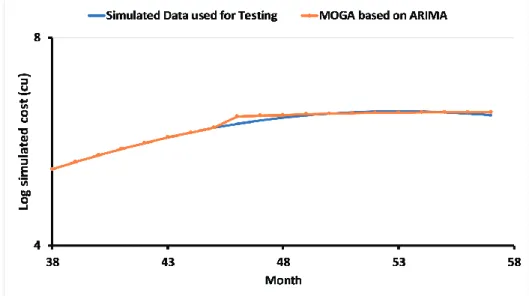
4.2.3. Results of the two-level system of MOGAs for simulated data ... 94
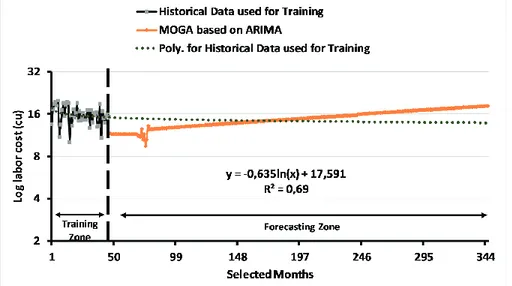
4.2.4. Results of the two-level system of MOGAs for the case study ... 103
4.2.5. Results of the MOGA based on the DR model for simulated data ... 112
4.2.6. Results of the MOGA based on the DR model for the case study ... 117
4.2.7. Results of the methods comparison of simulated data ... 122
4.2.8. Results of the methods comparison of case study ... 122
4.3. Results related to risk-based LCC optimization ... 123
4.3.1. Results of the risk-based LCC model ... 123
4.3.2. Results of the two-level system of MOGAs ... 126
CONCLUSIONS AND FUTURE WORKS ... 131
5.1. Conclusions ... 131
5.2. Future works ... 132
PART ONE
THESIS CHAPTERS
INTRODUCTION
1.1. Background
Fundamental questions have surrounded the field of Artificial Intelligence (AI) since its inception regarding what intelligence means and how to measure it. The underlying issues of defining intelligence and how to formally measure intelligence are sensitive topics in human culture, both with respect to humans and, more so, with respect to machines. Several attempts have been made to generalize the definition of universal intelligence and to derive formal benchmark tests from such definitions (Turing 1995, Mishra 2016). Researchers have been striving to instil such computers capabilities for learning and solving complex problems. Machine Learning (ML) has been acquired over time call for automated methods of data analysis (Michalski, Carbonell et al. 2013). In the present thesis, the researchers will review the definition of AI and aggregate the mathematically formalized tests (ML) proposed for AI thus far.
1.1.1. AI and machine learning (ML)
“Artificial intelligence (AI) started as a field whose goal was to replicate human-level intelligence in a machine” (Brooks 1991). This goal was further appreciated even when early hopes diminished in light of difficulty. Slow progress has been made over the previous twenty years in demonstrating the aspects of intelligence. Recent research has tended to concentrate on commercial sable aspects of "intelligence" for human workers or decisions (Brooks 1991). AI can be used in machines to solve problems in a manner that, as done by humans, requires intelligence. AI is one of the newest fields in science and engineering, encompassing a wide variety of subfields that range from general (learning and perception) to specific, such as mathematical theorems. This definition concerns processing and reasoning, whereas another proposed definition addresses behaviour against rationality (Russell, Norvig 2016).
For AI to be successful, two things are needed: intelligence and an artefact. The computer has been the artefact of choice for intelligence development based on hardware and software (Louie 2000, Russell, Norvig 2016). The goal of the present thesis is to evaluate the possibility of using an artificial intelligent system to facilitate a complex industrial system or real-world system. Research in this area tends to focus on discovering and applying new models for representing and using knowledge and assembling systems that can explain various types of intelligence. AI models create systems that are capable of solving problems that individual techniques alone cannot accomplish. Once the appropriate techniques have been chosen, comparisons should be made to determine which techniques are most suitable to solve the problem. AI has evolved to the point where it is now being used in many facets of technology. The success of these and other intelligent systems has led to increased interest in incorporating AI techniques into more complex systems (Louie 2000).
Learning is the phenomenon for achieving artificial intelligence. Learning processes include the acquisition of new declarative knowledge, the development of machines through instruction or practice, the new knowledge of organization, effective representations, and the discovery of new facts and theories through observation and experimentation. Researchers have been striving to
instil such capabilities in computers for learning and solving complex problems. The study and computer modelling of learning processes in their multiple manifestations comprise the subject matter of Machine Learning (ML) (Michalski, Carbonell et al. 2013).
The variety and complexity of data that have been acquired over time call for automated methods of data analysis, which can be provided by ML. In particular, ML defines a set of methods that can automatically detect patterns in data; these uncovered patterns can then be used to analyse and predict future data or to perform other types of decision making associated with uncertainty, such as planning how to collect more data (Goldberg, Holland 1988, Murphy, Kevin P. 2012).
Currently, the field of ML is organized around three primary objectives (Michalski, Carbonell et al. 2013):
• Task-oriented studies: in engineering approaches, analysis of the system can improve performance in a predetermined set of tasks.
• Cognitive simulation: the computer simulation of human learning processes.
• Theoretical analysis: the theoretical exploration of the possible learning methods and algorithms independent of the engineering application domain.
These objectives are connected, and although many research efforts strive primarily to address one of these objectives, progress towards one objective often leads to progress towards another. Research in ML has revealed the possibility of instructing computers in new manners and thereby offers the promise to ease the burden of manually programming growing volumes of increasingly complex information in future computers (Michalski, Carbonell et al. 2013).
Figure 1.1 shows the relation between AI and ML. AI is any technique that enables computers to interact as human intelligence, using logic, if-then rules, and decision making. ML is a subset of AI that includes abstruse statistical techniques that enable machines to improve and execute tasks based on historical experience. The combination of AI and ML makes possible efficient and intelligent systems for decision making (Michalski, Carbonell et al. 2013).
1.1.2. Multi-objective genetic algorithm (MOGA)
Currently, existing models and methods must be improved. Such models could be capable of many different phenomena and could be used to solve a wide variety of real-life problems. Evolutionary computing was introduced in the 1960s by Ingo Rechenberg in his work on evolutionary algorithms (EAs) (Rechenberg 1989), and this idea was later developed in other studies. Genetic algorithms (GAs) were first invented, proposed and developed by John Holland in his book “Adaptation in natural and artificial systems” in 1975 (Holland 1975). Holland proposed GAs as a heuristic method based on “Survival of the fittest” and discovered GAs as a useful tool for search and optimization problems (Holland 1975, Sivanandam, Deepa 2007). The science of genetics helps us differentiate between heredity and variations and can account for resemblances and differences based on the concepts of EAs. EAs are directly derived from natural heredity data structures and problem-sensitivity. Specifically, the concepts of GAs are directly derived from EAs. The main terminologies involved in the biological background of species are as follows (Sivanandam, Deepa 2007):
• The cell: Every human cell is a complex of many “small” factories that work together, and the centre of the cell is the cell nucleus. Inherited genetic information is contained in the cell nucleus.
• Chromosomes: Genetic information is stored in chromosomes, and the chromosome is composed of deoxyribonucleic acid (DNA). In humans, chromosomes exist in pairs (23 pairs), and chromosomes can be divided into many parts, known as genes. The different possibilities for a property contained in the gene are called alleles, and a gene can comprise different alleles.
• Genetics: The entire combination of genes is called the genotype, and the phenotype describes the physical aspect of decoding a genotype. An interesting point of the evolution process is that selection is performed according to the phenotype, whereas reproduction leads to different combinations of the genotype.
• Natural selection: The species origin is based on the preservation of favourable variations and the avoidance of unfavourable variations. Variation comprises the differences shown by individuals of different species and by offspring of the same parents. Considering variation, there are more individuals born than can survive. Individuals with an advantage have a greater chance to survive and for their variance to be retained, i.e., survival of the fittest.
GAs are an example of mathematical technology transfer simulating evolution that can solve optimization problems for a variety of data sources. Today, GAs are used to solve complicated optimization problems such as timetabling, scheduling, and game playing (Sivanandam, Deepa 2007, Jayalal, Riyas et al. 2019). From 1993–1995, many different EAs were suggested to solve multi-objective optimization problems (Deb, Pratap et al. 2002). Fonseca and Fleming proposed a MOGA (Fonseca, Fleming 1993). Srinivas and Deb also suggested a Non-Dominated Sorted GA (NSGA) (Srinivas, Deb 1994), and Horn et al. described the Niched Pareto GA (NPGA) (Horn, Nafpliotis et al. 1994). These algorithms demonstrated the necessary additional operators for converting a simple EA to a multi-objective EA.
Two common features of all three types of algorithms are the following: 1) assigning fitness to population members based on non-dominated sorting and 2) preserving diversity among solutions of the same non-dominated front. Multiple non-dominated solutions have been shown on many test problems and engineering problems. Researchers have acknowledged the must
introduce more useful operators into single-objective GAs to solve multi-objective optimization problems (Deb, Pratap et al. 2002).
There are two characteristic features of a MOGA. The first is its selection procedure. In the selection procedure, a MOGA uses a weighted sum of multiple objective functions that are combined into a scalar fitness function. The weights attached to the multiple objective functions are not constant but rather randomly specified for each selection. Therefore, the direction of the search in a MOGA is not constant. The second characteristic feature of a MOGA is its elite preservation strategy. A MOGA with various search directions is shown in Figure 1.2. The performance of a MOGA is examined by maximizing the total objectives while minimizing the number of directions searched by the MOGA (Murata, Ishibuchi et al. 1996).
Figure 1.2: Directions of the search by the MOGA (Murata, Ishibuchi et al. 1996)
MOGAs have several features that make this type of algorithm efficient and popular. The features are as follows (Deb, Pratap et al. 2002):
• Fast non-dominated sorting: given a population of size 𝑁, each solution can be compared with every other solution in the population to find if it is dominated. This requires 𝑂(𝑀𝑁) comparisons for each solution, where 𝑀 is the number of objectives. When this process is continued to find all members of the first non-dominated level in the population, the total complexity is 𝑂(𝑀𝑁2). At this stage, all possible individuals in the first non-dominated front are found. However, to find the possible individuals in the next non-dominated front, the solutions of the first front are discounted temporarily, and the above procedure is repeated (Deb, Pratap et al. 2002).
• Diversity preservation holds that the GA maintains a good spread of solutions among the obtained set of solutions (Deb, Pratap et al. 2002).
• The main loop initially describes the creation of a random parent population 𝑃0. The population is sorted based on the non-domination. Each solution is assigned a fitness (or rank) incrementally equal to its non-domination level. Thus, minimization of the fitness is assumed, and the usual binary tournament selection, recombination, and mutation
Non-dominated solutions 𝒇𝟏( . ): To be maximized 𝒇𝟐 ( . ): T o b e m in im ized
operators are used to create a new offspring population 𝑄0 of size 𝑁 (Deb, Pratap et al. 2002).
The step-by-step procedure in Figure 1.3 shows that the MOGA is simple and straightforward. First, the combined population has the size 𝑁. Then, the population is sorted according to non-domination to obtain ensured elitism. The solutions belonging to the best non-dominated set are among the best solutions in the combined population and must be emphasized more than other solutions in the combined population. The procedure is continued until no more sets can be accommodated. The new population is now used for selection, crossover, and mutation to create a new population (Deb, Pratap et al. 2002, Vu, Probst et al. 2019).
Figure 1.3: Outline of a MOGA (Murata, Ishibuchi et al. 1996)
The following genetic operations are employed to generate and handle a population in a MOGA (Murata, Ishibuchi et al. 1996):
Step 0 (Initialisation): Generate an initial population containing 𝑁 number of values.
Step 1 (Evaluation): Calculate the values of the objective functions for the generated 𝑁 values. Step 2 (Selection): Calculate the fitness function 𝑓(𝑥) of each value. The selection step is repeated a different number of times to produce different offspring for steps (3) and (4). Step 3 (Crossover): Apply a crossover operation for each selected pair to generate offspring with the crossover probability, as shown in Figure 1.4.
Step 0: Initialization
Step 1: Evaluation
Step 2: Selection
Step 3: Crossover
Step 4: Mutation
Step 6: Termination Test
Step 7: User Selection
Figure 1.4: Crossover operator
Step 4 (Mutation): For each string generated by the crossover operation, apply a mutation operation with a pre-specified mutation probability, as shown in Figure 1.5.
Figure 1.5: Mutation operator
Step 5 (Elitist strategy): Randomly remove values from
𝑁
generated by the above operations and add the same number of values from a proposed solution to the current population. Step 6: (Termination test): If a pre-specified stopping condition is not satisfied, return to step 1. Step 7 (User selection): The MOGA returns a final set of optimal solutions to the decision maker. A single solution (i.e., the final solution) is selected according to the decision maker's preference. These steps offer the possibility to adapt MOGAs to any research problem and to optimize the possible solutions. MOGAs to solve multi-objective optimization problems can be used for industrial applications, such as optimizing maintenance costs and decreasing failure risk costs.A B C D E F G H 1 2 3 4 5 6 7 8 A B C D E 6 7 8 1 2 3 4 5 F G H A B C D E F G H A B H D E F G C
1.1.3. Risk-based life cycle cost (LCC)
The LCC is defined as the sum of all the acquisition and ownership costs incurred during the useful life span of a system. These costs include direct, indirect, recurring, and nonrecurring costs of design, research and development, investment, operations, maintenance and other support of the system, and retirement of the system. The ownership costs represent the total of all costs other than the acquisition or initial cost during the life time of a system. The LCC term was used for the first time in 1965 in a report entitled "Life Cycle Costing in Equipment Procurement" (Dhillon 2009). This report was prepared by the Logistics Management Institute, Washington, D.C. for the Assistant Secretary of Defense for Installations and Logistics, the U.S. Department of Defense, Washington, D.C. According to many studies, the system ownership cost (i.e., operating and logistic cost) can vary considerably and amount to 10-100 times the original acquisition cost (Ryan 1968). Determining the system’s life cycle cost is an important issue because the acquisition is a small part in relation to the total costs associated with owning and operating the system (Ahmed 1995).
The specific goals of life cycle costing in product acquisition management are to estimate the total ownership cost (TOC) of the system and to decide the optimal replacement time. Reducing the TOC by using LCC analysis is an important issue in the development process of the system, and understanding TOC implications is necessary to decide whether to continue to the next development phase and to assist in procurement decisions. The economical estimation technique of LCC analysis determines the total cost of owning, operating, maintaining and disposing of a system over the system life (Farr 2011).
“A LCC analysis that does not include risk analysis is incomplete at the best and can be incorrect and misleading at worst” (Craig 1998). LCC analysis combined with risk analysis provides different decision scenarios, and there are different consequences of these decisions. Some of these analyses might not be applicable because of different operational and environmental situations (Markeset, Kumar 2001). However, the goal is to estimate and compare the likelihood of success or failure for all optimizations of the LCC with different levels of reliability. The reliability can be defined as the probability that the system can perform continuously and without failure over a period of time when operated under the stated conditions (Markeset, Kumar 2001). The introduction of risk assessment and risk analysis ensures that the consequences of risks are understood and considered throughout the product life cycle (Edmonds 2000). One of the most important benefits of using risk assessment is to generate a range of costs, i.e., to move away from single point estimating because a range of costs is much more efficient to estimate than a single cost (Roy, Forsberg et al. 2000). Furthermore, once a risk analysis has been conducted, the analyst can consider ways to reduce the risk, e.g., by avoidance, deflection or contingency, and then plan accordingly to control the reduction process (Rush, Roy 2000).
There are several methods for estimating cost. Traditional cost estimating includes two main estimates: a first sight estimate performed early in the cost stage and a detailed estimate made to precisely calculate cost. AI can be applied with a GA to estimate system cost by which the computer can learn the effects on system/related parameters based on historical cost data. The GA approximates the functional relationship among the cost parameters that are input during the training phase and applies the approximated function in the testing phase to obtain a predicted cost (Rush, Roy 2000).
1.1.4. Reliability assessment
Reliability assessment is directly associated with studying the failures of a system. Failure is defined as the termination of an item’s ability to perform a required function, although reliability is the probability of that the item performs a required functionality under given conditions and a defined time interval (IEC 1990). A system can be repairable or non-repairable. Repairable systems can be restored, although non-repairable systems are replaced when they fail (Louit, Pascual et al. 2009a).
Various models can be applied for reliability assessment depending on the type of failure data and the repairability of the system. If the repair or substitution of the failed part in a complex system does not involve a significant modification of the system reliability, then the non-homogeneous Poisson process (NHPP) is able to correctly describe the failure-repair process (Coetzee 1997, Louit, Pascual et al. 2009a). Other authors prefer the homogeneous Poisson process (HPP) because of its simplicity in calculations (Murphy, K. E., Carter et al. 2002, Panja, Ray 2007), even though some risks must be taken into account when assuming a constant failure rate (Littlewood 1985). A common idea is to assume that certain failure data are independent and identically distributed (iid), but this can lead to incorrect model selection for the time between failures and wrong conclusions and decisions (Louit, Pascual et al. 2009a).
Several authors have studied the power of the different trend tests for repairable systems (Garmabaki, Ahmadi et al. 2015, Kvaløy, Lindqvist et al. 2001, Viertävä, Vaurio 2009). The trend and independence of the data must be checked to find the best model that fits the data. Different trend tests can be used depending on whether the data are monotonic. A trend in the pattern of failures can be monotonic or non-monotonic. If there is no trend shown in the data, the failure rate is identically distributed. Non-monotonic trends occur when trends change with time or when they repeat themselves in cycles. If there is a monotonic trend, the system is improving (deteriorating) in cases in which the time between arrivals tends to increase (decrease). In addition, different tests have different null hypotheses; for example, if a trend test for the null hypothesis H0 being NHPP is rejected, the hypothesis accepted (Barabady, Kumar 2008, Morant Estevan 2015).
There are different tests to check whether data present a parametric or graphic trend. Graphical tests can be used to determine the data trend, to identify possible outliers in the data, and to indicate whether the trend is monotonic or non-monotonic. The plot of cumulative number of failures vs. cumulative operating time can be used to check the data homogeneity and the type of data trend (monotonic or non-monotonic) (Asher, Feingold 1984, Crowder 2017). The results of the plot can provide an initial answer regarding whether the null hypothesis should be rejected; this outcome should later be validated by the results of parametric tests. However, graphical techniques do not provide statistical evidence to reject the null hypothesis (Tsang 2012).
Parametric tests, such as the Laplace test and the Anderson-Darling test, help to determine whether an observed trend is statistically significant or only accidental, (Asher, Feingold 1984, Tsang 2012). Laplace tests check the null hypothesis that data come from an NHPP; rejection of the null hypothesis means the process is not an NHPP but could still have no trend (Asher, Feingold 1984, Lindqvist 1999). Trend tests for evaluating the null hypothesis are based on the limits of each trend test considering a confidence interval of 95%.
After calculating the parameters for the different possible distributions, it is necessary to perform a statistical test for goodness of fit (Ebeling 2004). Goodness-of-fit tests indicate that the proper distribution fits the failure data by comparing the p-value (the probability of obtaining a value from the corresponding distribution equal to or more extreme than the one computed from the data for the parametric test), which is a measure of the level of significance (Vaurio 1999). The Anderson-Darling test for goodness of fit is a modification of the Kolmogorov-Smirnov (K-S) test. The Anderson-Darling test can be used to test various distributions, such as normal, exponential, Weibull, lognormal, and uniform distributions. The Anderson-Darling test is an alternative to the Chi-square and Kolmogorov-Smirnov goodness-of-fit tests (Stephens 1974).
1.1.5. Two-level multi-objective optimization theory
The literature shows that both single-level and two-level single-objective optimization have several advantages, but single-level optimization has a high computational cost for composite maintenance replacement. However, both single-level and two-level single-objective optimization must be improved for three reasons. First, in real-world planning problems, parameters can be represented as fuzzy sets or non-linear given human-induced imprecision in acquiring modelling parameters. Second, improving the accuracy of the input data through further investigation could assist in enhancing the reliability of the solutions. Third, limitations can be further addressed by taking more uncertainties into consideration and improving practical applications (Liu, Y., Li et al. 2017).
Many real-world decision-making problems must achieve several objectives: minimizing risks, maximizing reliability, minimizing deviations of the desired result, and minimizing cost. The goal of single-level or two-level single-objective optimization is to find the “best” solution, which corresponds to the minimum or maximum value of an objective function that covers all different objectives. This type of optimization is useful as a tool that can provide decision makers with insights into the nature of the problem but usually cannot provide a set of alternative solutions that address or compare different objectives (Savic 2002).
Two-level multi-objective optimization can offer many optimal solutions. The interaction among different objectives over two levels gives rise to a set of compromised solutions, largely known as the trade-off, non-dominated, non-inferior solutions. The consideration of many objectives in the design or planning stages provides three major improvements to the procedure that supports decision making (Cohon 2004):
1. A wider range of alternative solutions is usually identified when a two-level and multi-objective methodology is employed.
2. The consideration of multiple objectives offers more appropriate roles for the participants in the planning and decision-making processes, allowing the analyst to make informed decisions and choose the appropriate solution.
3. Models of a problem will be even more realistic if many objectives are considered. A multi-level approach, such as a two-level approach, is needed to decompose the entire system problem using different levels into several sub-problems and considering various coupling effects. The two-level approach allows individual system components to be optimized, which will significantly reduce the time consumed for the computation and the design cycle. Various
conceptual approaches have been proposed in the literature and in various application areas to decompose large optimization problems into sub-problems (Ghanmi, Guedri et al. 2011). The use of multi-level, such as two-level, multi-objective optimization usually has the following problems:
• The multi-objective optimization problem is transformed into a single-objective problem that requires a priori knowledge of the weight of each cost function in relation to others. In practice, this transformation is not always easy because of a lack of experience or information or because the cost functions are not compatible (Ghanmi, Guedri et al. 2011).
• The design space is not convex; the weighting method will ignore the convex part, although this is the part of the solution where a compromise can be found. Many studies have not considered uncertainties in the design parameter during optimization. A solution that is suboptimal but stable with regard to the uncertainty will be of much greater use to the designer (Ghanmi, Guedri et al. 2011).
• Investigations of finding solutions for real problems are limited by the required amount of calculation time and by the need for automated mesh generators (Hansen, Horst 2008).
1.2. Problem statement
Increasing demands for improving the availability of fans system associated with reducing the ownership costs and risk costs have forced the Swedish Transport Administration (Trafikverket) to implement a cost-cutting strategy for maintenance to achieve their goals. There are many reasons why Trafikverket is being increasingly compelled to use life cycle costing to make different types of decisions that indirectly or directly concern tunnel fans. These reasons include increasing operation and maintenance costs, budget limitations, competition, and the high cost of investment. The overall goal of Trafikverket is to increase company profit by decreasing the costs of failure.
The financial department at Trafikverket has a goal of reducing the cost associated with the ownership of their systems. To achieve this financial goal, financial experts asked the following question: what is the best time to replace the fan and buy a new one from an economic point of view, with the aim of reducing the TOC and considering the risk cost of the fan system? A MOGA for risk-based LCC analysis of the fans system can be proposed to estimate the optimal replacement time, with the aims of reducing the ownership cost and the risk cost and increasing company profitability. Another measure that would help Trafikverket to determine the optimal replacement time would be to perform a MOGA using clustering and to impute missing data to serve as cost data, which could help provide proper data for forecasting cost. Thus, MOGA could be used to obtain optimal forecasting and to identify the optimal replacement time.
The main reason for an increased use of the life cycle costing concept for fan systems is that at some point of the life span of fans, the operating, maintenance and risk costs will exceed the acquisition costs. To this end, one should consider focusing on optimization models as techniques and tools that can help decision makers at Trafikverket optimize their fan system lifetime.
1.3. Research purpose, questions and objectives
The purpose of this study is to use AI to develop a two-level MOGA for optimizing replacement time of reparable system.
To achieve the purpose, three main questions were raised:
Research questions (RQs)
RQ1: How can AI be used to find the suitable method to address data problems such as missing and redundancy and provide solutions?
RQ2: How can AI be used for optimal time series forecasting of maintenance cost data?
RQ3: How can AI be used for risk-based LCC model optimization?
Table 1.1 Links between the published research papers appended to the thesis and the research questions
Paper I Paper II Paper III
RQ1 X
RQ2 X
RQ3 X
To answer these research questions, three main objectives have been achieved through a smart combination by integrating a MOGA with different statistical and stochastic analysis methods to obtain the optimal result and solution.
Research objectives
• Develop a MOGA based on fuzzy c-means (FCM) for data clustering and imputing, and compare the result with the K-means algorithm.
• Develop a MOGA based on autoregressive integrated moving average (ARIMA) and a MOGA based on dynamic regression (DR) for time series forecasting, and compare the results of the latter with those of the ARIMA model. Different scenarios have been proposed, such as long-term forecasting or modifying the data, to provide different time series forecasting evaluations.
• Develop a risk-based MOGA for LCC optimization, and compare with the risk based on the LCC model.
1.4. Limitations
The limitations of this thesis can be described as follows. First, fault detection, such as fault diagnosis, fault prognosis and action recommendations, is not studied, as this topic would require additional separate research. Second, the studied data are limited to numerical data; i.e., categorical and ordinal data are not considered. Third, the synthetic data used in this research to validate the proposed models are modified due to quality issues; thus, they may not fully reveal the merits and shortcomings of the models. Fourth, the case study in all the papers appended to this thesis is limited to the labor and material costs of a 121-fan system as one unit, with the primary aim of verifying the proposed models.
1.5. Distribution of work
The contributions of each author of the papers included in this thesis can be divided into the following main activities (see Table 1.2):
1. Study conception and design 2. Data collection
3. Data analysis and interpretation 4. Manuscript drafting
5. Manuscript critical revision
Table 1.2: Contributions of each author to the appended papers
Paper I Paper II Paper III
Yamur K. Al-Douri 1,3,4,5 1,3,4,5 1,3,4,5
Hussan Al-Chalabi 1,2,3,5 1,2,3,5 1,2,3,5
Jan Lundberg 1,3,5 1,3,5 1,3,5
STATE OF THE ART AND RESEARCH GAPS
In this section, the results of a comprehensive literature review are presented in three main parts. The first part focuses on data clustering and imputing, the second part focuses on time series forecasting, and the third part focuses on risk-based LCC analysis.
2.1. Data clustering and imputing
Many studies have used MOGAs for data clustering in terms of different aspects and in different application areas. This section presents the different literature studies with practical comparisons with the proposed model of clustering in this thesis. The comparison aims to show the novelty of this thesis model by highlighting the advantages and the weaknesses.
Rothwell et al. (Rothwell 1991) proposed a two-level system with two objectives to maximize the total structural strain energy and to minimize the total structural weight. The two levels are the entire structure and the element level for each structural member. The proposed system is useful for obtaining a proper solution to the optimized problem. The authors argued that multi-objective multi-level optimization techniques are suitable for this type of real-world engineering problem.
Q.S. Li et al. (Li, Liu et al. 2000) studied the design problem of optimizing the number of actuators to be integrated in a system using a multi-objective solution for strong wind force. A multi-level GA was proposed to optimize the location of actuators, and the control algorithms in buildings with active control under wind excitation were studied. The authors argued that the algorithm (Li, Liu et al. 2000) solves multi-objective problems with linear, non-continuous, discrete and multi-modal objective functions.
Bo Yuan et al. (Yuan, Klir et al. 1995) proposed a new approach to fuzzy clustering. The approach is based on the application of an evolutionary strategy to a fuzzy c-means (FCM) clustering algorithm. This approach determines the “best” distance for given data, where the goodness criterion is defined in terms of the performance of the FCM algorithm. The authors apply their approach based on the relationship between distance functions and structures implied in a given dataset. An EA is suggested to find the appropriate weight for the weighed FCM algorithm in a real application. However, my opinion that a limitation of FCM is the number of proper cluster centres that fit the data. The authors used default weight values for fuzzy partitioning data, which should reflect the data weight.
Julia Handl and Joshua Knowles (Handl, Knowles 2004) proposed a new data clustering approach in which two or more measures of cluster quality are simultaneously optimized using a multi-objective EA. The authors adapted a Pareto envelope-based selection method for the clustering problem by incorporating specialized mutation and initialisation optimization procedures for a number of objectives. The authors found that this clustering approach yields high-quality solutions for data clustering and a greater understanding of the data structure. However, my opinion that the approach may incorporate feature selection, outlier removal, and fixed cluster numbers.
Hesam Izakian and Ajith Abraham (Izakian, Abraham 2011) proposed a hybrid fuzzy clustering method based on FCM and fuzzy particle swarm optimization (FPSO) to take advantage of the merits of both algorithms. FCM is sensitive to the data and may become trapped in local optima, while FPSO can optimize the problem. The experimental results show that the proposed method is efficient and can reveal encouraging results for optimal clustering. However, the authors argued that particle swarm optimization (PSO) can fall into a particular optimum, which results in less precision in finding the optimal clustering. In addition, my opinion that the method was not tested on a real-world problem to evaluate the optimal clustering performance.
Siripen Wikaisuksakul (Wikaisuksakul 2014) proposed a multi-objective GA for automatic clustering in an n-dimensional database. The database is assigned a number of fuzzy groups in different dimensions using an FCM algorithm. The authors tried to exploit the advantage of fuzzy properties, which provide the capability to handle the drawbacks of fuzzy overlapping clusters. The authors argued that the method can address overlap in automatic clusters by exploiting the advantages of fuzzy properties. However, my opinion that the model requires more computation time due to the one level of data processing to process unlabelled data without prior knowledge.
Chao-Lung Yang et al. (Yang, Kuo et al. 2015) proposed a combination of a fuzzy genetic algorithm and multi-objective optimization based on the K-mode method, named the non-dominated sorting genetic algorithm-fuzzy membership chromosome (NSGA-FMC). The compactness and the operations are the main two factors that are used to optimize the clustering quality. The experimental results showed that the authors’ method can obtain better clustering quality simultaneously with shorter computation time. However, my opinion that this model has not been implemented on a real-life dataset to verify and validate its accuracy and stability. In addition, the clustered data intensity was not investigated in this study via a deep study for every cluster.
M. Anusha and JGR Sathiaseelan (Anusha, Sathiaseelan 2016) proposed an evolutionary clustering algorithm for multi-objective optimization to identify more relevant features based on knowledge from the given data. Neighbourhood learning is adopted to improve the diversity and efficacy of the algorithm. The results reveal the closest feature subset from the selected features of the data that minimizes the cost while maintaining the solution quality, and the results are efficient and robust. The evolutionary clustering algorithm proposed by M. Anusha and JGR Sathiaseelan addresses the clustering problem of high-dimensional and low-dimensional data. However, my opinion that a weakness of the algorithm is that knowledge of the test problem, the search complexity, computation cost and time performance is required.
Alava Parraga et al. (Parraga-Alava, Dorn et al. 2018) proposed a multi-objective clustering algorithm guided by a priori biological knowledge (MOC-GaPBK) to find and improve clusters of genes with high levels of co-expression, biological coherence, and good compactness and separation. The effectiveness of the authors’ algorithm is demonstrated on four publicly available datasets using statistical, visual and biological significance tests, revealing that the algorithm yields higher quality solutions than other clustering algorithms. However, my opinion that the multi-objective GA proposes different solutions that might not be useful for the research problem. A single solution may be more appropriate for clustering genes.
Different authors have studied clustering from different perspectives and evaluated clustering using different indices. Most of these studies used clustering to more deeply understand the data. However, clustering can be used to study data quality and impute data for future analysis. The
clustering and imputing methodology presented in this thesis aims to avoid the weaknesses of previous studies and has the ability to address poor-quality data. MOGA operations provide great possibilities to optimize clustering and imputing. My opinion that the variant operations offer the possibility to avoid the weaknesses of other algorithms reported in the literature and give the presented method the capability to be implemented for different systems.
Table 2.1 summarizes the important conclusions and/or claims made by authors who have conducted research relating to data clustering and imputing.
Table 2.1: Summary of the state of the art
Conclusions References
• MOGA is a suitable model for world engineering problems. • MOGA must be simplified to fit engineering problems.
(Rothwell 1991)
• MOGA solves problems with non-linearity, non-continuity, discreteness and multi-objective functions.
• MOGA can effectively solve complicated problems.
• MOGA and its multi-objective function must be presented naturally in the design phase.
(Li, Liu et al. 2000)
• A genetic algorithm is suggested to determine the “best” distance for given data in real applications.
• The authors used default weight values for fuzzy partitioning data, which should be reflected in the data weights.
• FCM is limited to a number of proper cluster centres that fit the data.
(Yuan, Klir et al. 1995)
• Clustering approaches allow a greater understanding of the data structure.
• This approach may incorporate different angles, such as feature selection, outlier removal, and fixed cluster numbers.
(Handl, Knowles 2004)
• PSO can provide different solutions, but it could fall into a particular optimum. This could cause less precise identification of the optimal clustering.
• The proposed method is not applicable to real engineering problems for finding the best clustering performance.
(Izakian, Abraham 2011)
• FCM has the problem of overlapping clusters.
• The authors’ method can handle overlapping in automatic clusters by exploiting the advantages of fuzzy properties.
• Their model requires more computation time to process unlabelled data without prior knowledge.
• The authors focus on the compactness and separation of the proposed clustering method.
• This authors model has not been implemented in a real-life dataset to verify and validate the accuracy and stability. • Clustering intensity was not considered in the study with a deep
study of every cluster.
(Yang, Kuo et al. 2015)
• MOGA can be used for clustering one or multiple data dimensions.
• MOGA should have knowledge of the specific problem and considering all the objectives.
• MOGA limitations include computational cost and time consumption.
(Anusha, Sathiaseelan 2016)
• The authors demonstrated on different data types that MOGA provides a higher quality clustering solution rather than one clustering method.
• In some cases, one clustering method can provide a solution for describing the data.
(Parraga-Alava, Dorn et al. 2018)
Research gaps in data clustering and imputing
There are a number of additional research gaps that should be investigated with respect to clustering and imputing data, which are listed below.
• Different criteria’s in studying clustering or imputing to obtain a confident solution to the problem.
• Automatic clustering generated based on the data geometry or dimensions to automatically evolve the appropriate partitioning data with clusters of any shape, size, or convexity, as long as they possess some point symmetry property.
• Simplifying the data points are through normalizing the huge values.
• Calculating the cluster centre outliers to select the best pool of cluster centres. • Clustering evaluations are based on three main indices: compactness, separation and
intensity. Each one of these indices will help define the best clustering over different populations and possible solutions.
• These criteria are intended to evaluate and optimize the cluster centres and find the best cluster centres in the population.
• Overlapping clusters.
• Data outliers and missing data must be highlighted regarding the clustering decision. • The error imputing rate must be calculated to evaluate the imputing.
• The system should have the capability to address data problems with many missing values.
2.2. Time series forecasting
Many studies have used MOGAs in time series forecasting using different forecasting techniques and within different application areas. This section presents literature studies with practical comparisons with the proposed model in this thesis in time series forecasting. The comparison aims to show the novelty of this thesis model by highlighting the advantages and weaknesses. Daijin Kim and Chulhyun Kim (Kim, Kim 1997) proposed a novel automatic genetic fuzzy predictor ensemble (GFPE) method for accurately predicting future points in chaotic or non-stationary time series. The GFPE method comprises two stages; the first stage generates a fuzzy rule base that covers many training examples. The second stage builds fine-tuned membership functions that make the prediction error as small as possible. The root mean squared error (RMSE) was used in their method to evaluate the forecasting. The GFPE exhibits great improvements in predictions relative to those made by a single fuzzy predictor. However, my opinion that the proposed method still requires a large amount of learning time because the algorithm must learn a number of fuzzy predictors independently.
Iason Hatzakis and David Wallace (Hatzakis, Wallace 2006) proposed a method that combines a forecasting technique with an EA. The EA is used to optimize the dynamics of the forecasting technique estimation. The forecasting technique is an autoregressive (AR) model with two different options for the prediction of an individual’s location: (1) a multivariate vector autoregressive (VAR) model and (2) a univariate autoregressive model. The results indicate that the Iason Hatzakis et al. method has improved optimization, performance, and forecasting accuracy. In addition, the model can be used with single and multiple objectives. However, my opinion that this model has not been tested on real-world problems and/or with actual data, and it is used only for short-term forecasting.
Lars U. Hansen and Peter Horst (Hansen, Horst 2008) presented an efficient method to solve the structural optimization task by dividing the complete task into two separate optimization problems. Multi-level algorithms represent a certain type of optimization strategy based on the first and second levels, in which the first level optimizes the principle layout through the creation of multiple sub-tasks that are optimized and evaluated using the second level. The authors argued that their model achieves efficient optimization by combining different parameters over the two levels.
Wen-Chuan Wang et al. (Wang, W., Chau et al. 2009) developed a hydrological forecasting model based on past records that are crucial for effective hydropower reservoir management and scheduling. AR-moving-average (ARMA) models, artificial neural networks (ANNs), adaptive neural-based fuzzy inference system (ANFIS) techniques, genetic programming (GP) models and support vector machines (SVMs) were examined using long-term forecasting. The forecasting was evaluated using the standard statistical performance coefficient of correlation (R), the Nash– Sutcliffe efficiency coefficient (E), the RMSE, and the mean absolute percentage error (MAPE). The results showed that the best performance can be obtained using ANFIS, GP and SVM for different evaluation criteria during the training and validation phases. However, my opinion that these models must be evaluated using other standard statistical performance metrics that have
more sensitivity for data forecasting. In addition, these models must be improved by reducing the training time.
Abdollah Kavousi-Fard and Farzaneh Kavousi-Fard (Kavousi-Fard, Kavousi-Fard 2013) proposed a new hybrid correction method based on the ARIMA model, support vector regression (SVR) and a cuckoo search algorithm (CSA) to achieve a reliable forecasting model. This combination performs successful optimization by relying on the CSA to find the optimal SVR parameters through automotive searching. The forecasting results were effective compared with the results obtained using well-known forecasting models, such as ARIMA, ANN, SVR and SVR-PSO. However, my opinion that the authors’ model is applicable only to short-term forecasting and must be further evaluated for long-term forecasting.
Paulo S. G. de Mattos Neto et al. (de Mattos Neto, Paulo SG, Cavalcanti et al. 2015) proposed an approach to improve the performance of particulate matter (PM) forecasters by modelling residuals. The approach is a hybrid system (HS) that is composed of a GA and an ANN for modelling residuals using the two methods. The results of their proposed approach show that the system improves the accuracy of forecasting in terms of the fitness function for all cases compared with the method without correction. However, my opinion that this approach must be implemented using other data to validate the forecasting accuracy. In addition, the approach should be applicable for analysing poor-quality data that have missing values.
Zhen-Yao Chen and RJ Kuo (Chen, Z., Kuo 2017) proposed a hybrid of a GA and an artificial immune system (HGAI) algorithm with a radial basis function neural network learning for function approximation and further performed a personal computer sales forecasting exercise. The statistical forecasting evaluation models (mean absolute error (MAE), MAPE, and RMSE) indicate that the HGAI algorithm has the best performance results in terms of forecasting accuracy among other relevant algorithms, such as the ARMA model. However, my opinion that the proposed model must be compared with the dynamic forecasting algorithms to show its improvement in forecasting and to study the statistical forecasting evaluation models.
Huei-Tau Ouyang (Ouyang 2018) proposed a novel methodology to overcome this difficulty by integrating ANFIS and MOGA. The combinations of data inputs for ANFIS models are searched for by a MOGA, and the three indices of the coefficient of efficiency (CE), relative peak error (RPE) and relative time shift error (RTS) with the best performances for each index are selected. The results show that the model series exhibits significant improvements for various predictions and, thus, effectively improves the accuracy of predictions. However, my opinion that the model exhibited biases in long-term forecasting and thus must be improved.
Time series forecasting has been studied in the literature from different perspectives, and forecasting has been evaluated using different forecasting error rates. Most previous studies have used different methods to accurately predict forecasting. However, forecasting data can be used to estimate LCC by providing the necessary data. The time series forecasting methodology presented in this thesis aims to avoid the weaknesses of data forecasting and to address different data types. MOGA operations provide a great possibility for optimizing data forecasting. The authors argued that the variant operations offer the possibility to avoid the weaknesses reported in the literature and gives the method presented in this thesis the capability to be implemented in different systems.
Table 2.2 summarizes the important conclusions and/or claims made by authors who have conducted research relating to time series forecasting.
Table 2.2: Summary of the state of the art
Conclusions References
• The GFPE method provides accurate forecasting.
• The model training phase requires huge computation cost and is time consuming.
(Kim, Kim 1997)
• The authors’ model can improve the forecasting accuracy with a single objective or multiple objectives.
• Forecasting applies only to the short term.
• There is no application in real-world problems or using real data.
(Hatzakis, Wallace 2006)
• Multi-level and multi-objective optimization is used to improve the optimization performance and to select the optimal optimization.
• Multi-level optimization decreases the computational cost and is time consuming.
(Hansen, Horst 2008)
• A hydrological forecasting model yields accurate forecasting using different evaluation criteria.
• A forecasting error model is used to evaluate the forecasting, but other forecasting error models must be studied. These models have different evaluation equations for the forecasted data.
(Wang, W., Chau et al. 2009)
• A new hybrid correction method based on ARIMA model, SVR and CSA performs better forecasting than each individual method.
• The new model is capable of only short-term forecasting.
(Kavousi-Fard, Kavousi-Fard 2013)
• A hybrid system of a GA and an ANN improves the accuracy of the forecasting method in terms of the fitness function. • This model can deal with poor-quality data that have a large
amount of missing content.
(de Mattos Neto, Paulo SG, Cavalcanti
et al. 2015)
• A hybrid model with a neural network and a GA yielded highly accurate forecasting and the best performance.
• This model must be compared with other existed methods to show the strength of the proposed model.