INTERNATIONAL DESIGN CONFERENCE – DESIGN 2020 https://doi.org/10.1017/dsd.2020.46
PARTICIPATORY INVOLVEMENT AND MULTITHEORETICAL
PERSPECTIVES IN VISUAL MANAGEMENT DESIGN
C. Söderlund
, U. Florin, J. Lundin and K. Uggla
Mälardalen University, Sweden carina.soderlund@mdh.se
Abstract
This paper deals with the development of participatory methods in visual management (VM) when investigating parts and system/s related to VM devices in organisational contexts. Four theoretical perspectives – sociocultural theory, boundary objects, diagrams, maps and models, and visual rhetoric – have been applied to gain an overall understanding of the participants’ collective investigation of the system/s. Managers and co-workers in five Lean-inspired organisations have used the method Multimodal Origami (MO) to design their VM devices, in this case the VM boards and associated meetings.
Keywords: participatory design, collaborative design, design methods, visualisation, visual management
1. Introduction
This paper deals with the evaluation and development of participatory design methods, which can be applied when designing visual management devices (VM-devices). This study is part of a research project on visual management (VM), that focuses on devices which presents visual, verbal and audial information to give warnings, explanations, instructions and directions within Lean inspired organisations.
Historically, VM, i.e. visual control, can be linked to systematic management and impersonal systems to achieve efficient organisations and control over the production, as well as to one of its predecessors, H. W. Taylor’s scientific management (Yates, 1993). However, VM is an intrinsic part of the Toyota Production System and its Lean philosophy (Koskela et al., 2018). VM has a central role in Lean, and one of 14 management principles in manufacturing (Liker, 2004). VM, its visual information and communication, are cherished in Lean production and manufacturing, and its related literature. Nevertheless, visual research and visual studies in management are limited (Davison et al., 2012; Bell and Davison, 2013; Beynon-Davis and Lederman, 2017), with few exceptions (e.g. Bell and Davison, 2013; Meyer et al., 2013) and there is a limited amount of studies based on design research.
When designing VM-devices in Lean-inspired companies/organisations, the users’ opinions and needs should be taken into consideration, and a human-centred design approach is relevant (Kurdve et al., 2019). Today, human-centred design or user-centred design is more or less merged with the participatory design approach, which includes the user and other relevant stakeholders in the process, as co-designers or co-creators (Sanders and Stappers, 2008). It is a Scandinavian tradition, based on a simple, albeit complex idea that the people affected by a design should have something to say about it
(Björgvinsson et al., 2010). Participatory involvement requires a dialogue between designers, users and stakeholders to gain an inclusive and democratic design process.
Beynon-Davis and Lederman (2017) suggest a holistic approach to VM design. The use of VM-devices is influenced by contextual issues since they are part of a larger context. To add on to the holistic view, Florin and Söderlund (2018) suggest a collaborative approach to VM design that intertwines design thinking and systems thinking. It connects to the ideas of Buchanan (2019), and a VM device can then be approached as a system with interrelating design parts, i.e. text, graphical elements, pictures, colours, as well as an artefact that interconnect with a larger information and communication system.
There are several methods including users and other stakeholders to investigate interrelations and interactions as parts in larger systems, that users are interacting with or within, for instance, desktop walkthrough (Blomqvist et al., 2016), system mapping (Stickborn et al., 2018) or business origami by Hitachi (Atsushi Katayama et al., 2015). The latter gave inspiration to the participatory method Multimodal Origami (MO) – a beta-version – by Florin and Söderlund (2018). Through MO, it is possible to investigate and describe interrelations and interactions between VM-devices, artefacts and people within an organisation. MO is based on systems and design thinking, gestalt theory, the boundary object theory by Star and Griesemer (1989), and Bates information theory (2006), which is applied in our previous research to illustrate how different types of information interrelate and influence our comprehension, use and design of information within an organisation (Söderlund and Lundin, 2017). This current paper presents an initial attempt to further develop the MO method. The aim is to examine the interactions among participants and the visual outcome when they play MO, by applying a theoretical framework related to visual studies and information design research. By doing so we evaluate the method MO and develop design methods and theories, which can be applied when designing VM-devices. We ask: with what do the theories contribute when analysing and explaining the findings from a participatory method such as MO?
This paper is delimited to one specific VM device, namely boards for daily control and visual planning. They are hereby called VM-boards (i.e. Lean boards, visual planning board, performance measurement boards, and pulse boards). This type of board may present technical information, such as work goals, key performance measurements, peoples’ absence from work, work priorities and general information such as union information. Employees meet on a regular basis at the boards to exchange knowledge and share/spread work-related information and to perform continuous improvement within the organisation.
Figure 1. A VM-board at a municipality office
The paper is structured as follows, initially, there is a description of the method MO and then we present a selection of empirical data, collected as the method was used by participants from five different organisations. This is followed by a presentation of four theoretical perspectives relevant to visual studies and information design research, finally, the theories are applied to elucidate different aspects of the participants’ interactions when using the method, and the visual material, which the method generated.
2. Method and findings
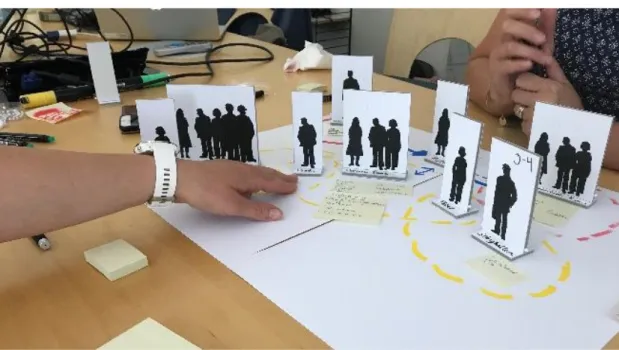
The method MO consists of a toolkit including a game board (a white canvas), game pieces i.e. markers in red, gold, yellow, green and blue, post-it, transparent paper, wooden sticks and a set of characters (tangible tokens, full-body, outlined). This beta-version has two sets of characters, depending on the type of organisation, see Figure 2 and 4b. The study where carried out during a period of eight months, 2018. MO was applied during six sessions, approximately 1-1.5 hours, with 20 participants representing five companies/organisations. (The first session was conducted in a design studio at our university, the following sessions where carried out at the companies, in their office-environment.)
One session with two managers at a municipality office
Two sessions on one occasion with four managers from two small-medium manufacturing companies (SME).
One session with four managers at a large multinational manufacturing company
Two sessions on one occasion with 10 participants at a large multinational manufacturing company. One group with managers and one group with operators, repairmen and technicians, among others.
The researchers observed the game sessions with the aim to expose how the participants interact with the game (the game board, the game pieces and with each other), and the visual outcome. The researchers (1-3) facilitated each session. They influenced the game session by scaffolding the participants; however, their role is not further elaborated on in this paper, due to space limitations.
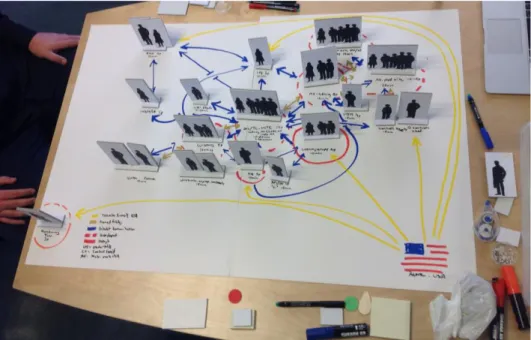
Figure 2. A MO session at a large manufacturing company
The participants took part of instructions, both oral and written, before playing MO. They were instructed to choose a character representing themselves and the staff that usually participate at the board meetings. The most central VM-board and meeting were to be marked on the game board with a dashed or soiled circle (dashed lines represent meetings that receive or send information to other meetings or channels; solid lines represent meetings that do not). All other meetings related to the central board should be displayed on the canvas. Finally, arrows should be added to visualise the interactions between meetings, boards, workers, or other information channels.
We audio-recorded the sessions to capture the participants’ dialogue, their reflections and reasoning whilst playing, and we photographed the session and the progress of the game boards’ scene. Based on the recordings, keynotes were marked, and representative quotations were noted. Similarities and dissimilarities between game sessions were noted, which culminated in keywords. Based on the
keywords, empirical data are clustered in four categories: game procedure, discussion themes, game pieces and the boards’ scenes.
Figure 3. A MO-session at a SME-manufacturing company
2.1. Findings
A selection of empirical data is presented, representing how the participants play MO (Game procedure), the discussion during the play (Discussion themes), their interactions with the tools and tokens (Game pieces), and the game boards’ visual appearance; the tools and tokens, written text, graphical elements and colours (The board scene).
2.1.1. Game procedure
The participants collected pens, pencils, post-its and characters. They added functions and roles to the characters and named the meetings during the play, orally and by written words, more frequent at the beginning and in the middle of the sessions. They reflected upon how to draw on the canvas and drew and pointed at the circles representing the VM-boards and -meetings, and at the arrows and lines representing the interactions between them. The participants moved, changed and pointed at the characters. They wrote additional information regarding functions, roles, and meetings on a post-it, or at the game board.
2.1.2. Discussion themes
The participants’ actions and discussion were constrained and guided by the instructions. Once the concept of “central” was discussed, however it refers to a hub or the most important meeting at the company. During the game, the participants discussed and argued about the number of VM-boards, types of meetings, meeting structure, agenda, the meeting time (morning, afternoon). The characters’ clothes and attributes (for instance skirts and earmuffs) were discussed, and whether they followed the routines and regulations of the company/organisation. This is exemplified by two quotes from a session with one of the large manufacturing companies: “It is not often we have skirts”, said one of the participants, “It is not allowed” said the other one. As the game progressed the participants reflected upon the present situation, namely who and which functions, titles and roles of people that participate in the meetings and which meeting reports to which. They reflected on the desired state, namely who ought to participate in the meetings, or which meeting should report to another one. Questions regarding uncertainties were raised, for instance, the uncertainty of information flows or the purposes of VM-boards and their meetings.
2.1.3. Game pieces
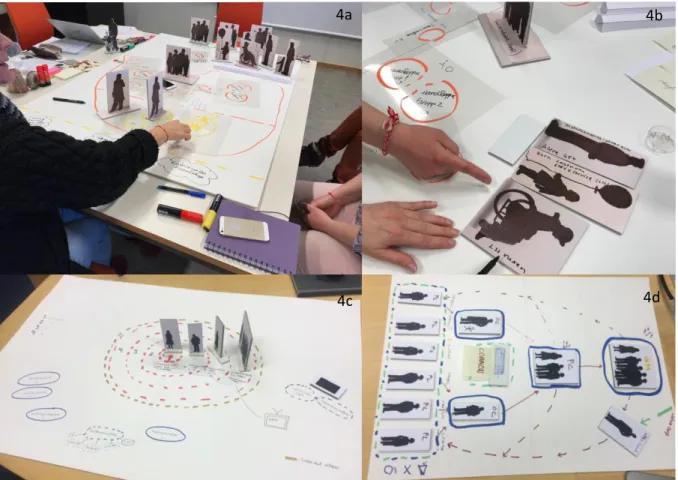
The characters were chosen to represent the participants’ co-workers or other people, for instance, customers. This is exemplified by the quote: “Here is Marie”, said one of the participants when resembling a colleague with a character. It is unclear whether or how often the participants selected characters representing themselves. Abstract game pieces were added by the facilitator, that is a black circle and a square, which in one session the participants used to represent their computerised system, see Figure 4c. In two sessions, the participants made their own drawings on the game board instead of using the game pieces, a TV (see Figure 4c) and a black rectangle representing their computerised maintenance system (see Figure 4d). The participants did not add further game pieces or changed them; and they did not use the wooden game pieces.
Figure 4. Photographs from three MO sessions, one at a municipality office, and two sessions at large manufacturing company
2.1.4. The board scene
VM-boards, artefacts, people and a diversity of information sources within the organisation, their interactions and interrelations, were represented by written descriptions on the characters, the board, or on post-its. The colours red, yellow and blue are dominant. The circles differed in colours and size, and have dashed or solid lines, or a mixture of both. The lines differ in colours and thickness, length, and shape (e.g. straight, bent, solid, dashed, a mixture of dashed and solid), and the majority are double- or single-headed arrows. One scene has a hand-drawn picture of a TV, and another one a hand-drawn black square representing a computerised system. The canvas size and the scenes differ between game sessions. One game board represents a circular relationship between people, meetings and VM-boards (see Figure 4c), the other ones a mixture of linear and circular relationships. The characters were standing up (head-up), except in one session, when the managers laid down the characters and glued them to the game board with their head towards the main factory meeting, see Figure 4d.
4a
4c 4d
3. Four theoretical approaches to VM and design
In this study, four theories are applied, to further illuminate the interactions among participants and the and visual outcome when they play MO. These theories are the theory of boundary objects, visual theory related to diagrams, maps and models, visual rhetoric and sociocultural theory. The theories have been applied in our previous research in visual studies and information design, for instance in information design in condition monitoring on the basis of the interrelations of various information forms and sources in industrial settings (Andersson, 2010); knowledge-forming processes, and how artefacts can facilitate understanding and the collective meaning creation (Florin, 2012); mapping processes in conceptual art and visualisation of time in production planning (Uggla and Eriksson, 2019); and when designing technical communication from a sociocultural perspective (Lundin, 2019).
3.1. Boundary objects - a bridging capacity
Through the boundary object, it is possible to identify intermediating qualities in the game boards’ scenes, that support knowledge-sharing amongst participants. Boundaries, as differences in experience, expertise and domain-related understanding, have to be bridged to nurture true communication. This is especially critical when teams of professionals with different experience and skills work together to solve complex tasks, or when such heterogeneous teams work together with the daily planning and steering in factories and organisations.
Florin and Eriksson (2019) argue that boundary object qualities can be a resource for communication and enhance the planning work of different kinds. Star and Griesemer originally defined boundary objects as “objects which are both plastic enough to adapt to local needs and the constraints of the several parties employing them, yet robust enough to maintain a common identity across sites” (1989 p. 393).
Central to their concept was that objects can have qualities that are simultaneously both weakly structured (supporting common use) and strongly structured (supporting individual use). This means that boundary objects at the same time are: concrete and abstract, specific and general, conventionalised and customised. Star and Griesemer identified four types: repository, ideal, coincident and standardised (1989, pp. 410, 411). In this case, we give prominence to the ideal and standardised types. What is crucial is to identify qualities as recognisable and tangible visual elements that support knowledge transfer (Florin 2012, 2015).
3.2. Diagrams, maps and models
The concept of the diagram is applied to analyse how MO and its characters and game board represent a company or organisation. This mode of representation can be seen as diagrammatic, since maps and models aid the participants’ interpretation and overview of their VM-boards and meetings.
The diagram is one way of representing and organising complex realities, such as an organisation. The concept of the diagram, from the Greek graphein or gramme – refers to a written, drawn or painted trace, inscription or graphic marks on a surface (Krämer 2016, Latour 1990, Mitchell 1986). A diagram could be an image on a two-dimensional surface which has the capacity to contain large amounts of information, making absent things present.
The diagram, like the map, in semiotic terms, is a configuration of signs, which by way of agreement represent something outside of the inscriptions on a surface or equivalent. In the case of the map, it would be a territory, real or fictitious (Cosgrove 2008). Diagrams represent the complexity of relations and connections and do not only capture and organise large amounts of information; their reductivity, from realism to abstraction and their recurrent use of simple geometrical shapes is one secret as to why they can hold so much information (Bender and Marrinan 2010, Kress and Van Leeuwen 2006). The way that diagrams represent events and spaces outside of themselves in different extents of realism is in this paper referred to as a diagrammatic mode of representation.
3.3. Visual rhetoric
Visual rhetoric is applied to explain the game board’s scene, its tropes and figures, as visual arguments that are raised when the participants are communicating during the game session, and how it affects their interaction and behaviour.
Classical rhetoric is associated with Aristotle, who made it a doctrine (the Art of Rhetoric, trans. 1991). Contemporary rhetoric includes a holistic approach that relates to contexts (internal, external), including the context of the orator, the media, the audience, and the surrounding environment, which are all constraints or possibilities for communication. These are parts of a rhetorical situation. Change is then relevant representing a dilemma we wish to modify. That change is embodied by the audience, through their actions and behaviours (Bitzer, 1968).
Classical rhetoric relates to language and speeches. Today, rhetoric relates to visual communication as well. Barthes (1985) discussed the rhetoric of the image, Ehses (1995) the rhetoric in graphical design, and Kostelnic and Hasset (2003) the rhetoric of visual conventions such as graphs, text, and illustrations. The argument is a highly relevant concept when rhetoric is brought up on the agenda. This is supported by tools/methods such as the disposition, the Aristotelian concepts of ethos, logos and pathos, or tropes such as metaphors, allegories, metonymy, as well as other rhetorical qualities. It could be questioned whether a visual representation can be considered as an argument. However, a VM device, and VM-boards specifically, is combined with e.g. text, colour/light or colour symbols, based on convention. This combination of verbal and non-verbal can be referred to as rhetorical (Fleming, 1996).
3.4. Sociocultural theory
Sociocultural theory is applied to investigate how MO may support the participants to interactive learning and knowledge development, and how the board game and the game pieces act as mediating agents channelling the participants’ thoughts and actions.
Sociocultural theory, originally developed by Vygotsky, emphasises a relationship between external socially regulated behaviour and internal (cognitive) individual behaviour (Vygotsky et al., 1978). Furthermore, this theory emphasises motivation and action as a central component for learning and development, as thoughts influence action and the results of one’s action influence thought. What the individual learns by interacting with others in sociocultural situations influences the internalisation and development of cognitive functions such as knowledge, memory, and attention.
For such learning and development to take place, the presence of tools, or mediating agents, is central, for example, oral speech, text, images, symbols, diagrams and maps (Kozulin, 1998). When a more knowledgeable or other peer introduces the meaning of an agent (by for example pointing to signify an object in the individuals’ surroundings), they mediate the individuals’ thoughts. Moreover, actions can act as a mediating agent and mediate thoughts (Vygotsky, Cole & John-Steiner, 1978). As such, the writings of Marx and Engels played a central role for Vygotsky, in that material life and labour activity is crucial in the creation of human consciousness (Wertsch, 1985, p.77), our cognitive awareness.
4. Analysis and discussion
The game board is a spatial representation of parts and systems of which the VM-boards and the meetings are a part. In MO, two different diagrammatic modes of representation are used: the game board as a map of the organisation and the characters as models of the people within it. By agreement, the level of abstraction in a representation functions as a way for the participants to get an overview of the situation.
The boards’ scene gives an overview of, for instance, who participates at meetings and how many, their functions and roles, and how information flows between VM-boards and meetings within the organisation. The game boards’ scenes consist of graphical elements such as circles with dashed or solid lines, two-headed and single-headed arrows and boxes; these are abstract figures that develop during the game. Such abstract figures create a space for negotiation (Uggla and Eriksson, 2019). This also relates to the boundary object phenomenon, in this case, the ideal and standardised types (Star and Griesemer, 1989) where both the VM-boards as such and the MO method fit, with their spatial and
diagrammatic qualities – fairly open but exact at the same time. These simultaneously definite and uncertain qualities are useful to support the ‘up-to-the-minute’ knowledge sharing while playing. The participants’ experience and knowledge of the system they and the VM-boards are a part of, are recognised in their dialogue and discussion on peoples’ roles and functions, meeting agenda and meeting hierarchies, within the organisation. The participants identify people and functions with the characters’ designated clothes and attributes. The degree of naturalism (gender, ethnicity and level of details) may affect how or whether the participants make a correlation between the actual situation and the representation (characters), and what that correlation is based on.
How the game board and the scene are manifested depends on the participants. The participants’ discussion and arguments, and interactions impact the diagrammatic representation. The scene, with its characters, text, colours, pictures and graphical elements are given specific terms and names during the game, representing artefacts, people and events within the organisation. The participants focus on the game board, and interact and collaborate with one another by using terminology and naming of the game pieces, adding text, pointing at the scene, and by changing and moving characters. The board’s scene, as a diagram, depicts visual and verbal elements representing the relationships and connections (Bender and Marrinan 2010). Then the design of the game pieces, in terms of their shape, colours, sizes, materials and how the design relates to existing objects and individuals in the activity system becomes a vital part to acknowledge.
One of the game boards has character pieces lying down, with their heads pointing at the organisation’s factory-board, which is the “highest level” of VM-boards on the shop floor. It functions as a metaphor for the company’s hierarchy. The game boards become symbolic representations of the company and organisation building, including its objects, people and artefacts, their moving patterns and locations and their interrelations. The scenes’ diagrammatic representations have a logical appeal, and the visual convention is created while the participants are playing. The scene of the game boards becomes a condensed generalisation of the current situation related to the VM-boards and their meetings. The participants negotiate about the appearance of this current condition. Whilst playing, the participants argue for the desired situation and how things ought to be. This argumentation highlights a dilemma (Bitzer, 1968), something that needs to be changed within the system. It calls for reflection and action amongst the participants. In the game sessions, participants use the board’s scene and its game pieces to explain or convince themselves and one another of relevant changes within the organisation, related to their VM-boards and -meetings.
During the game, the participants expressed feelings and opinions of the systems they are a part of, through the opportunities to create a representation of a “world” outside. This is something that everyone has experience of, but it can be expressed in different ways. A MO playing session can be viewed as an activity setting, where some participants have more or less experience and knowledge about the VM-boards and the associated meetings than others. When more knowledgeable participants talk about a game piece or the scene and relate it to the VM-boards and meetings in their organisation, it mediates the other participants’ thoughts about the information and communication situation, which the VM-boards are a part of. When reaching a shared view, it supports the participants and the researchers learning and development of the interrelations and interactions between VM-devices, artefacts and people, in line with the sociocultural theory of Vygotsky et al. (1978). As the learning process unfolds, it allows participants to recall knowledge which means that they can contribute to the discussion to support others to learn. The facilitators (the researchers) support the participants on how to play MO, by scaffolding, using instruction, questioning and feedback. However, as the game session progressed, the participants learn how to play MO, and they need less support from the facilitators. When the play ends, the game board and its scene represent a learning process, which manifests both the participant’s prior knowledge and what became new knowledge related to their VM-boards and meetings, and the information- and communication system in their working environment.
5. Conclusions
The participatory method multimodal origami (MO) has been tested and evaluated, to contribute to method development in visual management design (VM design). Participants representing five Lean-inspired organisations have used the method to develop their visual devices, in this case, their
VM-boards with their associated meetings. Via MO the participants were able to investigate and describe their organisations’ information and communication system(s) with its related parts. The systems and their parts become in this way visual and tangible to the participants. The method supports the participants’ dialogues and their collaborative visualisation, which emerges while using the MO method in groups. Four theories (theory of boundary objects, diagrams, maps and models, visual rhetoric and sociocultural theory) have been applied to discover and gain an overall understanding of the participants’ collective investigation.
The theories illuminate a complex situation, involving people, artefacts, events and their interrelations and interactions with one another and the VM-devices in a sociocultural context. By means of these theories, it is possible to explain how the participants’ diagrammatic visualisation can provide an overview of an actual information and communication situation and contribute to the understanding of a new and desired one. This multiple theoretical perspective supports a holistic and multifaceted analysis of the empirical data and how one can explain in what way participatory methods such as MO can support learning and knowledge development. The theories contribute insights relevant to developing and (re)designing VM-devices and the information and communication situation they are part of, as well as to further develop the tested method, which is also applicable to similar methods.
Acknowledgement
Parts of the empirical data have been discussed during a poster session at SIGDOC 2019, and part of the MO method was introduced at OR60 ‘Anniversary’ Conference in the Systems Thinking Stream, 2018. Reflections based on the discussions are included in this manuscript. This research is a part of the research project Vis’man, Visual and spatial management and communication from the users’ perspective, the Information Design research group at Mälardalen University. Vis’man is supported by the Swedish Knowledge Foundation.
References
Andersson, C. (2010), Informationsdesign i tillståndsövervakning: En studie av ett bildskärmsbaserat användargränssnitt för tillståndsövervakning och tillståndsbaserat underhåll. Eng title: Information Design in Condition Monitoring, [PhD Thesis], Mälardalen University, Västerås.
Bates, M.J. (2006), “Fundamental Forms of Information”, Journal of the American Society for Information Science and Technology, Vol. 57 No. 8, pp. 1033-1045. https://doi.org/10.1002/asi.20369
Bell, E. and Davison, J. (2013), “Visual Management Studies: Empirical and Theoretical Approaches”, International Journal of Management Reviews, Vol. 15 No. 2, pp. 167-184. https://doi.org/10.1111/j.1468-2370.2012.00342.x
Bender, J. and Marrinan, M. (2010), The Culture of Diagram, Stanford University Press, Calif., Stanford. Barthes, R. (1985), “Rhetoric of the Image”, In: Howard, R. (Ed.), The responsibility of forms: critical essays on
music, art, and representation, Hill and Wang, New York, pp. 21-40.
Beynon-Davies, P. and Lederman, R. (2017), “Making sense of visual management through affordance theory”, Production Planning & Control, Vol. 28 No. 2, pp. 142-157. https://doi.org/10.1080/09537287.2016.1243267 Bitzer, L.F. (1968), “The rhetorical situation”, Philosophy and Rhetoric, Vol. 1, pp. 1-14.
Blomkvist, J., Fjuk, A. and Sayapina, V. (2016), “Low Threshold Service Design: Desktop Walkthrough”, Proceedings of ServDes, Fifth Service Design and Innovation conference, 2016, Linköping University Electronic Press, Linköping, pp. 154-166.
Björgvinsson, E., Ehn, P. and Hillgren, P.-A. (2010), “Participatory design and democratizing innovation”, PCD ‘10 Proceedings of the 11th Biennial Participatory Design Conference, Sydney, Australia, pp. 41-50. Buchanan, R. (2019), “Systems Thinking and Design Thinking: The Search for Principles in the World We Are
Making”, She Ji: The Journal of Design, Economics, and Innovation, Vol. 5 No. 2, pp. 85-104.
Cosgrove, D. (2008), Geography and Vision: Seeing, Imagining and Representing the World, Tauris, London. Davison, J., McLean, C. and Warren, S. (2012), “Exploring the visual in organizations and management”,
Qualitative Research in Organizations and Management: An International Journal, Vol. 7 No. 1, pp. 5-15.
https://doi.org/10.1108/17465641211223528
Ehses, H.J. (1995), “Visual rhetoric: Old ideas, strange figures, and new perspectives”, Graphic Design Journal, No. 3, pp. 3-9.
Florin, U. (2015), Konstnärskap i samspel: om skapande arbetsprocesser i myndighetsledda samverkansprojekt, Eng title: Artists in Interaction: Creation Processes in Official Collaborative Projects, [PhD Thesis], Mälardalen University. Västerås.
Florin, U., Eriksson, Y. and Orre, I. (2012), “Designing a Model of the Unknown: Artistic Impact in a Chain of Skilled Decisions”, Proceedings of the DESIGN 2012, 12th International Design Conference, Vol. 3, Dubrovnik, Croatia, pp. 1977-1986.
Florin, U. and Eriksson, Y. (2019), Activating Boundary Objects: Visual Awareness Aiding Communication, submitted to Design Principles and Practises - An International Journal.
Katayama, A. et al. (2015), “Trends in Design and Associated IP Management”, Hitachi Review, Vol. 64 No. 6, pp. 50.
Koskela, L., Tezel, A. and Tzortzopoulos, P. (2018), “Why Visual Management?”, Proceedings of the 26th Annual Conference of the International Group for Lean Construction, 18-20 July 2018, Chennai, India, pp. 250-260. https://doi.org/10.24928/2018/0527
Kostelnick, C. and Hassett, M. (2003), Shaping Information: The Rhetoric of Visual Conventions, Southern Illinois University Press, Carbondale, IL.
Kozulin, A. (1998), Psychological tools: A sociocultural approach to education. Harvard University Press. Kress, G. and Van Leeuwen, T. (2006), Reading Images: The Grammar of Visual Design, Routledge, London. Krämer, S. (2016), Medium, Messenger, Transmission: An Approach to Media Philosophy, Amsterdam
University Press, Amsterdam.
Kurdve, M. et al. (2019), “Designing visual management in manufacturing from a user perspective”, Procedia CIRP, 29th CIRP Design Conference 2019, 08-10 May 2019, Póvoa de Varzim, Portugal, Vol. 84, pp. 886-891. Latour, B. (1990), “Drawing Things Together”, In: Lynch, M. and Woolgar, S. (Eds.), Representation in
Scientific Practice, Mass MIT Press, Cambridge.
Liker, J. (2004), The Toyota way: 14 management principles from the world’s greatest manufacturer. [Electronic version], McGraw-Hill, New York.
Lundin, J. (2019), “Designing technical information from a sociocultural theoretical perspective”, Proceedings of the 2nd SIG Conference, Human Behaviour in Design (HBiD 2019), Tutzing, Germany.
https://doi.org/10.18726/2019_2
Meyer, R.E. et al. (2013), “The Visual Dimension in Organising, Organisation, and Organisation Research Core Ideas, Current Developments, and Promising Avenues”, The Academy of Management Annals, Vol. 7 No. 1, pp. 487-553. https://doi.org/10.1080/19416520.2013.781867
Mitchell, W. (1986), Iconology: Image, Text, Ideology, University of Chicago Press, Chicago.
Sanders, E.B.N. and Stappers, P.J. (2008), “Co-creation and the new landscapes of design”, CoDesign International Journal of CoCreation in Design and the Arts, Vol. 4 No. 1, pp. 5-18. https://doi.org/10.10 80/15710880701875068
Star, S.L. and Griesemer, J.R. (1989), “Institutional Ecology, Translations and Boundary Objects: Amateurs and Professionals in Berkley’s Museum of Vertebrate Zoology”, Social Studies of Science, Vol. 19 No. 3, pp. 1907-39. https://doi.org/10.1177/030631289019003001
Stickdorn, M. et al. (2018), A Practitioner’s Handbook, This Is Service, Design Doing Applying Service Design Thinking in the Real World, [online] O’Reilly, available at: https://www.thisisservicedesigndoing.com/me thods (accessed 09.28.2019).
Söderlund, C. and Lundin, J. (2016), “What is an information source? information design based on information source selection behavior”, Communication Design Quarterly Review, Vol. 4 No. 3, pp. 12-19. https://doi.org/10.1145/3071078.3071081
Uggla, K. and Eriksson, Y. (2019), “Visualization of Production Planning”, Proceedings of the 2019 23rd International Conference Information Visualisation (IV), Paris, France, pp. 312-317.
Vygotsky, L.S., Cole, M. and John-Steiner, E. (1978), Mind in Society: Development of Higher Psychological Processes, Harvard University Press, Cambridge, Massachusetts, London, England Harvard.
https://doi.org/10.2307/j.ctvjf9vz4
Wertsch, J.V. (1985), Vygotsky and the Social Formation of Mind, Harvard University Press, Cambridge, Massachusetts, London, England Harvard.
Yates, J.A. (1993), Control Through Communication: The Rise of System in American Management, Paper backs edition. The John Hopkins University Press, Baltimore, Maryland.