Potential for mitigating GHG
emissions at a Swedish
wastewater treatment plant – a
life cycle approach
Nina Aldén
Department of physical geography
GE9020 Geography, Degree Project 30 credits, GA 58 Master’s programme in Globalization, environment and social change (120 credits)
Spring term 2020
Preface
This Master’s thesis is Nina Aldén’s degree project in Geography at the Department of
Physical Geography, Stockholm University. The Master’s thesis comprises 30 credits (one
term of full-time studies).
Supervisor has been Salim Belyazid at the Department of Physical Geography, Stockholm
University and Frida Österdahl at Roslagsvatten AB. Examiner has been Mattias Winterdahl
at the Department of Physical Geography, Stockholm University.
The author is responsible for the contents of this thesis.
Stockholm, 1 September 2020
Björn Gunnarson
Vice Director of studies
II
Potential for mitigating GHG
emissions at a Swedish
wastewater treatment plant – a
life cycle approach
Nina Aldén
Abstract
To meet the national and international climate goals every potential GHG mitigating effort needs to be addressed. The aim of this thesis is to investigate if the wastewater treatment plant (WWTP), Ekebyhov, can reduce its GHG emissions by making changes in the treatment process. The main GHGs emitted from WWT are N2O, CH4 and CO2. To begin with, Ekebyhov’s current carbon footprint was calculated
in a base line scenario, using a calculation tool (ECT). The results showed that the total footprint amounted to 522 tons CO2eq per year, with the majority of the emissions (83 %) from the activated
sludge process. Five GHG-mitigating measures were identified and potential GHG emission reduction (PGER) was calculated from 1) optimized WWT, 2) urea treated sludge, 3) change of chemicals, 4) green transports and 5) added anaerobic digestion (AD) process. The largest PGER came from added AD, followed by optimized WWT. Finally, the PGER for all measures was calculated and resulted in net negative emissions of -95 tons CO2eq per year. The thesis shows that it is possible to reduce the
carbon footprint of Ekebyhov WWTP, even to a net negative result. It is, however important to address other impact categories in a full LCA to be able to make fully informed decisions.
Keywords
GHG emissions, Wastewater treatment, Sewage sludge, Life cycle analysis, Mitigation, Carbon footprint, Global warming potential
III
Contents
1. Introduction ... 1 2. Aim ... 1 3. Background ... 2 3.1 Wastewater treatment ... 23.1.1 Municipal wastewater treatment ... 2
3.1.2 Wastewater treatment process ... 2
3.1.3 Regulations ... 4
3.1.4 Ekebyhov ... 4
3.2 Global Warming ... 7
3.2.1 Greenhouse gases, GWP and CO2eq ... 7
4. Method ... 9
4.1 Literature review ... 9
4.2 Study visit ... 9
4.3 Life cycle assessment ... 9
4.3.1 Impact categories ...10
4.3.2 Functional unit ...10
4.3.3 System description and boundaries ...11
4.3.4 System inventory ...11
4.4 Calculation tool ...12
4.4.1 Assumptions ...12
4.5 Data collection ...13
5. Results and discussion ... 15
5.1 Baseline ...15
5.2 Sensitivity analysis ...19
5.3 Possible future measures ...21
5.3.1 Measure 1, regarding wastewater treatment ...21
5.3.2 Measure 2, regarding sludge treatment ...22
5.3.3 Measure 3, regarding chemicals ...23
5.3.4 Measure 4, regarding transports ...24
5.3.5 Measure 5, regarding biogas use ...25
5.3.6 All measures ...27
5.4 Feasibility of proposed measures ...28
5.5 Implications of methodical limitations ...29
IV
References ... 32
Appendix 1. Data set ... 37
Appendix 2. Results by source ... 40
Appendix 3. Sensitivity analysis ... 41
Appendix 4. Results with different functional units ... 42
Abbreviations
ASP – Activated sludge processBOD7 – Biochemical oxygen demand. A
measurement of organic material as the amount of oxygen required to biologically break down the material
C – Carbon
CDR – Carbon dioxide removal CH4 – Methane
CO2 – Carbon dioxide
CO2eq – Carbon dioxide equivalents
COD – Chemical oxygen demand. A measurement of organic material as the amount of oxygen required to chemically break down the material
DS – Dry substance
ECT – Excel calculating tool EF – Emission factor
FU – Functional unit GHG – Greenhouse gas
GWP – Global warming potential LCA – Life cycle assessment N – Nitrogen
NH4+ – Ammonium
N2O – Nitrous oxide
NET – Negative emissions technique P – Phosphorus
PE – Population equivalent, the average amount of BOD7 per person and day
PGER – Potential GHG emission reduction Ppm – Parts per million
SS – Sewage sludge TS – Total Solids VS – Volatile Solids WW - Wastewater
WWT – wastewater treatment WWTP – Wastewater treatment plant
V
Acknowledgements
This report is the graduation thesis of the master’s program Globalization, environment and social change at Stockholm university. It was constructed as a cooperation with Roslagsvatten AB, with one of their wastewater treatment plants as case study.
First of all, I would like to express my gratitude to the staff at Roslagsvatten who have welcomed me to their place of work and provided useful information and support whenever needed, and to Roslagsvatten AB for allowing me to study one of their wastewater treatment plants.
I am grateful to my supervisor, Salim Belyazid for the invaluable support and constructive advice throughout the process, and to the department of physical geography at Stockholm university for providing the opportunity to write the master´s thesis.
Last but not least I am thankful to my family who offered support, kind words, solidarity, joy, distractions and encouragement throughout the whole process.
Stockholm, June 2020
1
1. Introduction
The possible effects of global warming are a great threat to our civilization, including rising sea levels, extreme weather, loss of species, food and water shortages, human health impacts etc. (IPCC, 2018; Steffen, et al., 2018). In the Paris-agreement from COP21 in Paris 2015, the world’s leaders agreed to a common cause to undertake ambitious mitigating efforts to combat climate change and limit global warming to a temperature rise well below 2°C, aiming for 1,5°C (UNFCCC, 2015). Despite this, it is estimated that human activities have already caused a global temperature rise of 1°C, and if the greenhouse gas (GHG) emissions continue in the current rate, global warming will reach 1,5°C between 2030 and 2052 (IPCC, 2018).
Models from the Intergovernmental Panel for Climate Change (IPCC) estimate that, to stay below 1,5°C, the anthropogenic CO2 emissions need to decline by 45% from 2010 levels by 2030 and reach net zero
by 2050. Simultaneously, other GHGs such as methane and nitrous oxide, should be reduced as much as possible, more than 35%. To reduce the emissions in time, the actions need to be ambitious and include every level of every society (IPCC, 2018).
The treatment of waste and wastewater has been identified as key sectors amongst the anthropogenic sources of GHG emissions since it, in 2010, represented 3% of total global GHG emissions and is correlated to economic and population growth (Blanco, et al., 2014; Fang, et al., 2019). In 2010, wastewater treatment represented 54% of the GHGs emitted from the waste sector (Blanco, et al., 2014). The main GHGs emitted from wastewater treatment (WWT) are methane (CH4) and nitrous oxide (N2O)
(Jönsson, et al., 2015; Koh & Shaw, 2015), gases that have, respectively, 34 and 298 times stronger radiative forcing effect than carbon dioxide (CO2) (Myhre, et al., 2013). This entails that reducing the
emissions of CH4 and N2O is of vital importance and makes WWT plants (WWTP) important actors in
the effort to mitigate GHG-emissions and combat climate change.
In 2017 a new climate framework was adopted by the Swedish parliament to meet the targets set by the Paris agreement (Swedish Government, 2017). The framework consists of three parts: 1) A legislative “Climate Act”, ensuring the continued work towards reduced GHG emissions; 2) ambitious climate goals, the leading one being “net zero emissions by 2045”; and 3) A climate policy council, instructed to review decisions and make sure they are leading in the right direction.
To reach the goals set by both the Paris agreement and the Swedish parliament, the per capita carbon footprint needs to be as far below 2 tons as possible by 2050 (Swedish EPA , 2020). The Swedish GHG emissions per capita and year varies today between 5 and 9 tons depending on how it is measured. The last few years the average consumption based GHG emissions has been stable around 9 tons per person and year (Swedish EPA, 2020) and territorial emissions were 5,11 tons per capita 2018 (Swedish EPA, 2019)), out of which 21 kg originated from the municipal WWT (SCB, 2020).
In 2018 214,7 kilo tons CO2eq were emitted from the Swedish WWT sector (SCB, 2020). Swedish
WWTP need to do better, but can they do better?
2. Aim
The aim of this thesis is to answer the following question:
Can the wastewater treatment plant, Ekebyhov, reduce its greenhouse gas emissions by making changes in the treatment process?
2
3. Background
The core function of a WWTP is to remove nutrients (P and N), organic compounds (BOD7) and other
substances that may harm the recipient ecosystem, e.g. by eutrophication and toxification. In that sense WWT is positive for the environment. However, the various processes involved in the treatment are sources of the GHGs carbon dioxide (CO2), methane (CH4) and nitrous oxide (N2O) that are harmful for
the environment and lead to global warming (Jönsson et al., 2015). Depending on which techniques are used throughout the WWT, phosphorus (P), nitrogen (N) and carbon (C) originating from the wastewater and sludge can become either valuable resources or be emitted as environmentally negative substances (Heimersson et al., 2016).
This chapter will explain the fundamentals behind WWT and the connection to global warming.
3.1 Wastewater treatment
3.1.1 Municipal wastewater treatment
Before the 1960s most of the municipal wastewater was totally uncleaned, letting nutrients, organic compounds and toxins out into rivers and lakes (Swedish EPA, 2018). This resulted in eutrophication, death of fish, loss of bathing shores and spread of diseases. Around 1960, water related environmental and public health issues came high up on the agenda, and finally lead to a big governmental investment in municipal WWTP. At first, the WWT focused on removing particles, organic compounds (BOD7)
and phosphorus (P) from the WW, but since the late 80s techniques have been added to remove nitrogen (N) (Swedish EPA, 2018). The degree of removal of P and BOD7 has been stable over 95 % for the last
decade, whereas the removal of N is lower and more varying, from 37 to 72 %. In 2016 the mean degree of removal of N was 62 %, but the degree increases with increased capacity (Swedish EPA and Statistics Sweden, 2018).
When the cleaned water leaves the WWTP, sewage sludge (SS) is left behind. The sludge contains the nutrients, organic compounds and other leftovers from the WW. The composition of the sludge is dependent on what the incoming WW contains, what have been flushed down up streams (Henriksson, et al., 2012). Pharmaceutical residues, heavy metals and various organic toxins are examples of substances the sludge may contain. Some are transformed and removed during the treatment processes, but some remain in the sludge (Henriksson, et al., 2012). There are several uses for SS. The three most common in Sweden are agricultural soil improvement, construction soil and landfill cover (Swedish EPA and Statistics Sweden, 2018).
3.1.2 Wastewater treatment process
The treatment process is generally divided into two steps: water treatment and sludge treatment.
Water treatment
The water treatment in Sweden is usually a combination of mechanical, biological and chemical treatment as shown in figure 1 (Swedish EPA, 2018). The mechanical step removes solid waste, grit, plastics, sand etc. from the WW by using screens and grit chamber. This is important to prevent problems for the pumps in the rest of the process.
3
Figure 1. A typical Swedish WWT process with mechanical, biological and chemical treatments (Swedish
EPA, 2018)(used with permission).
The biological step is called the active sludge (AS) process, where bacteria removes N and organic material (BOD7) from the WW. Aerobic and anaerobic bacteria transform organic nitrogen and
ammonia (NH4+) to nitrogen gas (N2) through nitrification and denitrification (Table 2). The aerobic
bacteria require oxygen to transform NH4+ to nitrate through two steps (nitrification). Following this
step, the anaerobic bacteria require carbon input and an anoxic environment where they can transform nitrate to nitrogen gas (denitrification)(Carlsson & Hallin, 2003; Swedish EPA, 2018). Unsuccessful nitrification or denitrification caused by e.g. too high or too low oxygen levels are sources of N2O
emissions (Carlsson & Hallin, 2003).
Table 1. The nitrification and denitrification processes (Carlsson & Hallin, 2003)
NITRIFICATION
Step 1 ammonia + oxygen → nitrite + water + hydrogen 2NH4+ + 3O2 → 2NO2- + 2H2O + 4H+
Step 2 nitrite + oxygen → nitrate 2NO2- + O2 → 2NO3
-DENITRIFICATION (SIMPLIFIED REACTION)
nitrate → nitrite → nitric oxide → nitrous oxide → nitrogen gas NO3- → NO2- → NO → N2Ο → N2
DENITRIFICATION (TOTAL REACTION)
Step 1 Nitrate + hydrogen + electrons → Nitrite + water NO3− + 2 H+ + 2 e−→ NO2− + H2O
Step 2 Nitrite + hydrogen + electrons → Nitric oxide + water NO2− + 2 H+ + e−→ NO + H2O
Step 3 Nitric oxide + hydrogen + electrons → Nitrous oxide + water 2 NO + 2 H+ + 2 e− → N2O + H2O
Step 4 Nitrous oxide + hydrogen + electrons → Nitrogen gas + water N2O + 2 H+ + 2 e− → N2 + H2O
In the chemical treatment, a chemical coagulant (e.g. aluminium sulphate or ferric sulphate) is added to flocculate the phosphorus before the water is released to the recipient (Swedish EPA, 2018).
Sludge treatment
Throughout the water treatment, the sludge is sedimented and collected. In Sweden, the most common treatment of sludge is anaerobic digestion to stabilize the sludge and take care of the emitted biogas for electricity, heat or vehicle fuel. After the anaerobic digestion the sludge is usually spread on agricultural soils or used as construction soil (Swedish EPA, 2018)
4 3.1.3 Regulations
WWT is regulated both at national and European level. The European Union adopted the Sewage Sludge Directive (86/278/EEC) in 1986, the Urban Wastewater Treatment Directive (91/271/EEC) in 1991 and the Water Framework Directive (2000/60/EC) in 2000 (Kiselev, et al., 2019; Swedish EPA, 2018). These are incorporated in Swedish legislation by the Environmental Code and several government regulations and ordinances. The most significant ones are the Swedish EPA’s regulations (NFS 2016: 6) on the treatment and control of wastewater effluent from urban areas, the Environmental Assessment Ordinance (2013: 251) (Swedish EPA, 2018), and the Ordinance for sewage sludge applied in agriculture (SNFS 1994:2).
These regulations specify allowed contents of nutrients and heavy metals, obligations when it comes to permits and reports, and required samples and inspections (Swedish EPA, 2018). The regulations may affect which measures for reduced carbon footprint that are available.
The sludge can become certified by Revaq, with the aim to provide high quality, nutrient rich sludge to agricultural soils and reduce harmful substances that the sludge may contain (Svenskt Vatten, 2020). The certification requires the organisation to be transparent and have a systematic process to improve the quality of the sludge. This includes improvements in techniques as well as working with upstream users to reduce harmful substances in the sludge. The sludge has to be tested for harmful substances with results below the allowed limits, and become properly hygenised to remove pathogens before it is spread on agricultural soils. There are several ways to hygenise the sludge, e.g. thermal treatment or storage over 6 months (Swedish EPA, 2013).
3.1.4 Ekebyhov
Ekebyhov is a small scale WWT plant in eastern Stockholm, with a capacity to treat 25000 pe. It was built in 1975 and added to 1989 following new rules for cleaning nitrogen (N). The recipient is lake Mälaren, the fresh water source for all of Stockholm. The plant treats both water from sewage lines and from private cisterns. The sewage sludge is certified by Revaq.
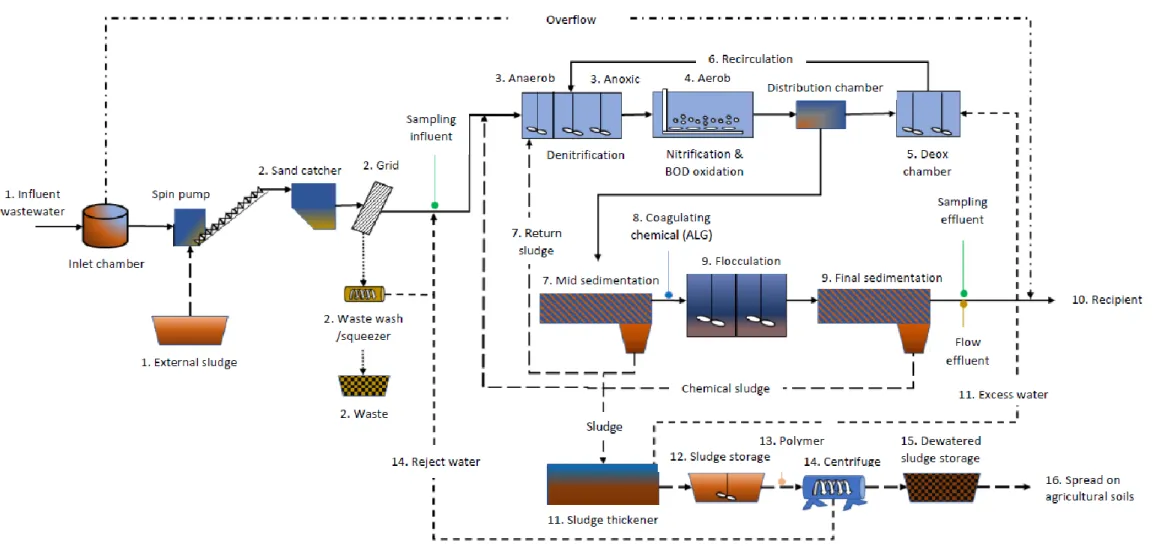
The treatment process goes through the following steps (figure 2): Wastewater treatment
1. Wastewater (WW) is transported to the plant by sewer lines or trucks.
2. Sand and solid waste is removed from the WW. The screenings that are removed are pressed to reduce water and then transported with the domestic waste to a waste incineration facility. Sand is supposed to be cleaned and returned to nature, but this process is lacking in Ekebyhov, releasing some sand to the following steps. The sand that is collected is sucked into a truck and transported to a landfill.
3. Pre-denitrification by Anaerobic/Anoxic treatment
4. Nitrification and oxidation of BOD by aeration (DO level around 2 mg/L) 5. Deox chamber to remove oxygen, enabling denitrification
6. Recirculation of nitrate rich water to be returned to the anoxic treatment for denitrification (197 % of influent water)
7. Mid sedimentation, most of the sludge is removed to the thickener (and some added to step 3 to preserve the bacteria)
8. Chemical coagulant (aluminium sulphate, ALG) is added to flocculate P
9. Final sedimentation, the rest of the sludge is removed to the thickener (and some added to step 3 to preserve the bacteria)
10. Clean water is released to the recipient Mälaren, some 450 meters from the shoreline. Heat from the clean water is reused to warm the facility, before being released.
Sludge treatment
5
12. Underground sludge storage holds the sludge before centrifugation. 13. Chemicals (Polymer, FLOPAM™ EM 440 HIB) is added.
14. Centrifugation of the sludge. Creates a semi-dry mass. Reject water is added to step 2. 15. Transportation of dewatered sludge by truck to over ground sludge storage. Stored for 6
months for hygenisation
16. Hygenised sludge is spread on agricultural soils to fertilize.
Samples are analysed on incoming and outgoing water (P, N, BOD, Metals) and manually on outgoing sludge (Metals and dry substance (DS)). The reduction rate of Tot-N at Ekebyhov is 80,1 % of influent N.
Photos 1-4 shows parts of the process at Ekebyhov, photographed by the author during a study visit to the WWTP.
Photo 1. Mechanic removal of solid waste at Ekebyhov. Photo 2. Aerobic treatment at Ekebyhov. This is where the oxygen demanding nitrification takes place.
Photo 3. Mid sedimentation at Ekebyhov.
6
7
3.2 Global Warming
Global warming is a phenomenon with great consequences for ecosystems, societies and economies (Steffen, et al., 2015; Steffen, et al., 2018). Since the influence of climate change affects the entire earth system, it has been identified as a top priority amongst the planetary boundaries that makes life on earth possible (Steffen, et al., 2015). Possible effects of climate change are e.g. rising sea levels, increasing frequency of extreme weather, loss of species, food and water shortages, spread of diseases etc. (IPCC, 2018; Steffen, et al., 2018; Al-Ghussain, 2019). Climate scientists have a 97-100% consensus that climate change is already happening, and that it is caused by GHG emissions (mainly CO2) from human
activities (Cook, et al., 2013; Powell, 2017; Oreskes, 2004). The level of CO2 in the atmosphere has
been increasing since the industrial revolution and is the result of overuse of fossil fuels as energy source (Al-Ghussain, 2019; Hawkins, et al., 2017). The pre-industrial CO2-level was approximately 227 parts
per million (ppm), but has since then increased and arose above 400 ppm in 2015 (Le Quéré, et al., 2015). The emissions of GHG:s have led to a global temperature rise of over 1°C above pre-industrial levels (Hawkins, et al., 2017; IPCC, 2018), and have already started affecting the human and ecological systems, e.g. through melting glaciers, droughts, flooding and heatwaves (Lwasa, et al., 2018; Steffen, et al., 2018).
To deal with the effects of global warming, a global agreement has been signed in which both mitigation and adaptation strategies are combined (UNFCCC, 2015). The mitigating strategies aim to prevent climate related risks by reducing GHG-emissions to keep the temperature rise well below 2°C above pre-industrial temperature. Complementary to the mitigation, adaptive strategies must be put into place to minimize the effects that are too late to prevent (IPCC, 2018).
Keeping the temperature well below 2°C requires global net emissions to stay within a specified carbon budget. The carbon budget has been defined as the cumulative amount of net CO2 emissions that can be
released while still limiting warming with a specific minimum probability to below a given temperature threshold (IPCC cited in Fuss et al., 2018).
The remaining carbon budget stated by IPCC (2018) was about 420 Gt CO2 for a 60 % chance of limiting
warming to 1.5°C, and about 580 Gt CO2 for an even chance. These figures have been highly debated,
and are suggested to rather be around 0-200 Gt CO2 (Minx, et al., 2018). The current net emissions rate
is around 40 Gt CO2/year, which (either way) leaves little time to reduce the emissions to net zero. The
goal of reaching net zero is heavily reliant on carbon dioxide removal (CDR) with negative emission techniques (NETs) (Minx, et al., 2018). However, estimations show that the total potential of various NETs to remove CO2 ranges from 4 to 24,6 Gt/year (Fuss, et al., 2018). This implies that even in the
best case (24,6 Gt/year), we still have to make ambitious GHG emissions reductions to meet the goal by 2050.
Although global warming is in its essence a global environmental problem, the impacts of climate change will, most likely, fall disproportionately on developing countries and poor people (Sachs, 2008; Sealey-Huggins, 2017). At the same time, people in poor countries have way smaller carbon footprints than wealthier counties, with the latest data from 2014 showing 0,3 and 10,9 tons CO2 per capita
respectively (World Bank, 2014). Global warming is therefore a question of justice, and it becomes even more important that we in the wealthy part of the world do everything in our power to reduce our footprint.
3.2.1 Greenhouse gases, GWP and CO2eq
Greenhouse gases (GHG) are substances that, when emitted to the atmosphere, affect the global climate by reflecting heat back to Earth’s surface (NASA, 2020). IPCC has classified GHGs with significant global warming potential (GWP) to be carbon dioxide CO2, methane CH4, nitrous oxide N2O,
chlorofluorocarbons and water vapor amongst others (Barber, 2009; Al-Ghussain, 2019).
The gases have different GWP, and to make them comparable to one another, they have been put in relation to the GHG most commonly emitted by humans, CO2, and converted to CO2 equivalents
8
(CO2eq) (IPCC, 2018; Barber, 2009). CO2eq is an internationally accepted measurement, which explains
the amount of CO2 that would result in the same radiative forcing as the gas in question (Table 1)
(Barber, 2009). CO2 stays in the atmosphere for 100 years, which is why most of the CO2eq are also
based on their impact over 100 years in the atmosphere, and expressed as GWP100 (Klöpffer & Grahl,
2014). One unit of N2O or CH4 has the GWP100 of 298 or 34 units of CO2, respectively (Table 1) (Myhre,
et al., 2013).
Table 2. CO2eq for GHGs in this study, in relation to different time periods (Myhre, et al., 2013)
GAS DURABILITY IN THE ATMOSPHERE (YEARS) GWP20 YEARS (CO2EQ) GWP100 YEARS (CO2EQ) CO2 100 1 1 CH4 12 86 34 N2O 144 268 298
9
4. Method
4.1 Literature review
To provide an understanding of the research field, methods and technologies, previous research regarding wastewater treatment and GHG-emissions was broadly reviewed by using the website Web of science. Keywords used during the search were: “Water”, “Sewage”, “GHG-emissions”, “Sludge”, “LCA” and to keep the review up to date, the publication period was set to 2008-2020
The resulting articles were briefly examined, looking at titles and abstracts and included if considered relevant to the thesis. Relevant cited papers in the collected articles were also included.
Previous research was also used to identify measures for reducing the carbon footprint.
To provide a background to WWT in Sweden, reports on wastewater treatment were collected from the websites Svenskt Vatten (Svenskt Vatten, 2019) and Swedish EPA (Swedish EPA, 2020b), and reports on the most recent knowledge about climate change were collected from IPCC (IPCC, 2020)
4.2 Study visit
In the beginning of the work with the thesis, a visit to the WWTP Ekebyhov was made. It provided a good background understanding of the treatment processes, logistics, chemical use, energy demanding processes and the internal routines for measurements and documentation. It has also established a connection with the staff, making it easier to receive further information.
Additional visits were planned, e.g. to the sludge storage, but were not possible to realize because of the corona pandemic. This made the initial contact with staff even more important, enabling digital communication.
4.3 Life cycle assessment
This study is based on a life cycle approach, but is more simplified than a complete life cycle assessment (LCA). While LCA considers several aspects, I will in this study only focus on global warming potential, which, according to ISO standard, makes it an incomplete LCA since it does not take other environmental aspects into account. The LCA framework, however, is still suitable for the case study. LCA is a tool that enables a quantified analysis of the environmental impacts of the entire production and use of a product or process (Klöpffer & Grahl, 2014; Corominas, et al., 2013). It has been defined in the ISO 14040 standard as:
“LCA studies the environmental aspects and potential impacts throughout a product’s life (i.e. cradle-to-grave) from raw material acquisition through production, use and disposal. The general categories of environmental impacts needing consideration include resource use, human health, and ecological consequences.” (Klöpffer & Grahl, 2014)
LCA does not include economic or social impacts, but focus on environmental aspects only (Klöpffer & Grahl, 2014). When using LCA as a tool to make decisions it is important to not forget about the other aspects of sustainability. The strength of an LCA lies in visualizing and describing the environmental impacts, enabling decisionmakers to make environmentally sound changes in the product line, without laying the environmental burden somewhere else in the lifecycle (Klöpffer & Grahl, 2014; Zang, et al., 2015). Transparency is central to all LCA. It should be possible for anyone else to follow the data sources and make the same analysis. Without transparency it is difficult to make comparisons and draw conclusions from the LCA (Klöpffer & Grahl, 2014; Corominas, et al., 2013).
10
LCA has become a popular tool to investigate and evaluate the performance and techniques for WWT (Abusoglu, et al., 2017; Alyaseri & Zhou, 2017; Amann, et al., 2018; Chen, et al., 2019; Corominas, et al., 2013; Gallego-Schmid & Tarpani, 2019; Hao, et al., 2019; Lorenzo-Toja, et al., 2016; Niero, et al., 2014; Polruang, et al., 2018). Using LCA enables evaluation of eventual trade-offs, e.g. improved nutrient removal vs. increased chemical and energy use, or reduced GHG emissions vs. increased energy use (Yoshida, et al., 2014). However, it can also show synergies, e.g. improved nutrient removal leads to reduced GHG emissions.
A LCA can analyse the environmental impacts from two main perspectives: midpoint and endpoint (Alyaseri & Zhou, 2017; Lorenzo-Toja, et al., 2015; Zang, et al., 2015). A midpoint perspective analyses the more immediate impacts from the lifecycle and can describe e.g. global warming or eutrophication. The endpoint perspective goes further and calculates the final damages to ecosystems, e.g. looking at changes in biodiversity or climatic systems (Alyaseri & Zhou, 2017; Klöpffer & Grahl, 2014). This study has adopted a midpoint perspective, due to limitations in time and resources.
Key factors and terminologies for a LCA are to specify impact categories and functional unit, select and define system boundaries and have a transparent system inventory (Corominas, et al., 2013; Heimersson, et al., 2016; Klöpffer & Grahl, 2014; Zang, et al., 2015). This will be further elaborated upon in the following sub-sections.
4.3.1 Impact categories
Impact categories specify which environmental aspects will be investigated. It can be toxicity, eutrophication, global warming etc. (Klöpffer & Grahl, 2014; Zang, et al., 2015). A complete LCA should include all impact categories affected by the process, or otherwise motivated why they were excluded. Analysing several impact categories provide a better and more thorough understanding of the environmental impacts of a process or product, or changes of the same (Klöpffer & Grahl, 2014). Impact categories relevant to WWT are: eutrophication potential, global warming potential, toxicity related impact categories, acidification potential, photochemical oxidation potential, ozone layer depletion, energy use, water use and land use (Zang, et al., 2015). However, due to limitations in time and resources, this study will only investigate global warming potential by the measurement of CO2eq.
A study that only investigates GWP does not qualify as a complete LCA according to the ISO standard, and can also be named “carbon footprint (CF) study” (Klöpffer & Grahl, 2014).
4.3.2 Functional unit
The selection of the functional unit (FU) determines the comparability of the LCA (Klöpffer & Grahl, 2014). Functional units relevant to WWT can be e.g. WW volume, amount of nutrients removed, nutrient content on influent WW, population equivalents (pe) or people connected to the WWTP (Corominas, et al., 2013; Tumlin, et al., 2014). A volume unit does not consider the quality of the WW or the nutrient content, a nutrient based unit does not account for the capacity of the WTTP and a population-based unit does not take external organic waste into account (Tumlin, et al., 2014). All of these factors may differ between WWTPs, which poses a problem. For instance, comparing two systems with different influent loads or with different removal efficiencies might result in misleading conclusions if using volume unit only as the functional unit. This shows the importance of selecting a representative FU, but also that there are pros and cons with all FUs (Corominas, et al., 2013; Tumlin, et al., 2014).
The most frequent used FU in LCA investigating WWTPs is a volume unit of treated WW, e.g. m3 or
ML (Corominas, et al., 2013). This thesis will present the results with several FUs, which will increase the comparability with other studies. The tool used for the study (presented below in section 4.4) will calculate the total annual emissions of CO2eq, as well as CO2eq per pe, m3 influent, influent N, P and
11
4.3.3 System description and boundaries
The system boundaries provide a description of the system, explains what have been included and excluded in the analysis and determines the extent of the analysis (Klöpffer & Grahl, 2014). Clearly defined system boundaries are imperative, because two studies on the same system can have completely different results due to different extents of the boundaries (Klöpffer & Grahl, 2014; Yoshida, et al., 2014). A study with extended system boundaries that include all environmental impacts becomes a powerful tool for decision making (Zang, et al., 2015).
The system boundaries for WWT usually contain upstream processes, core processes and downstream processes, to various extents (Corominas, et al., 2013; Zang, et al., 2015). Upstream processes are e.g. collection and transport of WW to the plant. Core processes include construction, use and deconstruction of the plant, although few studies include the construction and deconstruction of the plant in the LCA (Corominas, et al., 2013; Tumlin, et al., 2014). The usage of the plant consists of water treatment process, energy and chemical input, sludge treatment, maintenance etc. (Zang, et al., 2015). Downstream processes are energy recovery, final disposal and sometimes fertilizer substitution (Corominas, et al., 2013; Zang, et al., 2015).
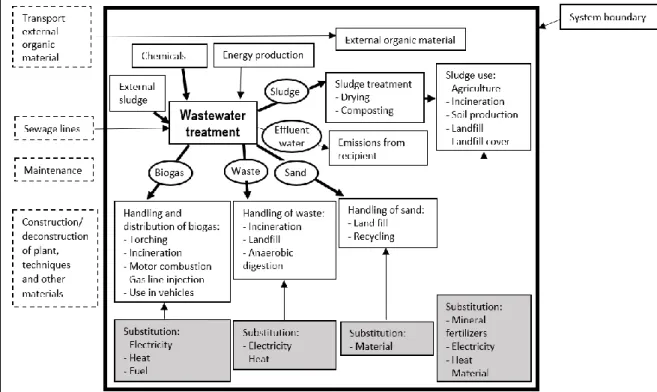
Figure 3. System boundaries for the analysis. Bold arrows indicate transport is included. Dashed lines indicate the processes are excluded from the analysis. Grey boxes represent substituted processes.
This thesis uses the boundaries set by the creators of the calculation tool (presented below in Section 4.4), but is extended in the upstream part to also include transport of WW to the plant. The boundaries of the system start with the collection of WWs from private tanks, through the water and sludge treatment processes and ends with the final use of the sludge, as shown in Figure 3. The boundaries include manufacturing and transport of chemicals, energy use, transports of sludge, sand and waste, impacts on the recipient and substitution of energy and mineral fertilizers. The boundaries do not include maintenance, sewer lines, transport of external organic material or the construction and deconstruction of materials, techniques or facilities.
4.3.4 System inventory
The system inventory makes it clear which material and energy inputs, outputs and various processes affect the defined system. It is a refined version of the system description and can contain transports,
12
manufacturing of techniques, waste generation etc. (Klöpffer & Grahl, 2014). The WWT system give rise to both direct (N2O and CH4 from water- and sludge treatment) and indirect (transport,
manufacturing of chemicals etc.) GHG emissions. In accordance with guidelines from IPCC, it is assumed that 100 % of the CO2 emitted directly from WW or SS is of biogenic origin and is therefore
not included in the calculations (Tumlin, et al., 2014).
4.4 Calculation tool
The tool used for this study is an excel calculation tool (ECT), created with Swedish WWTPs in mind but grounded in international scientific knowledge (Baresel, et al., 2016; Tumlin, et al., 2014). It is based on the LCA framework and calculates the GHG emissions from the entire WWT process, including up- and downstream processes and both direct and indirect emissions. It consists of the excel document with accompanying manual and report (Tumlin, et al., 2014).
To enable calculations where plant-specific data is difficult to obtain, the ECT provides data from relevant literature and databases. It is possible to adjust the tool and use individual data, to adapt it to local circumstances (Tumlin, et al., 2014; Baresel, et al., 2016). Since CH4 and N2O are the dominant
GHGs in WWT, conversion factors have been used to transform the emissions to CO2eq. The conversion
factors are 34 for CH4 and 298 for N2O, in accordance with guidelines from IPCC. Biogenic CO2
emissions are not included (Tumlin, et al., 2014).
The ECT have been used by other researchers to calculate the carbon footprint of WWTPs (Adriansson & Turesson, 2016; Baresel, et al., 2016) with satisfying results. This study uses the ECT similar to previous authors.
First a base scenario will describe the current situation, including which parts of the WWT process that are the main emitters of GHG. After that, the GHG emissions-reducing measures identified from previous research will be tested with the ECT by altering the data. This will create several future pathways towards reduced emissions and visualise the most effective measures. The measures that will be analysed are:
- MBR and optimized processes - Urea treated sludge
- Change of chemicals - Optimized transports
- Anaerobic digestion of the SS 4.4.1 Assumptions
The calculations made by the ECT are based on a number of basic assumptions (Tumlin, et al., 2014), listed below.
The treatment used at Ekebyhov is a conventional activated sludge process, in which the aerobic and anaerobic/anoxic conditions generate the GHG emissions. The ECT assumes that the activated sludge process emits 0,0157 kg N2O for every kg removed N, and 0,0025 kg CH4 per kg influent COD.
The calculation for sludge storage assumes that the stored sludge emits 1,1 % of N-tot in sludge as N2O
over one year, and 0,0007 m3 CH
4/ton VS every hour.
For the calculation of the transports’ footprint, it is assumed that the transports are 40 tons-trucks which are fuelled by diesel. An emission factor of 8,5 kg CO2eq/10 km is assumed.
The ECT assumes that 20 % of the screenings are of plastic material of fossil origin. Therefore, parts of the CO2 emissions from the incineration are not considered biogenic, but are included in the result.
The calculated emissions from the recipient are based on the amount of nitrogen that remains in the effluent water, and assumes a lower emission factor for freshwater than seawater, 0,0005 kg N2O/kg N.
13
The footprint for the sludge use is based on a number of assumptions and modelled values, e.g. the ECT assumes that the soil emits a negligible amount of CH4, that 1% of available N is emitted as direct N2O
emissions and 0,0157 kg N2O is emitted per kg emitted NH3 as indirect emissions, and that 10 % of the
C will be stored in the soil for at least 100 years.
4.5 Data collection
Klöpffer & Grahl (2014) stated that
“It is rarely ever possible to procure all data as primary data, that means to gather specific data at specific plants for specific processes. Therefore, a real LCI always consists of primary data, generic data and, where the one or other is not available, of estimations.” (Klöpffer & Grahl, 2014)
This thesis has used primary data as far as possible, and otherwise relied on standard data from literature or provided by the ECT.
The majority of the data have been collected from internal reporting systems at the WWTP. One extra analysis on SS has been made to receive the C-content. Data have also been provided by entrepreneurs via phone or e-mail. Below is a summary of the data used in the ECT. As previously stated, transparency is essential in any part of a system analysis, especially the collection of data (Klöpffer & Grahl, 2014). Therefore, a full dataset including sources can be found in Appendix 1.
Wastewater treatment
Data on nutrients and organic content on influent (COD 913 tons/year, BOD7 347 tons/year, N 137
tons/year and P 12 tons/year) and effluent (COD 131,7 tons/year, BOD7 5,9 tons/year, N 26,1 tons/year
and P 0,4 tons/year) water are measured on routine at the WWTP. Data for 2019 have been provided from environmental reports for the WWTP (Roslagsvatten, 2020a).
No measurements have been made on the direct emissions of N2O and CH4 from the WWT. Instead the
standard values and calculations from the ECT have been used (Tumlin, et al., 2014). Chemicals
The chemicals used at the plant are a coagulant (aluminium sulphate 222,9 tons/year) (Kemira, 2020a) for flocculating P, and polymer (8,4 tons/year) (SNF Nordic, 2020) for the drying of the sludge. The carbon footprint for aluminium sulphate (293 kg CO2eq/ton) was provided by the vendor (Kemira,
2020b) and the footprint for the polymer (805 CO2eq/ton) was provided by the ECT (Tumlin, et al.,
2014). Energy
Electricity (1871,8 MWh/year 2019) is provided by Energi Sverige and is 100 % renewable (Roslagsvatten, 2020a; Energi Sverige, 2020) and therefore generate no GHG emissions.
The plant does not generate any electricity, but reuses the heat from the water to generate enough heat to cover the needs of the plant (Khadhouri, 2020). There are no measurements of how much heat is generated and used over the year.
The plant has no anaerobic digestion of the sludge, and therefore no energy is conserved from the sludge treatment (Khadhouri, 2020).
Transports
Emissions from transports of chemicals, WW, SS and waste are accounted for in the analysis. The distances were calculated using google maps (Google, 2020) and the number of transports were provided by the entrepreneurs (Kemira, 2020a; SNF Nordic, 2020; Ragn Sells, 2020). For transportation of external sludge, it was estimated that the average tour was 10 km, and that each truck carried 10 m3.
14 Sludge and waste treatment
Data on the amount of produced dried sludge (2442 tons 2019) and the contents of nutrients and heavy metals (68,33 kg N/ton TS, 24,83 kg P/ton TS, 3,78 kg K/ton TS) in dried sludge are measured on routine at the WWTP. Data for 2019 have been provided from environmental reports (Roslagsvatten, 2020a). An extra analysis was ordered to establish the carbon content (369 kg C/ton TS) (Eurofins, 2020). No measurements have been made on the direct emissions of N2O and CH4 from the sludge. Instead the
standard values and calculations from the ECT have been used (Tumlin, et al., 2014).
The amount of generated screenings and sand is not measured at Ekebyhov, so for the purposes of this analysis the measurements from a sister plant have been used and adjusted to the number of people connected to Ekebyhov (22,6 and 2,2 tons respectively) (Roslagsvatten, 2020b).
Data for proposed measures
15
5. Results and discussion
This chapter contains the carbon footprint of Ekebyhov, a sensitivity analysis of the data and
suggested measures to mitigate GHG emissions. A full account of the GHG emissions by source and measure can be found in Appendix 2.
5.1 Baseline
The carbon footprint from the WW and SS treatment at Ekebyhov´s WWTP, based on the data from 2019 and emissions factors from the ECT, was calculated to be 522 tons CO2eq per year (Table 3).
522 tons CO2eq may seem large compared to 338 tons from Ängstorp (Adriansson & Turesson, 2016),
or small compared to e.g. 8719 tons from Himmerfjärdsverket (Baresel, et al., 2016) or 3730 from Västra stranden (Adriansson & Turesson, 2016), but this functional unit does not account for the different capacities of the plants. For the purpose of comparison between plants, the FU kg CO2eq per pe and
year is more suitable. Ängstorp has a carbon footprint of 32,2 kg CO2eq per pe, Västra stranden 36,9 kg CO2eq per pe and Himmerfjärdsverket 37,4 kg CO2eq per pe (Adriansson & Turesson, 2016; Baresel,
et al., 2016). Ekebyhov falls just above these three with 38,5 kg CO2eq per pe (Table 3), but below the
average of 46 kg CO2eq per pe identified in Gustavsson and Tumlin (2013) based on 16 Scandinavian
WWTPs (Gustavsson & Tumlin, 2013).
Figure 4 shows the fractions of the emissions by percent of total emissions, and Figure 5 shows the positive and negative CO2eq emissions by source of emission.
Table 3. The carbon footprint from Ekebyhov’s WWTP with different functional units
TOTAL CO2EQ PER YEAR 522 TON
CO2eq per pe (70 g BOD7 per day) 38,5 kg
CO2eq per m3 treated wastewater 0,3 kg
CO2eq per removed N-tot 4,7 ton
CO2eq per removed P-tot 44 ton
CO2eq per removed COD-tot 0,7 ton
CO2eq per influent N-tot 3,8 ton
CO2eq per influent COD-tot 0,6 ton
CO2eq per influent P-tot 42,8 ton
16 Wastewater treatment
The major part (83 %, 432 tons CO2eq) of the GHG emissions are direct emissions originating from the
activated sludge process (ASP) (Figure 4), out of which 356 tons CO2eq comes from N2O emissions,
and 77 tons CO2eq from CH4 emissions. This result agrees with a substantial body of literature that
attributes the major source of direct GHG to the WWT process (Gustavsson & Tumlin, 2013; Mannina, et al., 2020; Baresel, et al., 2016; Adriansson & Turesson, 2016; Jönsson, et al., 2015; Vasilaki, et al., 2019; Parravicini, et al., 2016). Tumlin et al. (2014), however, found the electricity to be a greater GHG source at 3 out of 4 plants due to the choice of electricity source (see section about electricity below), but WWT followed closely behind and was the greatest source at the fourth plant.
N2O is created when the dissolved oxygen level in the aeration tank is too low and inhibits complete
denitrification or when the nitrification is incomplete due to high levels of DO or nitrite (Carlsson & Hallin, 2003). Although there seems to be high agreement that WWT give rise to the majority of GHGs at WWTPs, Arnell (2013) and Vasilaki et al. (2019) show that the measured levels of N2O can vary
greatly between plants and even over time within the same plant. Model values for N2O emissions are
therefore inappropriate to use and it is advised to make local measurements over time to enable identification of proper measures (Arnell, 2013; Vasilaki, et al., 2019).
Sludge storage
During storage the sewage sludge emits direct GHG emissions of 80 tons CO2eq through both CH4 and
N2O emissions (0,8 and 0,2 tons, respectively, which corresponds to 52 and 28 tons CO2eq,
respectively). This represent 15 % of total GHG emissions, and is the second largest source of GHG emissions at Ekebyhov. The sludge has to be stored for six months to become properly hygenised and available for agricultural use. Storage of sludge provide a more or less anaerobic environment, which favours production of both CH4 and N2O.
The results agree with Baresel et al. (2016), who also appointed sludge storage the second largest GHG source at Himmerfjärdsverket (not counting the use of methanol, which leaves a substantial footprint at Himmerfjärdsverket but is not used at Ekebyhov). Parravicini et al. (2016), also found sludge storage to be the second largest GHG source. Adriansson and Turesson (2016), however, does not include the storage time in their calculations, because the plants use other ways to hygenise the sludge. Possible hygenisation techniques are pasteurisation, thermophilic anaerobic digestion or hydro thermal
17
techniques. These are however, expensive and may yet leave some storage time of the end product awaiting transportation or agricultural spreading (Adriansson & Turesson, 2016; Swedish EPA, 2013). The calculations are based on data on emissions from digested sludge, since that is the standard in Sweden and therefore best available data. It is unclear if undigested sludge, as in the case of Ekebyhov, emits more or less CH4 than digested sludge. The measurements made by Parravicini et al. (2016) shows
that undigested sludge emits more CH4 during storage than digested sludge. Contradicting results were
received by Willén (2016) when comparing GHG emissions from digested and undigested cattle slurry. Therefore, it is essential to make local measurements to make better decisions. It is, however clear that sludge storage is a meaningful source of CH4.
Chemicals
The production of the chemicals Aluminium sulphate (ALG) and Polymer (FLOPAM™ EM 440 HIB) provide a carbon footprint of 65 and 7 tons CO2eq per year, respectively. This represents 14 % of total
GHG emissions, and is the third largest source of GHG emissions at Ekebyhov. The emissions are indirect since they arise from upstream processes. Baresel et al. (2016), Adriansson and Turesson (2016) and Tumlin et al. (2014) uses more chemicals, and especially an external carbon source which provide a substantial carbon footprint. Since Ekebyhov has no pre-sedimentation tank, the COD from the influent is enough for the denitrification, and therefore the footprint of an external carbon source is saved. Jones et al. (2016) also find that aluminium sulphate provides a large carbon footprint and states that a switch from aluminium sulphate to ferric sulphate is a viable option for reducing the carbon footprint (Jones, et al., 2016) (see measure 3).
Transports
5 % of Ekebyhov’s GHG emissions arise from indirect emissions from transports. The transports included in this analysis are chemicals, external sludge, sludge to storage, sludge to farmland, screenings and sand (Figure 6). The transports amount to a total of 27,41 tons CO2eq per year, of which the majority
is attributed to the transport of external sludge and chemicals to the WWTP (16,09 and 6,46 tons respectively), followed by sludge to farmland (4,62 tons). The transport of sludge to storage is relatively small, but could be reduced further had they not had to move the stored sludge to another facility because of lack of space.
Similar to Baresel et al. (2016), Adriansson and Turesson (2016), Tumlin et al. (2014) and Parravicini et al. (2016), is that the transport makes up a relatively small portion of the total GHG emissions, but Ekebyhov gives a slightly larger portion than the others. Unlike Baresel et al. (2016), Adriansson and Turesson (2016) and Tumlin et al. (2014), transport of external sludge was included in Ekebyhov’s footprint. It is appropriate since Ekebyhov accepts sludge both from smaller WWTPs and from private household tanks. The calculations on transport of external sludge is, however, based on estimations, which makes this result somewhat uncertain.
18 Screening, sand and recipient
The indirect emissions from the handling of screening and sand amount to 5 tons CO2eq per year or 1
% of the total GHG emissions. Out of the 5 tons almost all emissions come from the incineration of waste, and the landfilling of the sand generates 0,04 tons CO2eq. The heat generated from the
incineration is used for central heating and substitutes alternative heat sources, which leaves a small negative footprint of -0,002982 tons CO2eq.
The direct N2O emissions from the recipient of Ekebyhov are estimated to be equivalent to 4 tons CO2eq
per year or 1 % of the total GHG emissions.
These results are in line with the results of Baresel et al. (2016), Adriansson and Turesson (2016) and Tumlin et al. (2014), who all concluded that GHG emissions from sand, waste and recipient were the smallest part of the total GHG emissions, together with transports.
Electricity
Roslagsvatten has chosen to use 100 % renewable energy for the operation of Ekebyhov, which has resulted in zero emissions from energy use. Tumlin et al (2014), on the other hand, found electricity to be the largest source of GHG emissions in three out of four plants, depending on electricity use and local generation of electricity from biogas. The source of energy in Tumlin et al. (2014) was set as EU future mix, which emits 350 tons CO2eq/GWh, whereas Adriansson & Turesson (2016) chose Swedish mix
(10 tons CO2eq/GWh) and Baresel et al. (2016) used 100 % renewable energy.
The electricity demanding processes such as aeration and pumps show the importance of the decision to select renewable energy as source of electricity. This is also clearly demonstrated in figure 7 which shows the CO2eq that would be emitted, had Roslagsvatten chosen another source of electricity.
Figure 7. Ton CO2eq emissions from electricity use, based on source.
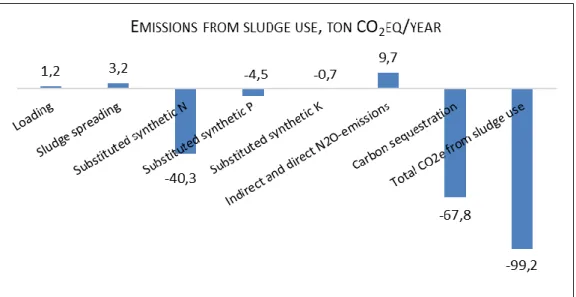
Sludge use
The footprint for Ekebyhov’s sludge use is negative by -99 tons CO2eq per year (Figure 8). The sludge
is used on agricultural soil, where the soil becomes a carbon sink and the nutrients (N, P and K) act as fertilizers. The sludge is therefore a substitute to synthetic fertilizers. The production of synthetic fertilizers leaves a carbon footprint (40,3 tons CO2eq for N, 4,5 tons CO2eq for P and 0,7 tons CO2eq
for K), which can be subtracted from the sludge use as a negative footprint. The carbon sequestration also leaves a negative footprint (-67,8 tons CO2eq per year). However, the N in the sludge is a source of
19
N2O and leaves a positive footprint (9,7 tons CO2eq per year), as does the CO2 emissions from the
loading and spreading of the sludge (1,2 and 3,2 tons CO2eq per year, respectively).
Other studies have also received negative emissions from the use of sludge on agricultural soils, but contrary to this study (which have 80 tons CO2eq emissions from storage, see above), the positive
emissions from the storage of sludge were larger than the negative emissions from the use of sludge (Baresel, et al., 2016; Tumlin, et al., 2014). Adriansson & Turesson (2016) did receive net negative emissions from sludge use from both Västra stranden and Ängstorp. However, they did not account for any GHG emissions from storage of the sludge.
5.2 Sensitivity analysis
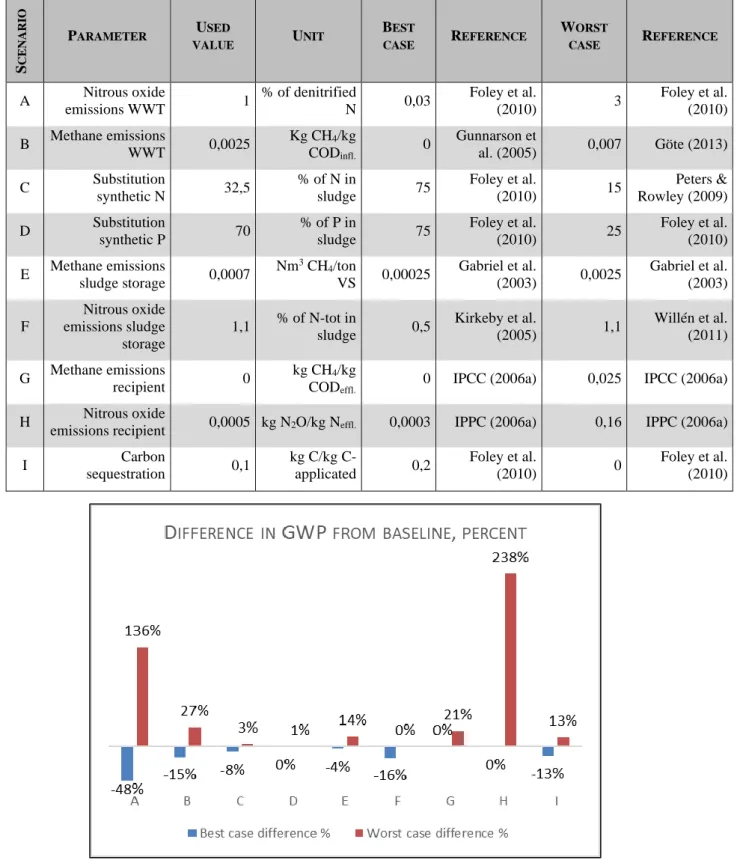
This study is based on a number of assumptions and emissions factors (EF), see section 4.4.1. To evaluate the impact and importance of the chosen EFs on the total carbon footprint (CF), a sensitivity analysis was made based on best- and worst-case scenarios from the literature (Table 4). The result can indicate which data are uncertain and which data require local measurements to draw clear conclusions (Tumlin, et al., 2014). See full results of the sensitivity analysis in Appendix 3.
The analysis shows that the main uncertainties are surrounding EFs on N2O emissions from the recipient
(H) and WWT (A) (Figure 9). The carbon footprint may be up to 48 % smaller or 136 % larger than the baseline result, if other EFs for N2O emissions from WWT are more suitable for the situation at
Ekebyhov (A). Yet, even in the best-case scenario, the N2O emissions from WWT represent the majority
of the emissions (107 out of 273 tons CO2eq per year). The EF for CH4 emissions from WWT (B) is
somewhat more stable, but there is still a 42 % difference between best- and worst-case scenarios. The N2O emissions from the recipient can result in a much larger CF (238 %) than calculated in the base
result, which shows there are great uncertainties surrounding N2O emissions from recipient (H), whereas
a change of EF for CH4 emissions from the recipient (G) gives a small increase to the total CF. The
change of EFs for level of substitution for N and P (C and D) and level of carbon sequestration (I) make little or no difference to the CF.
The EFs for CH4 and N2O emissions from storage of sludge (E and F) can impact the CF by 18 % and
16 %, respectively. However, even the EFs for the best- and worst-case scenarios are based on data for digested sludge whereas the sludge at Ekebyhov is undigested. It is unclear how this affects the GHG emissions from the sludge. Since there is a higher C-content (because of no extraction of biogas) an argument can be made that the CH4 emissions can be even higher than the results and sensitivity analysis
Figure 8. The positive and negative CO2eq emissions resulting from the sludge use at
20
show. The emissions can also be lower, due to the fact that no digestion process has started and there is a lower temperature in the sludge.
Given the result of the sensitivity analysis, local measurements on CH4 and N2O emissions from WWT
and sludge storage are highly motivated.
Table 4. Parameters with corresponding best- and worst-case data for sensitivity analysis.
Figure 9. The percentual deviation from the baseline carbon footprint for each parameter in the sensitivity analysis (Table 4.).
S C E N A R IO PARAMETER USED VALUE UNIT BEST CASE REFERENCE WORST CASE REFERENCE A Nitrous oxide emissions WWT 1 % of denitrified N 0,03 Foley et al. (2010) 3 Foley et al. (2010) B Methane emissions WWT 0,0025 Kg CH4/kg CODinfl. 0 Gunnarson et al. (2005) 0,007 Göte (2013) C Substitution synthetic N 32,5 % of N in sludge 75 Foley et al. (2010) 15 Peters & Rowley (2009) D Substitution synthetic P 70 % of P in sludge 75 Foley et al. (2010) 25 Foley et al. (2010) E Methane emissions sludge storage 0,0007 Nm3 CH 4/ton VS 0,00025 Gabriel et al. (2003) 0,0025 Gabriel et al. (2003) F Nitrous oxide emissions sludge storage 1,1 % of N-tot in sludge 0,5 Kirkeby et al. (2005) 1,1 Willén et al. (2011) G Methane emissions recipient 0 kg CH4/kg CODeffl.
0 IPCC (2006a) 0,025 IPCC (2006a)
H Nitrous oxide
emissions recipient 0,0005 kg N2O/kg Neffl. 0,0003 IPPC (2006a) 0,16 IPPC (2006a)
I Carbon sequestration 0,1 kg C/kg C-applicated 0,2 Foley et al. (2010) 0 Foley et al. (2010)
21
5.3 Possible future measures
The identified measures are presented below in a descending order, starting with the largest source of GHG emissions and ending with possible sinks. For every measure the potential GHG emission reduction (PGER) is calculated. The results below are presented with the functional unit ton CO2eq per
year, but a full presentation with the results of the measures with different functional units can be found in Appendix 4.
5.3.1 Measure 1, regarding wastewater treatment This section proposes an optimization of the WWT to reduce GHG emissions.
Since the ASP is the largest emitter in the process, it is essential to address this source. Arnell (2013) suggests that well working plants with minimum disturbances and low levels of N in the effluent water run a low risk for N2O emissions. This requires optimized processes. Vasilaki et al. (2019) made a review
of various measures taken to reduce N2O emissions, some of which are adopted below. Baresel et al.
(2016) used the assumption that the direct emissions from water treatment would be reduced by 30 % with the use of membrane technique (MBR) and optimized processes. This is supported by Kim et al. (2015) , who proposes that optimized processes such as dissolved oxygen levels and internal recycle rate may result in reduced GHG emissions by 38 % (Kim, et al., 2015).
Accounting for local variations, an assumption of 30 % reduction is adopted here. The proposed optimizations are:
• Introduce MBR (Baresel, et al., 2016)
• High levels of dissolved oxygen in aeration tanks (4-6 mg/l) (He, et al., 2017; Kim, et al., 2015)
• Optimal aeration intensity to minimize N2O stripping yet keep the DO level high (Vasilaki, et
al., 2019)
• Low levels of DO in the Anoxic zone (Arnell, 2013)
• High internal recycle rate (400-500%) (Kim, et al., 2015; Arnell, 2013)
• Avoid accumulation of NO2- (concentration below 0,3-0,5 mg NO2--N/l) (Vasilaki, et al.,
2019; Arnell, 2013)
• Prevent NH4+ concentration peaks with equalisation tanks (Vasilaki, et al., 2019; Arnell, 2013)
The optimized WWT results in a PGER of 173 tons CO2eq per year, and gives total emissions of 349
tons CO2eq per year (Figure 10).
This is in line with the results from Baresel et.al (2016), but somewhat contradicts comparative studies between membrane (MBR) and conventional activated sludge (CAS) techniques (Lazarova, et al., 2012; Mannina, et al., 2020). Lazarova, et al., (2012) have compared CAS and MBR, and concludes that the latter gives rise to increased GHG-emissions. Mannina, et al., (2020) arrives at the same conclusion, and attributes the increased emissions to the higher aeration required for MBR to reduce fouling. This results in increased direct CO2eq emissions by stripping of soluble N2O, as well as increased indirect emissions
due to the additional energy needed for the aeration. However, both the WWTP studied in Baresel et al. (2016) and Ekebyhov uses 100 % renewable energy, which would eliminate the indirect emissions arising from increased energy consumption. The contradicting results can be due to variations in the operation processes of the plants, or that Baresel et al. (2016) and Kim et al. (2015) may not have accounted for the increased stripping of soluble N2O which affects this study since the assumptions for
the calculation are based on their data. Baresel et al. (2016) was not transparent about what kind of process optimizations were made, which makes it difficult to analyse.
Parravicini et al. (2016) states that increased Tot N removal correlates with decreased N2O emissions
from the activated sludge. Between their two plants, one had a Tot N removal efficiency of 77 % and N2O EF of 0,75 % /Tot Ninfluent, whereas the other had a N2O EF of 0,05 % /Tot Ninfluent with a removal
22
efficiency of 92 % (Parravicini, et al., 2016). Ekebyhov’s removal efficiency was 80,9 % in 2019 (Roslagsvatten, 2020a), which means that there is room for improvement.
Figure 10. Positive and negative emissions by source, including the reduced emissions from the measures for WWT. The measures reduce the total emissions by 173 CO2eq per year.
The fact that there is no conflict, but rather synergies between nutrient removal and reduced N2O
emissions is positive for the integration of optimization measures. It is, however, important to keep in mind that emissions from WWT can vary greatly between and within WWTPs, from 0,0001 to 0,112 kg N2O-N/kg tot N (Arnell, 2013). These measures are therefore uncertain.
During my research I have not come across any WWTP that uses a closed WWT system with a N2O
destructor to reduce the carbon footprint. Considering the potentially huge impact emissions of N2O
have on global warming, this technique should be further investigated. 5.3.2 Measure 2, regarding sludge treatment
This section proposes urea treated and covered sludge to reduce GHG emissions.
As the second largest emission source, the sludge storage has to be addressed. The pathogen-reducing properties of the ammonia in urea also inhibits the activity of both nitrite- and ammonia-oxidizing bacteria, as well as the anaerobic microorganisms that create methane, and may therefore prevent the production of both N2O and CH4 from sewage sludge (Fidjeland, et al., 2013; Willén, et al., 2016a).
The data produced by Willén et al. (2016b) on sludge storage and Willén et al. (2016a) on sludge use on agricultural soils laid the base for the calculations of GHG-emissions from the urea treated sludge. The results provide a PGER of 68 tons CO2eq per year from the sludge storage, as well as PGER from
the agricultural application of 7 tons CO2eq per year. This gives a total carbon footprint of 447 tons
CO2eq per year (Figure 11).
The reduction of GHG emissions from storage is in line with recent studies that show that urea treated sludge can be beneficial as a means both to hygenise the sludge from harmful pathogens and reduce GHG emissions from the sludge storage (Jönsson, et al., 2015; Svanstrom, et al., 2017; Willén, et al., 2017; Willén, et al., 2016a; Fidjeland, et al., 2013; Willén, et al., 2016b). Willén et al. (2016b) performed measurements of GHGs from sludge treated with various treatments. They received a negligible N2O
23
treated with urea. Mesophilic digested sludge with no treatment, produced EFs of 0,34 % and 1,1 %, respectively (Willén, et al., 2016b).
Figure 11. Positive and negative emissions by source, including the reduced emissions from the urea treatment. The measure reduces the total emissions by totally 75 tons CO2eq per year from sludge
storage and sludge use (68 and 7 tons, respectively).
The reduction of emissions from agricultural application are based on, and correspond with measurements from Willén et al. (2016a). However, two LCAs conducted on various sludge treatments by Willén et al. (2017) and Svanstrom et al. (2017) show that urea treated sludge increases N2O
emissions when spread on agricultural soil, due to the increased concentration of ammonia. This contradicts the studies showing that the high levels of NH4+ or NH3 inhibits the activity of nitrifying and
denitrifying bacteria (Arnell, 2013; Willén, et al., 2016b). They also found that the production of urea is energy intensive and leaves a quite large footprint, which have not been included in the present study due to incomplete data. Still, the urea treated sludge in their analyses emitted only slightly more GHGs than the best option, since the reduction of emissions from sludge storage is of such magnitude. Besides reducing GHG emissions from sludge, the urea treatment also has the advantages of 1) being cost effective and suitable even for smaller WWTPs, and 2) hygenising the sludge at the same time, removing the need for long time storage (Fidjeland, et al., 2013; Svanstrom, et al., 2017).
Another, even less invasive approach would be to cover the storage. Willén et al. (2016b) show that the N2O EF from sludge stored under cover is 0,19 % of initial tot-N, which is somewhat higher than urea
treated sludge, but lower than untreated sludge. The CH4 EF, however, is greatly increased to 1,3 % of
initial tot C due to the anaerobic conditions when stored under cover. This could be solved by flaring the CH4 emissions, which would turn the methane into CO2 that both provide a 34 times smaller GWP
than CH4, and is considered biogenic. The methane could also be used for heating or destructed through
thermic or catalytic oxidation techniques (Avfall Sverige; Svenskt Vatten, 2019) 5.3.3 Measure 3, regarding chemicals
This section proposes a change of coagulation chemical to reduce the carbon footprint.
The production of the coagulant aluminium sulphate leaves a footprint of 65 tons CO2eq per year,
whereas the coagulant ferric sulphate is a by-product from other production and therefore leaves no footprint. A change to ferric sulphate would therefore create a PGER of 65 tons CO2eq per year and
24
Figure 12. Positive and negative emissions by source, including the reduced emissions from the change of chemicals. The measure reduces the total emissions by 65 tons CO2eq per year.
The same measure is also proposed by Jones et al. (2016) in a study about drinking water treatment. In the study three out of four sites uses aluminium sulphate as coagulant with a footprint of 145 kg CO2eq/ton, and the fourth uses ferric sulphate with the same good result but with a much lower footprint
(Jones et al., 2016). Tumlin et al. (2014) has identified a ferric sulphate that is produced as a by-product and therefore leaves no footprint.
5.3.4 Measure 4, regarding transports
This section proposes to change the transports from fossil to renewable fuel.
The transports to and from the WWTP do not leave a substantial footprint compared to the other sources. None the less, should all transport of chemicals, sludge and waste be made by renewable fuel (such as biodiesel or electricity), the fossil footprint from transports would be removed since the emissions would be considered biogenic. This would create a PGER of 27 tons CO2eq per year and leave a total carbon
footprint of 494 tons CO2eq per year (Figure 13).
A change to green transports was also suggested by Baresel et al (2016) to reduce the carbon footprint at Himmerfjärdsverket. They press the fact that infrastructure needs to be expanded. Some things have happened in this aspect since then, but there is still a lot of room for improvement. Since the largest part of transport emissions at Ekebyhov arises from the transport of external sludge to the plant, this part of the transport should be prioritised in a fuel change.
Besides changes in fuel source, the distribution of GHG emissions from transports to and from Ekebyhov motivates an extension of pipe lines to private households. The logistics of transports could also improve in several ways, e.g. make sure that the sludge only needs to move once.