L
INAA
LDÉN ANDM
ATSH
AMMARSTEDT 2014:2Discrimination in the credit
market?
Survey based evidence of access to financial
capital among self-employed immigrants
Discrimination in the credit market?
Survey based evidence of access to financial capital among
self-employed immigrants
by Lina Aldén
Centre for Labour Market and Discrimination Studies Linnaeus University
SE-351 95 Växjö Sweden lina.alden@lnu.se Mats Hammarstedt♠
Centre for Labour Market and Discrimination Studies Linnaeus University
SE-351 95 Växjö Sweden
mats.hammarstedt@lnu.se Abstract
We present results from a survey regarding access to financial capital conducted among immigrants who are self-employed in private firms in Sweden's retail, trade or service sectors. The results show that non-European immigrants consider access to financial capital as a more serious impediment to their self-employment activities than do native Swedes and European immigrants. Self-employed non-European immigrants report more discrimination by banks, suppliers and customers than do natives and immigrants from European countries. Immigrant-owned firms apply for bank loans to a larger extent than do firms Immigrant-owned by natives. Non-European immigrants are more likely than natives of having a loan denial and they are also charged higher interest rates on their bank loans than natives are. The occurrence of ethnic discrimination in the market for bank loans is put forward as an explanation for these results. Limited or no access to financial capital is an obstacle for self-employment among certain immigrant groups. This obstacle may be one explanation for the high exit rates from self-employment among immigrants that has been documented in several countries including Sweden.
JEL codes: G23, J23, J71
Keywords: self-employment, immigrants, financial capital, bank loan, discrimination
♠ The authors are grateful to a research grant from Jan Wallanders and Tom Hedelius Foundation. All
1. Introduction
Research on immigrant employment has increased in recent years and high self-employment rates among immigrants have been documented in several OECD countries.1 In addition to the relatively high rates of self-employment, the exit rates from self-employment have been found to be higher among immigrants than among natives in different countries around the world.2
It is well known from previous research that access to financial capital is of great importance in both the self-employment decision and in successful self-employment.3 Despite this, and despite the fact that the question of whether banks discriminate against certain ethnic groups that apply for loans has received public attention, few studies have focused on the extent to which self-employed individuals of different immigrant background apply for loans from banks and if loan applications from self-employed individuals of different ethnic backgrounds receive differential treatment from the banks. In the US, Cavalluzzo and Cavalluzzo (1998) found higher loan denial rates among ethnic minority applicants than among white applicants. Cavalluzzo et al. (1999) found lower loan application rates among Asian firms than among other ethnic groups. Furthermore, they also found higher loan denial rates among ethnic minority groups than among whites. Blanchflower et al. (2003) found that black-owned business were twice as likely to be denied credit than white-owned ones and black-owned firms were charged higher interest rates on their loans than were white-owned firms.4 Ethnic discrimination in the credit market has been documented also in more recent studies from the US by Blanchard et al. (2008) and Asiedu et al. (2012).
In light of the scarce knowledge of this issue, the aim of this paper is to explore differences in loan applications, loan denials, and interest rates charged between self-employed immigrants and self-employed natives in Sweden. Sweden is a suitable testing ground for a study on this topic for several reasons. Firstly, in 2014 the foreign-born population in Sweden constitutes about 15 per cent of the country's total population. Secondly, self-employment among
1 For studies from the US, see e.g. Borjas (1986), Yuengert (1995), Fairle & Meyer (1996), Fairlie (1999), Hout
& Rosen (2000) and Robb & Fairlie (2009). For a study from Australia, see Le (2000). For studies from European countries, see e.g. Clark & Drinkwater (2000) for the UK, Constant & Zimmermann (2006) for Germany, Hammarstedt (2001, 2004, 2006) for Sweden and Vinogradov (2007) for Norway.
2 For studies from the US, see Bates (1999), Lofstrom & Wang (2006) and Fairlie & Robb (2007). For studies
from Sweden, see Andersson-Joona (2010) and Andersson (2011).
3 See e.g. Blanchflower & Oswald (1998).
immigrants in Sweden has increased substantially in recent decades and today immigrants are over-represented in self-employment, especially within the retail, trade, and service sector.5
The study is conducted with the help of a unique survey combined with data from extensive public registers. In the survey a sample of immigrants, and a control group of natives, who were actively self-employed in private firms in the retail, trade or service sector in the year 2011 were questioned about the problems their firms have recently experienced, what problems their firms have today, and what problems they expect their firms to confront in the future. They were also asked whether or not they had applied for a bank loan since 2011 and if so, what the outcome had been, and if approved, what interest rates they were charged.6 The results from the survey were then combined with data from the LISA data base at Statistics Sweden. From this data base we have access to information about all of the respondents and their firms. We have information about respondents' income from different sources as well as information about the firm’s age, the firm’s results in previous years, number of employees, and net sales. With this information we construct measures of the respondents' and their firms' creditworthiness.
We find clear evidence that self-employed immigrants of a non-European background perceive more discrimination by customers, suppliers and banks than do self-employed natives and self-employed European immigrants. Furthermore, self-employed immigrants apply for bank loans more frequently than do self-employed natives. Self-employed non-Europeans have a higher risk than other self-employed natives of having their loan applications denied and if those loans are approved, they are charged higher interest rates than self-employed natives are. Since our results remain when we control for a large number of variables we argue that discrimination in the loan market explains, at least to some extent, our results.
The remainder of the paper is organised as follows: Section 2 presents the data and survey design. In Section 3 we present results regarding problems reported by the firms as well as ethnic differences in applications loan application rates, denial rates, and interest rates charged. Section 4 contains the econometric analysis. The conclusions and a discussion are found in Section 5.
5 See Andersson & Hammarstedt (2011). 6 An immigrant is defined a foreign-born person.
2. Data
We combine data from two sources. A survey was conducted in cooperation with Statistics Sweden from September to November 2013. The results from the survey were combined with data from the LISA data base at Statistics Sweden. In the survey, a sample of immigrants and natives who were actively self-employed in private firms in the retail, trade, and service sector in 2011 and were still active in September 2013 were asked about their self-employment activities and their firm’s access to financial capital. From the LISA data base we obtained information about owner and firm characteristics, such as educational attainment and capital income of the owner and result and net sales of the firm. From this information we were able to construct measures of creditworthiness for all firms that participated in the survey.
2.1 The survey design
The survey was conducted from September to November 2013. The survey sample comprised 7,915 individuals who were drawn from the total population of individuals in Sweden who were actively self-employed in private firms (as their main employment) in the retail, trade, and service sectors in both 2011 and 2013 using stratified random sampling. The total population of self-employed in private firms was stratified by country of birth, creating two strata: those born in Sweden and those born abroad (immigrants). In total, the survey sample comprised 6,445 self-employed immigrants and 1,470 self-employed natives.7 These individuals were asked to complete a survey in which they were asked questions about the problems their firms had experienced in the previous three years, what problems their firms are facing today and what problems they expect their firms expect to have in the future. They were also whether or not they had applied for a loan from a bank between 2011 and 2013, if the loan application had been approved or denied, and if approved, what interest rate they were charged.
The respondents were asked about past, present and expected problems with Access to
financial capital, Laws and regulations, Payroll taxes, Access to workers, Perceived discrimination by customers, Perceived discrimination by suppliers and Perceived
7 In order to draw conclusions for the total population of self-employed in private firms in the retail, trade and
discrimination by banks. The respondents were asked to rank to problems on a four-digit scale
with the alternatives Very serious problem, Serious problem, Small problem and No problem.
In terms of loan applications, the respondents were asked whether or not they have applied for a bank loan since 2011. If they answered had, they were asked about the amount that was requested and whether this loan application was approved or denied. If the loan was approved they were asked about the amount and the interest rate they were charged. If the respondents applied for more than one loan since 2011, they were asked to focus on the more recent loan application.8
The response rate of the survey was about 34 per cent among immigrants and 46 per cent among natives. This implies that 2,170 of the immigrants and 671 of the natives who were asked to complete the survey did.9 Among these respondents, 1,564 of the immigrants and 567 of the natives gave complete answers to the survey questions. By focusing on respondents who started a firm by 2010 at the latest, the number of immigrants was reduced to 1,434 and the number of natives to 534. Due to missing information on firm and owner characteristics collected from the LISA data base (see Section 2.2), the final sample used in our empirical analysis comprised 1,322 immigrants and 512 natives. In the empirical analysis the firms were divided by their owner’s country of birth. In total, 512 firms were owned by natives, 663 were owned by immigrants born in European countries, and 659 were owned by immigrants from non-European countries. Among these firms, 75 of the firms owned by natives had applied for a bank loan since 2011 while 143 of the firms owned by European immigrants and 171 of the firms owned by non-European immigrants had applied for a bank loan. The firm owners in the total sample are between 18 and 74 years of age. The mean age of natives and European immigrants is 52 and 47 among non-European immigrants.10
2.2 The LISA data base
The LISA data base at Statistics Sweden contains information demographic and labour market variables for the total population living in Sweden. From this data base we have information
8 See Appendix A for a presentation of the survey questions.
9 A comparison of respondents and non-respondents of the survey by sex, age, civil status, education, earnings,
citizenship, and year of immigration reveals small differences among both native and among immigrant self-employed. The non-response bias analysis is available from the authors upon request.
10 See Tables B2 and B3 in Appendix B for an overview of the distribution of the firms over business lines
about gender, age, education, area of residence, civil status and number of children in the household for all respondents. Furthermore, the data base includes variables about different sources of income. We also have information about characteristics of the self-employed individuals’ firms. We have information about the firm’s results in previous years, number of employees and net sales. With this information we are able to construct measures of the respondents and their firms' creditworthiness.11
3. Problems reported, loan applications, denials rates and interest rates charged
Problems reported by the firms are presented in Table 1. The table shows the proportion of respondents who describe a specific problem as either serious or very serious in the survey. More than 35 per cent of the firms owned by non-European immigrants reported that access to financial capital is a serious or a very serious problem. This could be compared with approximately 20 per cent for firms owned by natives and about 25 per cent for firms owned by immigrants from European countries.
Firms owned by non-European immigrants reported having problems with laws and regulations, payroll taxes and access to workers to a larger extent than firms owned by European immigrants and firms owned by natives. More than 40 per cent of the firm’s owned by non-European immigrants considered payroll taxes as a problem both in the past, in the present, and expect them to remain so. The corresponding figure for firms owned by natives was somewhat higher than 20 per cent.
Table 1: Problems experienced by the total sample of firms
All Sweden Europe Non-European countries
Problems facing the firm today
Access to financial capital 0.29 0.20 0.28 0.36 Laws and regulations 0.29 0.28 0.26 0.32 Payroll taxes 0.33 0.23 0.31 0.44 Access to workers 0.18 0.11 0.18 0.24 Perceived discrimination by customers 0.07 0.02 0.06 0.13 Perceived discrimination by suppliers 0.05 0.04 0.04 0.08 Perceived discrimination by banks 0.16 0.10 0.14 0.21
Problems faced by the firm in the last year
Access to financial capital 0.28 0.20 0.25 0.36 Laws and regulations 0.27 0.25 0.23 0.32 Payroll taxes 0.31 0.21 0.29 0.41 Access to workers 0.17 0.10 0.16 0.22 Perceived discrimination by customers 0.07 0.02 0.05 0.12 Perceived discrimination by suppliers 0.05 0.03 0.04 0.08 Perceived discrimination by banks 0.14 0.10 0.13 0.20
Problems the firm expect to face in the next year
Access to financial capital 0.27 0.18 0.25 0.37 Laws and regulations 0.26 0.23 0.22 0.33 Payroll taxes 0.31 0.21 0.29 0.42 Access to workers 0.17 0.10 0.17 0.21 Perceived discrimination by customers 0.06 0.02 0.05 0.12 Perceived discrimination by suppliers 0.06 0.03 0.04 0.09 Perceived discrimination by banks 0.14 0.10 0.12 0.20 Number of observations 1,834 512 663 659 Note: The table shows the proportions of firms that report that a specific problem is a serious or a very serious problem.
Table 1 also reveals a large difference between non-European immigrants and natives as regards the share that perceived discrimination from customers, suppliers, and banks. More than 10 per cent of the firms owned by non-Europeans reports perceived discrimination from customers; only 2 per cent of the firms owned by natives perceived such discrimination. In terms of perceived discrimination by banks, about 20 per cent of the firms owned by non-European immigrants perceived such discrimination while 10 per cent of the firms owned by natives did.
Table 2 presents information about the firms that have applied for a loan since 2011. By 2011, firms owned by non-European immigrants had, on average, somewhat higher net sales than firms owned by natives and firms owned by immigrants from European countries. Furthermore, firms owned by self-employed natives were on average 15 years old; firms owned by immigrants on average were somewhat less than 10 years old.
Table 2: Descriptive statistics of firms who applied for a loan
All Sweden Europe Non-European countries Number of employees 0.82 0.69 0.77 0.92 Net sales (SEK*) 1,410,600 1,312,500 1,266,900 1,573,700 Result (SEK*) 241,900 241,000 237,400 245,900 Firm age (years) 9.91 14.56 9.59 8.13 Number of observations 389 75 143 171 Note: The data on firm age is collected from the survey. Data on number of employees, net sales, and result are collected from the LISA-database for the year 2011.
*) In January 2014, 1 Euro corresponds to about SEK 8.90.
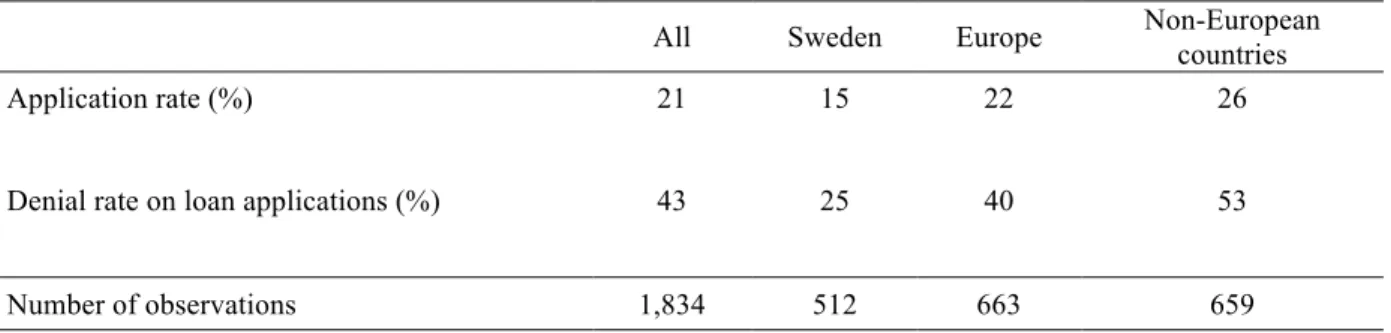
Table 3 reports loan application and denial rates since 2011 among the respondents. The share of firms who applied for a loan is highest among firms owned by non-European immigrants. In 2013, 26 per cent of the firms owned by immigrants from non-European countries reported that they had applied for a loan from a bank since 2011. The corresponding share among firms owned by European immigrants was 22 per cent while 15 per cent of the firms owned by natives reported that they applied for a loan from a bank since 2011.
Table 3: Application and denial rates by region of origin
All Sweden Europe Non-European countries Application rate (%) 21 15 22 26 Denial rate on loan applications (%) 43 25 40 53 Number of observations 1,834 512 663 659
In terms of loan denials, 53 per cent of the firms owned by non-European immigrants had a loan application denied since 2011. Among firms owned by natives, the comparable figure was 25 per cent; 40 per cent of the loan applications from firms owned by European immigrants were rejected.
Table 4 presents bank loan characteristics of the firms that applied for a loan. It emerges that firms owned by non-European immigrants, on average, apply for smaller loans than do firms owned by natives and by European immigrants. Furthermore, the interest rate charged by the banks is an average of about 0.5 percentage points higher for firms owned by European immigrants and 1.5 percentage points higher for firms owned by non-European immigrants than the interest rates charged by banks for loans to native-owned firms.
Table 4: Loan characteristics of firms who applied for a loan
Requested loan amount of all loan applications (SEK*)
Requested loan amount for approved loans
(SEK*)
Approved loan amount (SEK*)
Interest rate charged on approved loans (%) All Average 295,000 308,000 295,500 5.97 Min 5,000 6,000 6,000 2.00 Max 3,500,000 3,400,000 3,000,000 19.50 Sweden Average 345,100 332,600 330,800 5.23 Min 5,000 10,000 10,000 2.50 Max 2,400,000 2,400,000 2,400,000 9.40 Europe Average 285,900 356,600 339,200 5.79 Min 6,000 6,000 6,000 2.50 Max 3,400,000 3,400,000 3,000,000 13.40 Non-European countries Average 280,700 239,400 224,700 6.65 Min 10,000 15,000 15,000 2.00 Max 3,500,000 1,000,000 1,000,000 19.50 Number of observations 389 223 223 207
Note: Not all firms whose bank loan was approved gave information about the interest charged. Therefore the number of observations is somewhat smaller in the column describing the interest rate charged than the number of approved bank loans.
4. Econometric analysis
So far, we have found evidence that non-European immigrants perceive more discrimination from suppliers, customers and banks. We have also found evidence that firms owned by immigrants apply for more loans than firms owned by natives and that such firms are more likely have their load applications denied. Furthermore, we have also found evidence that firms owned by immigrants are charged higher interest rates on their loans than are firms owned by natives. In order to investigate whether these differences can be explained by characteristics of the self-employed and their firms we will in this section conduct an econometric analysis of loan applications, loan denials, and interest charged, in which we control for differences across self-employed individuals and their firms.
4.1 Loan applications
Table 5 presents results from a linear probability model of the probability of applying for bank loan. Specification 1 contains only two dummy variables which indicate the immigrant background of the owner of the firm. The variable 0.1130 for Non-European countries in
Specification 1 indicates that firms owned by an immigrant from a non-European country
have an about 11.3 percentage point higher propensity of applying for a loan than firms owned by a native. Furthermore, firms owned by an immigrant from a European country have an about 6.9 percentage point higher probability of applying for a loan than do firms owned by a native. These figures are very similar to the raw data on loan applications presented in Table 3.
Besides the dummy variables for the immigrant background of the owner of the firm
Specification 2 add controls for characteristics of the firm and its owner while Specification 3,
besides firm and owner characteristics adds region and business line fixed effects.12 Table 5 reveals that the observed difference between immigrants and natives in the probability of applying for a bank loan decreases when controls are added to the regression. Specification 3, which includes all control variables, shows that the probability of applying for a bank loan is about 6.3 percentage points higher for a firm owned by a non-European immigrant than for a
firm owned by a native and about 4.7 percentage points higher for a firm owned by a European immigrant than for a native.
Table 5: Linear probability estimates of the probability of applying for a loan (standard errors in parentheses)
Specification 1 Specification 2 Specification 3 Europe 0.0692*** 0.0394* 0.0468* (0.0224) (0.0237) (0.0239) Non-European countries 0.1130*** 0.0460* 0.0633** (0.0232) (0.0268) (0.0271) Number of observations 1,834 1,834 1,834 R2 0.012 0.075 0.103
Note: Specification 1 includes no controls. Specification 2 adds controls for firm and owner characteristics and Specification 3 adds region and business line fixed effects. The results are weighted and adjusted for the sampling design using Stata svy commands.
* p < 0.10, ** p < 0.05, *** p < 0.01
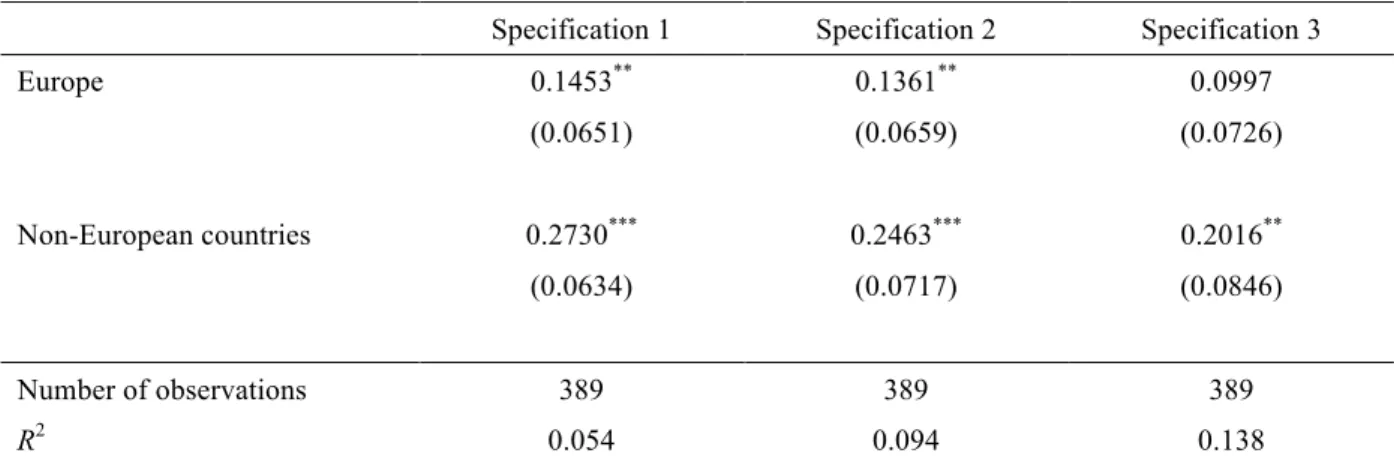
4.2 Loan denials
The results from a linear probability model of the probability of loan denials are presented in Table 5. As in the model with loan applications, Specification 1 includes only dummy variables which indicate the immigrant background of the owner of the firm. The results from
Specification 1 show that firms owned by a non-European immigrant have about a 27.3
percentage point higher probability of having a loan denial than does a firm owned by a native. The corresponding differential between firms owned by a European immigrant and firms owned by natives is about 14.5 percentage points. Once again, these results are very similar to the raw data presented in Table 3.
As we add controls to the regressions, the differences between immigrants and natives decrease. Thus, differences in firm and owner characteristics between firms owned by immigrants and natives explain part of the differences in probability of having a loan denial that we observed in Table 3 and in Specification 1 in Table 6. In fact, Specification 3 shows no statistically significant differences in loan denials between firms owned by immigrants from Europe and natives when we control for the full set of firm and owner characteristics. However, for firms owned by immigrants from non-European countries the probability of
having a loan denial is still about 20.2 percentage points higher than for firms owned by natives when we control the full set of variables in the regression.
Table 6: Linear probability estimates of the probability of loan denial (standard errors in parentheses)
Specification 1 Specification 2 Specification 3 Europe 0.1453** 0.1361** 0.0997 (0.0651) (0.0659) (0.0726) Non-European countries 0.2730*** 0.2463*** 0.2016** (0.0634) (0.0717) (0.0846) Number of observations 389 389 389 R2 0.054 0.094 0.138
Note: Specification 1 includes no controls. Specification 2 adds controls for firm and owner characteristics and Specification 3 adds region and business line fixed effects. The results are weighted and adjusted for the sampling design using Stata svy commands.
* p < 0.10, ** p < 0.05, *** p < 0.01
4.3 Interest rates charged
Table 7 presents the results from OLS-estimations of differences in interest rates charged. All specifications are the same as those reported for loan applications and loan denials. However, the dependent variable is the interest rate charged by the banks. The table shows no statistically significant differences in the interest rate charge by the banks for loans to firms owned by immigrants from European countries and firms owned by natives. According to
Specification 1, which includes no controls, firms owned by immigrants from non-European
countries are charged about 1.42 percentage points higher interest rate on their bank loans than are firms owned by natives. This differential decreases only slightly when we add the full set of controls for firm and owner characteristics in the regressions. Specification 3 shows that firms owned by non-European immigrants are charged about 1.20 percentage point higher interest rates on the bank loans than are firms owned by natives.
Table 7: OLS estimates of interest rate charged on approved loan applications (standard errors in parentheses)
Specification 1 Specification 2 Specification 3
Europe 0.5638 0.4809 0.3427 (0.3441) (0.3441) (0.3732) Non-European countries 1.4193*** 1.4475*** 1.2023** (0.4257) (0.4557) (0.5166) Number of observations 207 207 207 R2 0.059 0.143 0.212
Note: Specification 1 includes no controls. Specification 2 adds controls for firm and owner characteristics and Specification 3 adds region and business line fixed effects. The results are weighted and adjusted for the sampling design using Stata svy commands.
* p < 0.10, ** p < 0.05, *** p < 0.01
5. Conclusions and discussion
We have presented results from a survey regarding access to financial capital conducted among immigrants and natives who are self-employed in private firms in Sweden's retail, trade or service sector. The results indicate that self-employed non-European immigrants perceive more problems and obstacles than natives and European immigrants in their self-employment activities. Non-European immigrants are more likely to consider access to financial capital than are natives and European immigrants. Furthermore, self-employed non-European immigrants perceive more discrimination by banks, suppliers, and customers than do self-employed natives and self-employed European immigrants.
The results also show that immigrant firms are more likely to apply for bank loans than are firms owned by self-employed natives. One reason for this might be that firms owned by immigrants are younger than firms owned by natives and therefore need loans to finance their self-employment activities. However, a differential in the propensity of applying for a loan remains when we control for the firm’s age. Therefore, it is reasonable to conclude that other factors than the age of the firm can explain this result. One such explanation might be that our study is limited to private firms and that native self-employed who need more financial capital than immigrants are tend to be active in limited liability companies, not in private firms.
If we turn to loan denial rates and interest charged, we find that self-employed non-European immigrants are more likely than employed natives of having a loan denial, and that
self-employed non-European immigrants are charged higher interest rates on their bank loans than self-employed natives are. The fact that certain ethnic groups have higher loan denial rates and are charged higher interest rates on their loans is consistent with what has been found in previous research from other countries.13 There are several plausible explanations for these results. Explanations may be found in differences in the characteristics of immigrant and native firms that we not have been able to control for in our study. Other explanations might be found in the occurrence of ethnic discrimination in the market for bank loans in Sweden. Even if we, with our data, not are able to single out ethnic discrimination as the explanation, we know from previous research that certain non-European immigrant groups are discriminated against on different markets in Sweden.14 Against this background, we believe that discrimination in the market for bank loans is likely to explain at least some of the differences observed between non-European immigrants and natives in the propensity of having a loan denial and in the interest rate they are charged.
The results from our survey provide useful insights into the problems and obstacles immigrants encounter in their self-employment activities. Previous research has demonstrated that immigrants in several countries are over-represented in self-employment compared to natives. It is also known that the exit rates from self-employment often are higher among immigrants than among natives. The access to financial capital plays an important role both for the employment decision and for the possibility of survival and success in self-employment. Our results are in line with the findings of previous research and underline that problems with access to financial capital may impede successful self-employment for certain ethnic groups. This obstacle may be one explanation for the high exit rates from self-employment among immigrants that have been previously documented in other countries.
Finally, our results suggest that further research in this area is needed. Since we have found that self-employed non-European immigrants perceive more discrimination from banks, that they have a higher risk of loan denial, and that they are charged higher interest rates on their loans, more research efforts should be devoted to identifying discrimination in financial markets. Well-designed field experiments conducted in the market for bank loans may be a useful approach.
13 See e.g. Cavallusso & Cavalluzzo (1998), Cavalluzzo et al. (1999), Blanchflower et al. (2003), Blanchard et al.
(2008) and Asiedu et al. (2012) for studies from the US.
14 For a study of ethnic discrimination on the Swedish labour market, see Carlsson & Rooth (2007). For a study
References
Ahmed, A. & Hammarstedt, M. (2008). Discrimination in the rental housing market – a field experiment on the internet, Journal of Urban Economics, 64, 362–372.
Andersson, L. (2011). Occupational choice and returns to self-employment among immigrants, International Journal of Manpower, 32, 900–922.
Andersson-Joona, P. (2010). Exits from self-employment: Is there a native-immigrant difference in Sweden? International Migration Review, 44, 539–559.
Andersson, L. & Hammarstedt, M. (2011). Invandrares egenföretagande – trender, branscher, storlek och resultat, Ekonomisk Debatt, 39, 31–39.
Asiedu, E., Freeman, J.A. & Nti-Addae, A. (2012). Access to credit by small businesses: How relevant are race, ethnicity and gender?, American Economic Review: Papers & Proceedings, 102, 532–537.
Bates, T. (1999). Exiting self-employment: An analysis of Asian-immigrant owned businesses, Small Business Economics, 13, 171–183.
Blanchard, L, Zhao, B. & Yinger, J. (2008). Do lenders discriminate against minority and woman entrepreneurs?, Journal of Urban Economics, 63, 467–497.
Blanchflower, D.G., Levine, P.B. & Zimmermann, D.J. (2003). Discrimination in the small-business credit market, Review of Economics and Statistics, 85, 930–943.
Blanchflower, D.G. & Oswald, A. (1998). What makes an entrepreneur? Journal of Labor
Economics, 16, 26–60.
Borjas, G. J. (1986). The self-employment experience of immigrants, Journal of Human
Resources, 21, 487–506.
Carlsson, M. & Rooth, DO. (2007). Evidence of ethnic discrimination in the Swedish labour market using experimental data, Labour Economics, 14, 716–729.
Cavalluzzo, K.S. & Cavalluzzo, L.C. (1998). Market structure and discrimination: The case of small businesses, Journal of Money, Credit and Banking, 30, 771–792.
Cavalluzzo, K.S., Cavalluzzo, L.C. & Wolken, J. (1999). Competition, small business financing and discrimination: Evidence from a new survey. In Blanton, J.L., Williams, A. & Rhine, S.L.W. (eds.) Business Access to Capital and Credit. Arlington, VA.
Clark, K. & Drinkwater, S. (2000). Pushed out or pulled in? Self-employment among ethnic minorities in England and Wales, Labour Economics, 7, 603–628.
Constant, A. & Zimmermann, K. F. (2006). The making of entrepreneurs in Germany: Are immigrants and natives alike? Small Business Economics, 26, 279–300.
Fairlie, R. W. (1999). The absence of the African-American owned businesses: An analysis of the dynamics of self-employment, Journal of Labor Economics, 17, 80–108.
Fairlie, R. W. & Meyer, B. D. (1996). Ethnic and racial self-employment differences and possible explanations, Journal of Human Resources, 31, 757–793.
Fairlie, R.W. & Robb, A. M. (2007). Why are black-owned businesses less successful than white-owned businesses? The role of families, inheritances, and business human capital”,
Journal of Labor Economics, 25, 289–323.
Hammarstedt, M. (2001). Immigrant self-employment in Sweden – its variation and some possible determinants, Entrepreneurship and Regional Development, 13, 147–161.
Hammarstedt, M. (2004). Self-employment among immigrants in Sweden – an analysis of intragroup differences, Small Business Economics, 23, 115–126.
Hammarstedt, M. (2006). The predicted earnings differential and immigrant self-employment in Sweden, Applied Economics, 38, 619–630.
Hout, M. & Rosen, H. (2000). Self-employment, family background, and race, Journal of
Human Resources, 35, 670–691.
Le, A. T. (2000). The determinants of immigrant self-employment in Australia, International
Migration Review, 34, 183–214.
Lofstrom, M. & Wang, C. (2006). Hispanic self-employment: A dynamic analysis of business ownership, IZA Discussion Paper, 2101.
Raturi, M. & Swamy, A.V. (1999). Explaining ethnic differentials in credit market outcomes in Zimbabwe, Economic Development and Cultural Change, 47, 585–604.
Robb, A. M. & Fairlie, R. W. (2009). Determinants of business success: An examination of Asian-owned businesses in the USA, Journal of Population Economics, 22, 253–266. Storey, D.J. (2004). Racial and gender discrimination in the micro firms credit market?: Evidence from Trinidad and Tobago, Small Business Economics, 23, 401–422.
Vinogradov, E. (2007). Cultural background, human capital and self-employment rates among immigrants in Norway, Entrepreneurship and Regional Development, 19, 359–376.
Yuengert, A. M. (1995). Testing hypotheses of immigrant self-employment. Journal of
Appendix A: Survey questions
1. Sex
2. Year of birth 3. Country of birth
4. What year did you start your firm? 5. How many employees do you have?
6. To what extent do you experience problems with the following aspects in your firm today? (Answers were ranked on a four digit scale from very serious to no problem.)
a. Access to financial capital b. Laws and regulations c. Payroll taxes
d. Access to workers
e. Perceived discrimination by customers f. Perceived discrimination by suppliers g. Perceived discrimination by banks
7. To what extent have you experienced problems with the following aspects in your firm since 2011? (Answers were ranked on a four digit scale from very serious to no problem.)
a. Access to financial capital b. Laws and regulations c. Payroll taxes
d. Access to workers
e. Perceived discrimination by customers f. Perceived discrimination by suppliers g. Perceived discrimination by banks
8. To what extent to you expect to face problems with the following aspects in your firm in the following three years? (Answers were ranked on a four digit scale from very serious to no problem.)
a. Access to financial capital b. Laws and regulations c. Payroll taxes
d. Access to workers
e. Perceived discrimination by customers f. Perceived discrimination by suppliers g. Perceived discrimination by banks
9. Have you applied for a bank loan to your firm since 2011? (If you have made several loan applications, focus on the last loan that you applied for.)
10. How much money did you apply for? (If the individual answered yes to question 9.) 11. Was the loan application approved by the bank?
12. How much money were you allowed to borrow for your firm? (If the individual answered yes to question 11.)
13. What interest rate were you charged on your loan? (If the individual answered yes to question 11.)
Appendix B
Table B1: List of variables
Dependent variables
Loan application 1 if the firm applied for a bank loan since 2011, 0 otherwise
Loan denial 1 if the firm’s bank loan application was denied, 0
otherwise
Interest rate charged The interest rate charged on approved loan
applications (numerical)
Independent variables
Sweden Reference
Europe 1 the firm owner is born in a European country, 0 otherwise
Non-European countries 1 if the firm owner is born in a non-European country, 0 otherwise
Firm characteristics
Number of employees Number of employees in 2011 (numerical) Net sales Net sales in 2011 (SEK, numerical) Result Result in 2011 (SEK, numerical) Firm age Firm age in 2011 (numerical) Owner characteristics
Age Owner’s age in 2011 (numerical) Male 1 if the owner is male, 0 otherwise
Primary school 1 if the owner has primary schooling in 2011, 0 otherwise (reference)
Secondary school 1 if the owner has secondary schooling in 2011, 0 otherwise
University degree 1 if the owner has a university degree in 2011, 0 otherwise
Labour earnings Labour earnings from self-employment and wage employment in 2011 (numerical)
Capital income Capital income in 2011 (numerical)
Other
Region Dummy variables for 8 national districts defined by Statistics Sweden in 2011
Business line Dummy variables for 6 business lines in 2011 (Trade and repair of motor vehicles, wholesale and
commission trade, retail trade, transportation and warehousing, hotel and restaurant, personal services and other service businesses)
Table B2: Business lines of total sample of firms (per cent)
All Sweden Europe Non-European countries Trade and repair of motor
vehicles 5.89 8.40 6.33 3.49
Wholesale and commission
trade 6.71 8.59 9.20 2.73
Retail trade 17.83 20.31 15.38 18.36 Transportation and
warehousing 17.78 13.87 14.18 24.43 Hotel and restaurant 16.52 5.08 19.00 22.91 Personal services and other
service businesses 35.27 43.75 35.90 28.07 Number of observations 1,834 512 663 659
Table B3: Business lines of firms who applied for a loan (per cent)
All Sweden Europe Non-European countries Trade and repair of motor
vehicles 6.17 12.00 7.69 2.34 Wholesale and commission
trade 8.23 16.00 8.39 4.68
Retail trade 15.17 22.67 13.29 13.45 Transportation and
warehousing 24.94 16.00 20.98 32.16 Hotel restaurant 24.68 8.00 27.27 29.82 Personal services and other
service businesses 20.83 25.33 22.38 17.54 Number of observations 389 75 143 171