Current Use of Lighting Simulation Tools in Sweden
Anahita Davoodi
1Peter Johansson
1Thorbjörn Laike
2Myriam Aries
11Department of Construction Engineering and Lighting Science, Jönköping University, Sweden
2Department of Architecture and Built Environment, Environmental Psychology, Lund University, Lund, Sweden Corresponding author Email: Anahita.davoodi@ju.se
Abstract
This paper presents the findings of a web-based survey on the current use of lighting simulation tools in Sweden. The objective was to understand which lighting simulation tools are currently used in Sweden and to understand the design practitioners’ needs for future software development. The results showed that lighting simulation programs are widely used in Sweden. However, the respondents paid less attention to daylight than to artificial light. The respondents’ principal training methods were university courses and self-study. Interior illuminance values, glare indexes, and the daylight factor were the most commonly calculated simulation outputs. “Ease of use” and “accuracy” were identified as the most important factors in the use of the software, while “slowness of simulations process” causes the most dissatisfaction. Dialux was the most popular software program used.
Keywords: Lighting Simulation tools, Simulation programs, Lighting design, Dialux
1
Introduction
Good lighting quality is one of the essential values that buildings provide. The effect of daylight on saving energy, occupant well-being, and productivity is demonstrated in various studies (Veitch and Newsham ,1997; Bodart and De Herde, 2002; Krarti et al., 2005; Reinhart et al., 2006; Aries and Newsham, 2008; Borisuit et al., 2015; Yu and Su, 2015; Arif et al., 2016; Tonello et al., 2019). In addition, the right balance between daylighting and artificial lighting is necessary for providing good lighting (Boyce 2014).
Lighting simulation tools help designers to analyze different aspects of lighting quality and assess alternatives design solutions (Reinhart and Fitz, 2006). Using these tools provides a great opportunity to improve the quality of lighting in indoor environments as well as to save energy. Their applications and functions are growing rapidly, and currently more lighting designers, engineers, and architects increasingly tend to use these tools (Hien et al., 2000; Reinhart and Fitz, 2006)
This survey investigated the current use of lighting simulation tools in Sweden. The aim of the survey was to understand which lighting design tools are currently
used, and to understand the design practitioners’ needs for future software development. The target audience was lighting designers, architects, engineers, and researchers who work in interior lighting design.
1.1 Previous studies
Reinhart and Fitz (2006) reviewed previous surveys on the use of lighting simulation tools covering the period from 1985 to 2002 and followed on with a web-based survey focused solely on the use of daylight simulation tools. The goals of the paper were to identify the most popular daylighting design tools, the top metrics measured and to investigate how these metrics influenced design decisions. They received responses from 193 participants from 27 countries. More than 50% of the simulation software used by the participants was based on Radiance (Larson, Shakespeare et al. 1998). Daylight factor and illuminance level were the most measured metric, and type and control of shading devices were the design aspect most influenced by the simulation results.
A paper authored by Attia et al. (2012) reviewed current trends in building simulation and outlined the major criteria for selection and evaluation of building performance simulation (BPS) tools, based on analyzing user’s needs for tools capabilities and requirement specifications. The main criteria suggested for software evaluation included: usability and information management (UIM), integration of intelligent design knowledgebase (IIKB), accuracy of tools and ability to simulate detailed and complex building components (AADCC), interoperability of building modeling (IBM), and integration with building design process (IBDP). Four hundred and forty-five architects and 453 engineers responded to the survey, providing a snapshot of the preference for and current use of the ten BPS tools. The results of the survey confirmed the previous findings of architects’ preference for better UIM of BPS interfaces (Attia 2009; Holm 1993; Mahdavi, 2003; Punjabi 2005; Van Dijk 2002). On the contrary, the engineers’ top BPS tool selection criterion was the AADCC. The authors concluded that development of the next generation of BPS tools had to be directed within the gestalt of UIM interface, IIKB, AADCC, IBM, and IBDP (Attia et al., 2012).
A state of the art literature review in lighting simulation for building science was conducted by
(Ochoa et al., 2012). The study explored main aspects of a program (input, modelling, and output) and concluded that lighting simulation for building science has advanced rapidly within two decades. Aspects that have experienced development were: accuracy, number of parameters to calculate, computational times, scenario complexity and connection to whole building simulation. Radiance remains a widely accepted general purpose simulation engine.
2
Method
The method and questionnaire for the survey by Reinhart and Fitz (2006) was used as a base for this survey. The major differences were that this survey was geographically limited to Sweden with a special focus on lighting designers. In addition, the domain was extended beyond daylight to include electrical light.
2.1 Participants selection
For convenience and ease of reach, this survey was conducted remotely via an online surveying service from October 27 to December 8, 2014. Two resources were used to identify lighting designers: the first resource was the list of graduates from Lighting Design program at Jönköping University (Sweden), which accounted for about 43% of participants (N=54). The remaining (N=81) lighting designers were identified from the list of registered companies in the Ljuskultur database (www.ljuskultur.se), the magazine for lighting designers in Sweden. In total, emails were sent to 135 people to invite them to participate, out of which 15 emails were not delivered. One of the participants forwarded the questionnaire to four other lighting designers, so the target audience was 124 designers in total. Nine people responded saying they do not work in the area (anymore). Five people declined to participate. Thirty-one people took part and filled out the questionnaires, which was 28% of our target audience.
According to the Ljuskultur database, there are 75 registered companies in the lighting design field. Since the questionnaire spread over 25 unique companies, the results of this survey represent one-third of the Swedish lighting design companies.
2.2 Questionnaire procedure
The creation and administration of the questionnaire were done with Survey Gizmo (www.surveygizmo.com). The questionnaire contained four types of questions: multiple choice multiple selection (check box), multiple choice single selection (radio button), prioritizable selection list (Drag & Drop Ranking question), and open question (free text). Some of the multiple-choice questions had an additional textbox for custom input or clarification of answers. It was possible to leave some questions unanswered.
A draft version of the questionnaire was tested for clarity and integrity by lighting expert colleagues at
Jönköping University. The questionnaire was revised according to the comments and feedback and approved for final distribution.
The questionnaire began with a welcome page and a short description of the survey. The first section collected the background information of the participants: age, gender, education, profession, and types of companies in which they worked and for how long. The second and third sections were dedicated to daylighting and electric light, respectively. There were two branching questions in each section and a final open-ended question as outlined below:
1. Do you consider daylighting/electric lighting in your design?
a. If yes, answer more detailed questions b. If no, go to 3
2. Do you use simulation tools in your design? a. If yes, answer more questions about
simulation tools and their pros and cons
b. If no, why not? 3. Open-ended question:
a. For daylighting section: “Do you think the use of daylight should be increased? If so, how?”
b. For electric lighting section: “What do you think is the most important item to do to create better electric lighting design?”
Depending on the answers given, the questionnaire varied in length from 11 to 36 questions.
3
Results
3.1 Participants’ background
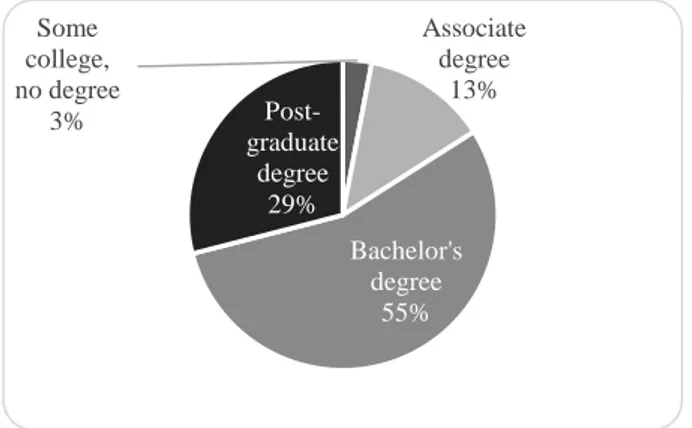
The survey results on the participants’ background showed that 46% of them were 25 to 34 years old and 35% were 35 to 54 years old; two-third of the participants were men. In terms of education, 55% had a bachelor’s degree and 29% had a post-graduate degree (Figure 1.).
Figure 1. Participant´s education
As expected, most of the participants (85%) identified themselves as a lighting designer. In addition, there were two lighting consultants, an engineer, a technical manager, and outdoorlighting designer among the participants (Figure 2.)
Figure 2. Participant´s profession
Forty-three percent of the participants had more than 10 years of work experience in lighting design, 30% had 3–5 years, and 17% had 5–10 years. Only three respondents had less than two years of work experience. The majority of participants (87%) said that they worked in a lighting design company. However, they also added other fields to their company's area of operation including luminaire manufacturing/trade, construction, infrastructure and urban design and planning, landscape architecture, environmental consulting, electrical design, heating ventilating/ventilation and air conditioning (HVAC) design, and telecommunications.
The participants were from companies of varying sizes: 23% of the people were from companies with 1– 19 employees, 27% with 20–99, 13% with 100–499,
23% with 500–100,000, and 13% with 10,000+ employees.
3.2 Daylight
The aim of the daylight section was to investigate how and to what extent lighting designers considered aspects of daylight in their design. Twenty (65%) of the 31 individuals who completed the survey, said that they take daylighting into account in their designs.
Out of those who considered daylighting, 85% (17) used daylight simulation tools. The 15% who did not simulate daylight, mentioned two reasons for this: either their clients were not willing to pay for the service or the tools were not reliable. This group used their experience combined with lookup tables for estimating and calculating daylight metrics during the schematic design and design development phases.
The 17 participants who used simulation tools were asked to specify the primary simulation tool they were using. They could choose one item out of ten popular programs or enter a custom program name. As shown in Figure 3., Dialux was by far the most popular software, followed by Diva (12%), Relux (12%), and Ecotect/Radiance (6%).
The lighting designers then selected the type of outputs they calculated using simulation tools. They could choose from several predefined options and could append additional comments. The overall majority (88%) of designers calculated interior illuminance. Glare indices came second. Daylight factor and interior luminance were calculated with the same frequency at the third place. One person also mentioned the calculation of exposure time to UV. Figure 4. illustrates the answers.
Figure 4. Type of outputs calculated using software
Some college, no degree 3% Associate degree 13% Bachelor's degree 55% Post-graduate degree 29% Lighting Designer 85% Engineer 3% Consultant 6% Other 6% 59% 88% 59% 53% 65% 35% 6% Ecotect + Radiance 6% Dialux 70% Relux 12% Diva 12%
The next set of results was about the stages(s) of the lighting design process in which simulation tools were employed. The participants could choose among the following alternatives: schematic design, design development, detailed design, and others. Answers indicated that the use of simulation tools were highest during the design development stage (34%); however, a number of comments highlighted the importance using the simulation tools in all stages of the design. The choices for which of the eight design aspects most influenced daylighting analysis were weighted based on how the respondents had prioritized them (number of options minus the rank in the selection). The score computed for each answer option is the sum of all the weighted values. The results showed that “size of
windows”, “room dimensions”, and “building orientation” were influenced the most by daylighting
analysis. The results for how participants had learned to work with the software tools showed that 65% had university training, 53% trained themselves, and 18% were trained at a company (respondents could select more than one training method).
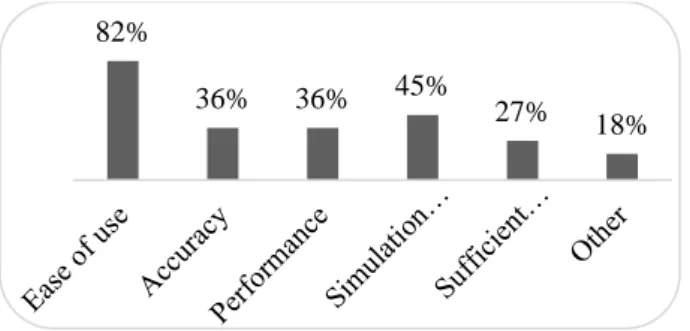
The results on the advantages of the simulation programs (including ease of use, accuracy, performance, simulation speed, sufficient program documentation, other) are shown in Figure 5. One designer expressed his/her satisfaction with the ability to reuse models from other disciplines by importing them into the chosen program.
Figure 5. Advantages of simulation programs
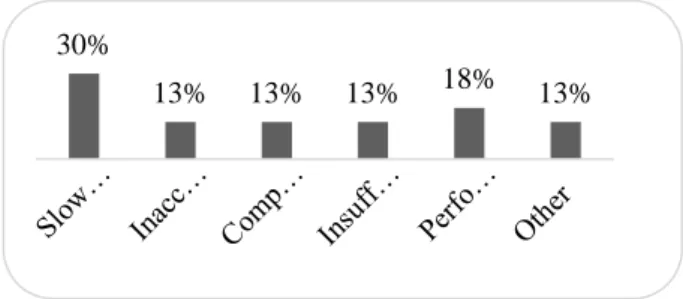
Regarding disadvantages of simulation tools, one concerned poor quality of rendering and another concerned the incompatibility of Dialux with Mac OS. program. The results on the Disadvantages of the simulation programs (including slowness, inaccuracy complexity, insufficient documentation, performance problems, and other) are shown in Figure 6.
Figure 6. Disadvantages of simulation programs
Finally, eight participants said they used additional software for daylighting analysis. The secondary software programs were: 3DS max (+mental ray), DAYSIM, Ecotect, Ecotect + DAYSIM, Photoshop, andAGI32. One of the participants added a tertiary software, Velux Daylight Visualizer.
3.3 Electric light
The results for the section on electric light show that all the participants except one (97%) did consider electrical lighting. Of those who considered it, the majority (93%) used a simulation tool in their design process. One participant did not use any simulation tools because his/her clients were not willing to pay for the extra service. Another did not find simulation tools reliable. These two designed based on their knowledge and experience.
The17 participants who considered both daylighting and electrical lighting in their design were asked if they were using the same tools for both tasks. Seventy percent of them responded yes. Dialux stood out being 86% of participants’ top choice. The type of outputs generated by designers using these tools are shown in Figure 7.
Figure 7. Type of outputs calculated by simulation tools
A comparison between the outputs generated for daylighting and electrical lighting is illustrated in Figure 8. By interpreting the answers, it can be observed that many designers used Dialux for calculating glare indexes produced by daylight. The method that Dialux used to calculate glare is recommended for electric light, but not for daylight (DiLaura, 2011; Jakubiec and Reinhart, 2012).
Figure 8. Comparison of outputs generated for daylighting
and electric lighting
75% 63% 38% 44% 44% 6% 30% 13% 13% 13% 18% 13% 21% 96% 46% 54% 46% 7%
Similar to that in daylighting design, the use of simulation tools in the electrical lighting design was highest during the design development phase (43%). Some designers stated that they used simulations tools throughout all stages of design.
The results on building design aspects that were influenced by electric lighting analysis revealed that “placement of fixtures” was affected more than any other design aspect.
The results on the software training methods (from those who had not already answered the question show that self-training was the dominant training method among participants (91%), followed by university (27%), company (18%), and workshop (18%) training. Those who had skipped the daylighting section (N=12) were asked about the advantages and disadvantages of the software tools in relation to electrical lighting. There were some complaints regarding the inconsistency of simulation and reality, poor performance, and lack of feature. The view of participants on the advantages of the software (including ease of use, accuracy, performance, simulation speed, sufficient program documentation, other) is illustrated in Figure 9.
Thirty-six percent of the participants said they worked with other simulation programs, and mentioned using 3ds Max, DIAlux (+ evo), Photoshop, RELUX, AGi32, and HIlITE as their secondary software.
3.4 Qualitative Results (Content Analysis)
Fifty-five percent of participants provided answers to the questions, “Do you think the use of daylight should
be increased? If so, how?” Most of them believe that it
should be increased, although one person said "Not necessarily more daylight but the ability to control daylight should be increased in a way that benefits the sense of light (e.g., excessive daylight from uncontrolled large glass windows that let in plenty of natural light can also increase the feeling of darkness in inner spaces farther away from windows.)" [Translated from Swedish]. The answers to the questions were summarized in five categories including organizational, technical development, laws and rule and education of designers.
Forty-eight percent of participants answered the questions, “What do you think is the most important
thing to do to create better electrical lighting design?”
Some of their suggestions were ‘better cooperation
between different actors in the process’, ‘better use of simulation programs’, and ‘Take the human demands into consideration to a larger extent’.
4
Discussion
Boundaries of this survey were limited in three aspects: geographically to Sweden, domain-wise to lighting design, and sample size to around 33% of the population of lighting designer’s company in Sweden. Therefore, care must be taken when using the results for other studies.
As the results show, the majority of lighting designers tend to consider both daylight and artificial light in their design. Moreover, a high percentage use some type of simulation tools for analysis and/or rendering. Among the different factors mentioned, user friendliness (ease of use), accuracy, and speed, stood out as being key criteria for users’ choice of software. Users were also reluctant to work with multiple software tools and preferred a one-size-fits-all type of software. The majority of participants ignored metrics such as daylight glare probability and dynamic daylight performance metrics, which are present only in relatively specialized software programs with relatively complicated user interfaces. If more attention was paid to these key user experience design factors in the development of new software programs or improvement of existing ones, it may result in greater use of the advanced metrics. If (very) specific lighting knowledge is needed to come up with proper results, it must be possible to bypass a sophisticated part of the software. The survey showed that the majority of the lighting designers has a bachelor’s degree in lighting design and know about the existence of certain advanced metrics but have no sufficient training in using them. Nonetheless, fixing one issue should not come at the cost of another but an optimal trade-off should be achieved. One such example is sacrificing accuracy for speed. As reported by some designers, low accuracy and reliability were the main reasons why they did not use certain software tools. However, advancements in computer technology will have a positive effect in overcoming issues regarding simulation time.
Participants’ comments in the open-ended questions imply that designers need a better understanding of software tools in terms of the features and limitations, accuracy, reliability, and the stage in which these tools should be employed. The results of this survey show that universities were the main training channel, which highlights the important role that universities can play in educating future lighting designers by offering specialized and advanced courses. This is especially true because of the ongoing paradigm shifts in building
82%
36% 36% 45% 27%
18%
Figure 9. The view of participants on the advantages of
modeling from document-based CAD models to object-based Building Information Modeling (BIM) process. BIM's emphasis on collaboration is in line with collaborative nature of lighting design processes, and the new generation of software applications can provide new methods of design at different levels and stages in an integrated environment. Simulation tools could also be used as an effective educational tool for understanding physical concepts in an interactive environment (Feng 2003, Reinhart, Dogan et al. 2012).
5
Conclusions
The work in this study revealed that lighting simulation programs are widely used in Sweden. The most commonly calculated performance metrics were illuminance values, glare indexes, and the daylight factor. “Ease of use” and “accuracy” were identified as the most important factors in the use of the software, while “slowness of simulations process” causes the most dissatisfaction. Dialux was the most popular software program used.
Acknowledgements
The authors would like to acknowledge the financial support of the Swedish Energy Agency and the Bertil
and Britt Svensson Foundation.
References
M. B. C. Aries and G. R. Newsham. Effect of daylight saving time on lighting energy use: A literature review. Energy Policy 36(6): 1858-1866, 2008.
M. Arif, M. Katafygiotou, A. Mazroei, A. Kaushik, and E. Elsarrag. Impact of indoor environmental quality on occupant well-being and comfort: A review of the literature. International Journal of Sustainable Built Environment 5(1): 1-11, 2016.
S. Attia, J. L. Hensen, L. Beltrán and A. De Herde. Selection criteria for building performance simulation tools: contrasting architects' and engineers' needs. Journal of Building Performance Simulation 5(3): 155-169, 2012. M. Bodart, and A. De Herde. Global energy savings in offices
buildings by the use of daylighting. Energy and Buildings 34(5): 421-429, 2002.
A. Borisuit, F. Linhart, J. L. Scartezzini, and M. Münch. Effects of realistic office daylighting and electric lighting conditions on visual comfort, alertness and mood. Lighting Research and Technology 47(2): 192-209, 2015.
P. R. Boyce. Human factors in lighting, The Crc Press. 2014. David DiLaura, Kevin Houser, Richard Mistrick, Gary Steffy. The IESNA lighting handbook: reference & application, Illuminating Engineering; 10 editions. 2011.
J. Feng. Computer simulation technology and teaching and learning interior lighting design. ACM SIGGRAPH 2003 Educators Program, ACM. 2003.
W. Hien, N., L. K. Poh and H. Feriadi. The use of performance-based simulation tools for building design and
evaluation-a Singapore perspective. Building and Environment 35(8): 709-736, 2000.
J. A. Jakubiec and C. F. Reinhart. The ‘adaptive zone’–A concept for assessing discomfort glare throughout daylit spaces. Lighting Research and Technology 44(2): 149-170, 2012.
M. Krarti, P. M. Erickson, and T. C. Hillman. A simplified method to estimate energy savings of artificial lighting use from daylighting. Building and Environment 40(6): 747-754, 2005.
G. W.Larson, R. Shakespeare, C. Ehrlich, J. Mardaljevic, E. Phillips, and P. Apian-Bennewitz. Rendering with radiance: the art and science of lighting visualization, Morgan Kaufmann San Francisco, CA. 1998.
Morales Ochoa, C. E., M. Aries, and J. Hensen. State of the art in lighting simulation for building science: a literature review. Journal of Building Performance Simulation 5(4): 209, 2012.
C. F. Reinhart and A. Fitz. Findings from a survey on the current use of daylight simulations in building design. Energy and Buildings 38(7): 824-835, 2006.
C. F. Reinhart, T. Dogan, D. Ibarra, and H. W. Samuelson. Learning by playing - teaching energy simulation as a game. Journal of Building Performance Simulation 5(6): 359-368, 2012.
C. F. Reinhart, J. Mardaljevic, and Z. Rogers. "Dynamic daylight performance metrics for sustainable building design. Leukos 3(1): 1-25, 2006.
G. Tonello, N. Hernández de Borsetti, H. Borsetti, L. Tereschuk, and S. López Zigarán. Perceived well-being and light-reactive hormones: An exploratory study. Lighting Research and Technology 51(2): 184-205, 2019.
J. A. Veitch and G. R. Newsham. Lighting quality and energy-efficiency effects on task performance, mood, health, satisfaction and comfort. In Illuminating Engineering Society of North America (Iesna) Annual Conference Proceeding 425-462, 1997.
X. Yu and Y. Su. Daylight availability assessment and its potential energy saving estimation -A literature review. Renewable and Sustainable Energy Reviews 52: 494-503, 2015.