Total Organic Carbon
Reduction of Sorting
by-Product Fractions
MSc in Resource Recovery
Industrial Biotechnology
Ahmad Abdul Rahman Alsaheb
ii
English title: Total Organic Carbon Reduction of Sorting by-Product Fractions Program: Resource recovery
Author: Ahmad Abdul Rahman Alsaheb Examiner: Professor Mohammad J. Taherzadeh Supervisor, name: Graham Aid, PhD, Tommy Ohlsson MsC. Supervisor, address: Ragn-Sells Group
Väderholmens Gård, 191 36 SOLLENTUNA
Keywords Total organic carbon, Loss on ignition, construction and demolition waste, TOC reduction, recycling, sequential separation treatment, converting waste to product
iii
ABSTRACT
The drive of the EU countries and most of the world towards a circular economy and to generate zero waste raised a need to study more efficient and less costly treatment processes. The treatment of secondary and by-product fractions to convert them from what is considered waste to a resource will contribute to the movement towards zero waste and circular economy. The fines fraction of construction and demolition waste (CDW) contains high organic
materials measured as total organic carbon TOC above the allowed landfilling levels that are allowed for landfilling in Sweden, yet lower organic matter than is required for energy recovery by incineration.
The need for new processes to reuse and recycle materials have emphasized the work of this study, this thesis research aims to develop viable, simple treatment methods and pathways of recycling systems to convert by-products that are considered waste to reusable and treatable fractions by reducing the total organic carbon TOC. Which have been defined in the research question of this study “How can functional recycling become more effective through the development of innovative treatment pathways for by-products of the recycling system”? and its sub-questions.
This study examined a fines fraction from the CDW sorting in Norway using mechanical separation methods including single and combined sequential processes of air classification and float/sink density separation.
Using single process batch separation of float/sink had produced a 73.80% weight of the original fines fraction, with reduced TOC from originally 35.54% DM to 4.09% DM which can be considered to be landfilled as non-hazardous provided that it meets all other leachate analysis criterion, on the other hand, the process produced concentrated the organic carbon in the float fraction giving a TOC of 40.14% DM to consider treating it with energy recovery.
Using a single separation process of high air velocity with the zigzag air classification has lowered the TOC of 19.49% weight of the treated fraction to 1.8% DM from 35.54% DM of the original fines fraction, which can be considered to be landfilled as inert waste if it meets all other leachate analysis criterion, or can be considered to be used in road base layers, and concentrated the organic carbon in the other fraction to TOC of 19.90% DM that which need further treatment. Using sequential air classification followed by float/sink sequential separation produced different low TOC fractions suitable for landfilling in the categories inert, non-hazardous, and hazardous waste in Sweden and concentrated the organic content to TOC levels of 20-48% DM TOC which can be considered for energy recovery recycling. The use of sequential density separation processes can lead to better results and can be controlled more to produced better fractions. The conclusion of this study, using float/sink and air classification separation methods as single or combined sequential processes had successfully produced two fractions firstly the reduced the total organic carbon separated fraction to be suitable the landfilling requirements in Sweden at the same time concentrated the organic material of the other fraction to be suitable for incineration.
iv
Contents
LIST OF FIGUERS ... vi
LIST OF TABLES ... viii
ACKNOWLEDGMENTS ... ix
1 INTRODUCTION ... 1
1.1 Literature Review ... 2
2 PURPOSE, RESEARCH QUESTIONS, AND APPROACH ... 7
2.1 Purpose ... 7
2.2 Research Questions ... 7
2.3 Approach ... 7
3 CASE STUDY ON FOCUSED MATERIAL (FINES FROM THE SORTING OF CONSTRUCTION WASTE MATERIAL) ... 10
4 MATERIAL and METHOD ... 12
4.1 TOC Reduction Methods Study ... 12
4.2 Sampling and Testing ... 13
4.3 Material Fractions Description and Characteristics. ... 13
4.4 Manual Characterization and Constituents Mapping. ... 14
4.5 Density ... 15
4.5.1 Material Densities Of Potential Materials In C&D Waste ... 16
4.6 Dry Matter (DM) ... 16
4.7 Loss-On-Ignition (LOI) ... 16
4.8 Total Organic Carbon (TOC) ... 17
4.9 LOI For TOC... 17
4.10 Separation and Treatment Methods ... 20
4.10.1 Solid material separation ... 20
4.10.2 Heavy-media separation (Fluid float/sink separation) ... 22
4.10.3 Air Classification ... 23
4.11 After Treatment Methods ... 27
4.11.1 Reuse ... 27
4.11.2 Incineration ... 27
4.11.3 Landfilling ... 28
5 RESULTS ... 29
5.1 Manual Characterization and Constituents Mapping. ... 29
5.2 Air Classification – A Single Process. ... 30
5.3 Float/Sink Separation – Single Process. ... 34
5.4 Air Classification Followed by Float/Sink Separation – Sequential Processes. ... 35
5.5 Float/Sink Followed by Air Classification Separation – Sequential Processes. ... 40
6 DISCUSSION ... 43
7 CONCLUSION ... 46
Appendix A.1 ANALYSES PROCEDURES ... 52
Appendix A.2 Density ... 52
Appendix A.3 Dry Matter (DM) ... 53
Appendix A.4 Loss-On-Ignition (LOI) ... 54
Appendix A.5 STATISTICAL RESULTS DETAILS ... 55
Appendix A.6 LOI For TOC ... 55
Appendix A.7 USED LABORATORY AIR CLASSIFIER DESIGN AND SHOP DRAWINGS 57 Appendix A.8 ILLUSTRATIVE GRAPHS ... 61
v
Appendix A.9 PHOTOgraphs OF THE PRODUCED FRACTIONS in the descussion
vi
LIST OF FIGUERS
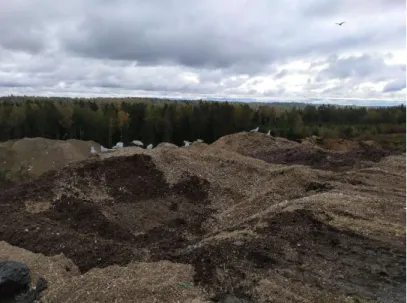
Figure 1 shows the construction solid waste fine fraction used as a landfill cover ... 2
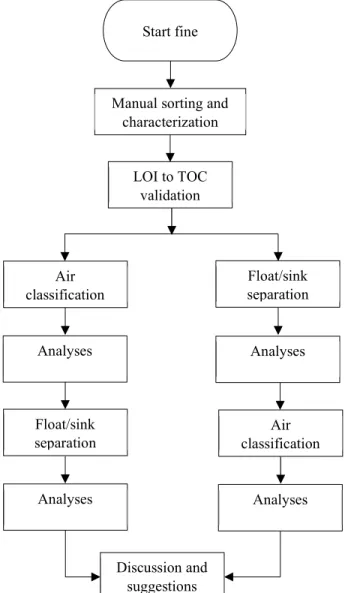
Figure 2 process flow chart of the thesis work ... 9
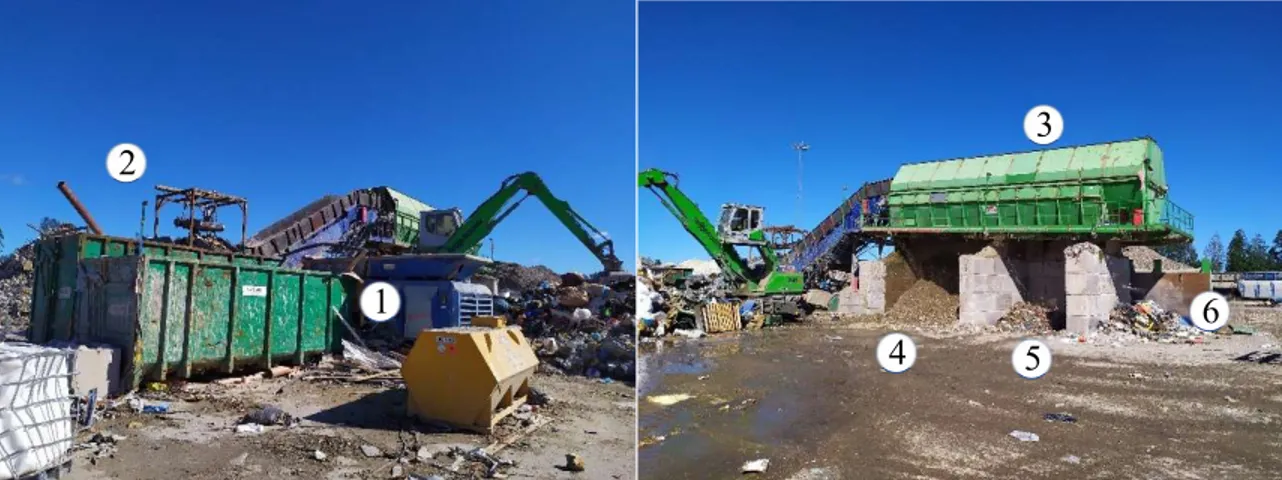
Figure 3 plant for mechanical processing of uncrushed fraction at Heljestorp. Numerical Explanation: 1) crushing, 2) metal separator, 3) drum screen, 4) fines fraction 5) coarse fraction 6) coarse fraction (incineration fuel). ... 10
Figure 4 Available separation machines at Ragn-Sells Heljestorp landfill. ... 12
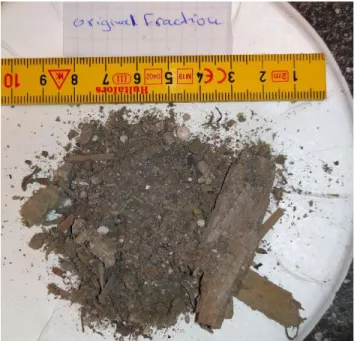
Figure 5 shows the complex components of the fine fraction. ... 14
Figure 6 KERN EMB 200-3V with YDB-01 density kit scale ... 15
Figure 7 the regression relation formula between LOI and TOC. ... 19
Figure 8 Design of the float/sink batch container ... 23
Figure 9 showing a positive direct relation between congestion factor and feed rate speed ... 25
Figure 10 cross-section diagram for the air classification used at the laboratory showing the sample and it’s fractions paths ... 26
Figure 11 Left the cardboard model, middle the plywood model during assembly, right the final laboratory classifier model at use. ... 26
Figure 12 results of manually sorted fraction percentage by weight by category Showing that approximately 10% of the fraction consists of plastic constituents, which will affect the selection of the suitable treatment methods, the high organic contents are present in three categories (Polymers, Lignocellulose, and Other). ... 30
Figure 13 photos of the five manually sorted fractions ... 30
Figure 14 shows the relation between air velocity and mass as the air velocity increases the mass of the high-density fraction decreases in inverse relation, the mass of the low-high-density fraction increases in direct relation, and the mass of the lost fraction also increases in a direct relationship. ... 32
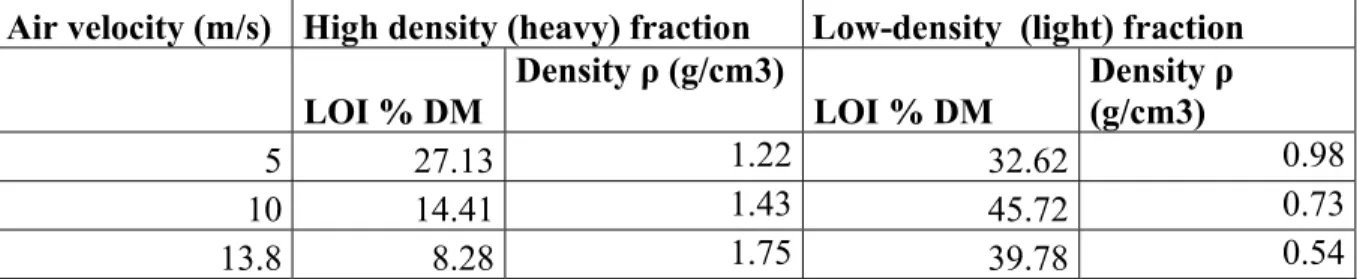
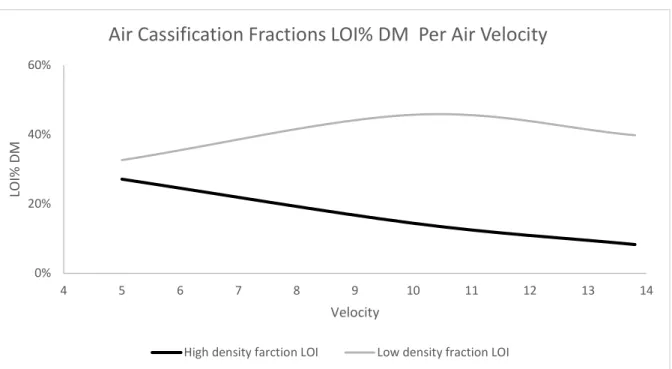
Figure 15 the results of LOI% DM shows a negative relation between LOI% DM of high-density fraction and the increment in the air velocity speed and positive relation between LOI% DM of low-density fraction and the increment in the air velocity speed. ... 33
Figure 16 the high-density LOI% DM, LOI reduction, and predicted TOC% DM per air velocity. ... 34
Figure 17 the low-density LOI% DM, LOI reduction, and predicted TOC% DM per air velocity. ... 34
Figure 18 Air classification + Float/Sink mass percentage per sequential process ... 37
Figure 19 Air classification + Float/Sink LOI% DM value per sequential process ... 38
Figure 20 Air classification + Float/Sink LOI reduction per sequential process ... 39
Figure 21 shows the relation between air velocity and mass as the air velocity increases the mass of the high-density fraction after float decreases in inverse relation, the mass of the low-high-density fraction after float increases in a direct relationship, and the mass of the lost fraction also after float increases in a direct relationship. ... 41
Figure 22 shows the relation between air velocity and mass as the air velocity increases the mass of the high-density fraction after sink decreases in inverse relation, the mass of the low-high-density fraction after sink increases in a direct relationship, and the mass of the lost fraction also after sink increases in a direct relationship. ... 42
Figure 23 the mass% results of the produced fraction from the sequential processes float + air velocity... 61
Figure 24 the LOI% DM results of the produced fraction from the sequential processes float + air velocity ... 61
Figure 25 the LOI reduction results of the produced fraction from the sequential processes float + air velocity .. 62
Figure 26 the predicted TOC% DM results of the produced fraction from the sequential processes float + air velocity ... 62
Figure 27 the mass% results of the produced fraction from the sequential processes sink + air velocity ... 63
Figure 28 the LOI% DM results of the produced fraction from the sequential processes sink + air velocity ... 63
Figure 29 the LOI reduction results of the produced fraction from the sequential processes sink + air velocity ... 64
Figure 30 the predicted TOC% DM results of the produced fraction from the sequential processes sink + air velocity ... 64
Figure 31 Photograph of the float fraction of the float/sink separation process ... 65
vii
Figure 33 Photograph of the low-density fraction of the air classification separation process at an air velocity of 5 m/s ... 66 Figure 34 Photograph of the low-density fraction of the air classification separation process at an air velocity of 10 m/s ... 66 Figure 35 Photograph of the high-density fraction of the air classification separation process at an air velocity of 10 m/s ... 67 Figure 36 Photograph of the low-density fraction of the air classification separation process at an air velocity of 13.8 m/s ... 67 Figure 37 Photograph of the high-density fraction of the air classification separation process at an air velocity of 13.8 m/s ... 68 Figure 38 Photograph of the sink fraction of the high-density fraction of the air classification separation process at an air velocity of 5 m/s... 68 Figure 39 Photograph of the float fraction of the high-density fraction of the air classification separation process at an air velocity of 5 m/s... 69 Figure 40 Photograph of the sink fraction of the low-density fraction of the air classification separation process at an air velocity of 10 m/s... 69 Figure 41 Photograph of the float fraction of the high-density fraction of the air classification separation process at an air velocity of 10 m/s... 70 Figure 42 Photograph of the sink fraction of the low-density fraction of the air classification separation process at an air velocity of 13.8 m/s ... 70 Figure 43 Photograph of the float fraction of the low-density fraction of the air classification separation process at an air velocity of 13.8 m/s ... 71 Figure 44 Photograph of the high-density fraction of the air classification separation process at an air velocity of 13.8 m/s of the sink fraction ... 71 Figure 45 Photograph of the low-density fraction of the air classification separation process at an air velocity of 13.8 m/s of the sink fraction ... 72
viii
LIST OF TABLES
Table 1 List of used standards ... 8
Table 2 lists of densities of potential materials that is can be found in the CDW. ... 16
Table 3 the values of the average laboratory analyses results and LOI internal analysis results. ... 19
Table 4 the average weight of the five different manually sorted fractions. ... 29
Table 5 the average mass results of the air classification experiment showing the high density, low-density, and loss fractions. ... 31
Table 6 LOI percentage average of the high density and low-density fraction per air velocity ... 32
Table 7 the results of LOI% DM, LOI reduction percentage, and predicted TOC% DM of the high-density and low-density fractions. ... 33
Table 8 Results of the mass%, LOI% DM, LOI reduction percentage, and predicted TOC% DM. ... 35
Table 9 Results of the sequential processes air classification then float/sink separation containing LOI% DM, LOI reduction percentages, and predicted TOC% DM. ... 36
Table 10 Results of sequential processes float + air classification separation showing mass percentage, LOI% DM, LOI reduction, and predicted TOC% DM. ... 40
Table 11 Results of sequential processes sink + air classification separation showing mass percentage, LOI% DM, LOI reduction, and predicted TOC% DM. ... 41
ix
ACKNOWLEDGMENTS
I would like to express my respect and gratitude to my examiner professor Mohammad J. Taherzadeh, for his support, teachings, patience, contribution, and advice, and both of my supervisors Graham Aid Ph.D., and Tommy Ohlsson MSc. For their contribution, support, and advice. I am grateful to Allah, the University of Borås for giving me this opportunity to gain better knowledge, to Ragn-Sells company and personnel for financing this project, and to give me all the needed tools and a family-like working environment.
In the end, I would like to thank my family for giving me high motivation and the strength to do this work.
1
1 INTRODUCTION
Humanity is in constant growth and development, every day new products are presented to the market, and often as a consequence more, new types of waste are generated. Scientific development puts us in inevitable challenges to find sustainable solutions to the issue of poorly handled waste (Singh, 2016; OECD(2019), 2019)
The challenge of knowing, understanding, and treating these wastes is an obligation to all of us. Hence the waste management science is in continuous development and updates especially in Europe and Sweden where the environment has a high priority in legislations waste management and treatment are of utmost importance (European Parliament and Council, 2008).
Until now landfill plays a major role in the waste management and end of life of some of the waste fractions, in 2010 23.21% of the generated waste (excluding major mineral wasted) have been landfilled in the EU (Eurostas, 2018), as to reduce landfilling and the impacts of the omitted gases and leachates produced by landfills legislations have been made to regulate the wastes to be landfilled, of high importance, are the organic contents and leachates. These regulations have set characterization to the waste to be landfilled and hence if the waste does not meet this characterization it has to be treated in other methods and this made the cost of waste treatment higher, hence finding new methods to manage these streams in more economical and easy methods have raised. Reinjecting material in the system by reusing the waste contributes to the circular economy approach taken by the EU (European Union, 2015), and reusing what is considered a waste converts the waste to a source (Taherzadeh and Richards, 2015) if the treatment of residues from the secondary resource recovery can become more effective, that secondary resource will become more competitive with the primary resource.
To avoid depletion of our sources and ensure good access to raw materials(European Union, 2008), the concentration on recycling as a secondary material production has increased significantly (European Parliament and Council, 2008; European Union, 2008; Naturvårdsverket, 2015b) and the recycling products must meet the quality requirements, for example, size, color, chemical properties, etc. To meet such requirements, there is often an inevitable by-product stream that must be developed for their secondary value chains obtaining high resource efficiency recycling (Swedish Environmental Protection Agency, 2012; Naturvårdsverket, 2015a) and prevent source scarcity (European Union, 2015; Singh, 2016) sometimes it is overlooked or neglected due to cost, time, lack of research, etc. In the real-world case at hand, after mechanical recycling of mixed construction materials, there are ‘fines’ materials (e.g. <3mm) that contain a mix of organic and inorganic substances. The inorganic fraction can be put into valuable use if the organic fraction can be separated in a cost-efficient manner. This study is to look for effective ways to manage this complex material fraction.
This project involves the studying of testing, separation, and treatment of a fine fraction of construction solid waste.
Finding a treatment method to reduce the total organic carbon (TOC) of this waste will not only allow it to be landfilled in inert or non-hazardous cells but also will reduce hazardous emissions.
2
1.1 Literature Review
The literature review was based on scientific articles, reports, books, and references relating to sampling theory. This study aims to develop a basis for the selection, comparison, and evaluation of the treatment methods to achieve a viable reduction of TOC via the separation of materials with rich organic content.
Methodological problems in the study were difficulty in obtaining the source as most articles were old or were conference documents not available through databases.
Loss on ignition as an indication of total organic carbos study has been made to reduce the time and cost needed to do TOC as the available test method in-house is LOI.
Several studies had been made to validate the loss on ignition (LOI) measurement to determine total organic carbon TOC, taking into consideration the low cost and ease of conduct of LOI over TOC. Thus more tests can be performed in a much shorter time and with twelfth the cost (De Vos et al., 2005).
Most studies at a simplified form adapted the ratio of LOI/TOC or the TOC/LOI. In the studies of soils, there was a great concern for the presence of clay that can bind to water. clay does not exist in our material thus all clay-related calculations will be excluded. The other concern is the loss of carbon via the release of CO2 from carbonates at temperatures higher than 500°C, and this has been avoided by using furnace degrees less than 500°C (Bojko and Kabała, 2014). Please refer to the LOI test description. Statistical approaches Tukey’s posthoc test, Pearson’s correlation coefficient, regression equations via statistical software have been used to analyze the variances and describe the relations between loss on ignition and total organic carbon.
3
The studies have divided the results of the relation between LOI and TOC into two main groups, 1) the first main group is the values of the conversion factor for LOI/TOC as 2.0, for values of LOI over 8-10% of the DM
2) the second main group which is divided into three subgroups
a) the first subgroup for the values of the conversion factor for LOI/TOC as 3.1, for values of LOI over 4-8 % of the DM.
b) the second subgroup if for the values of the conversion factor for LOI/TOC as 5.0, for values of LOI over 2-4 % of the DM.
c) and third subgroup if for the values of the conversion factor for LOI/TOC as 7.3, for values of LOI over 0-2 % of the DM (Bojko and Kabała, 2014).
Although other studies have given higher LOI/TOC at lower LOI values with a conversion factor of 5.8 (Howard and Howard, 1990). a conversion factor of 15.4 (Christensen and Malmros, 1982). nd a conversion factor of >50 at a low LOI/TOC ratio (Szava-Kovats, 2009)
Many papers have not been in favor of the use of LOI as an estimation of TOC (Howard and Howard, 1990) (Bhatti and Bauer, 2002) and others more have favored the use of LOI as an estimation of TOC (Spain et al., 1982; Goldin, 1987; David, 1988; Donkin, 1991; GREWAL, BUCHAN and SHERLOCK, 1991; Konen et al., 2002)The studied fraction in this thesis consists of a fine fraction of the construction demolition industrial sector which does not contain clay and in that case, wouldn’t need to have a clay facto in the conversion equation and thus (De Vos et al., 2005). As such, a conversion factor will be adapted after validating the existing fraction when comparing the LOI values with TOC values analyzed at an accredited laboratory.
Since the debate of LOI as an estimation of TOC is on lower values of LOI mainly >8% taking the lowest conversion factor LOI/TOC of 1.8 that gives a TOC value of 4.44% DM. and in the case of the highest conversion factor LOI/TOC of 50 that gives a TOC value of 0.16 % DM. samples that give values of LOI lower than 8% DM, will be validated with TOC analysis at an accredited laboratory. And since the statutory requirement to landfilling a non-hazardous waste is a TOC content of less than 10%DM § 29-30 NFS 2004: 10, that corresponds to an LOI value of 18%DM. The topic of characterization of waste is reviewed in the following selected studies.
The goal of this review is to find a viable method to reduce the total organic carbon, cost had to be considered as a major parameter in choosing the methods of treatment. Previous works focused on using a single separation method mechanical or chemical to achieve the desired outcome mainly reduce the organic content.
In the study Marklund et al., (2019) had focused the efforts to define a framework for heterogeneous waste characterization and management, taking into consideration the characterization that provides actual behavior not only the constituents of the heterogeneous mix waste, because the constituents do not provide information about the actual behavior of the waste, such analysis for actual behavior are thermogravimetric analysis, Biochemical methane potential,
4
etc. in his study he wanted to emphasize on the proper selection of the characterization tests to build an adequate model for characterizing the waste. The treatment methods in this study are divided between mechanical, and transformative, the first is self-explained by the name and the latter is a definition of the treatments that change the chemical structure of the waste to facilitate the separation process. And in the characterization, the study put three consequent steps it is the basic, separation oriented, and transformation oriented.
The study found out that the number of assays can be reduced using the top-down characterization and the treatment is found more easily.
Andersson and Jobs, (2013) study focused on the characterization of the mechanical and biochemical property of a mechanical generated landfill residue material at a landfill that belongs to RAGN-SELLS WASTE TREATMENT AB in Högbytorp in Upplands-Bro in Sweden. In the study the density, porosity, grain size distribution, shear strength, compression, swelling pressure, permeability, field capacity, and friction angle. And found high density and low compression, high shear strength, low grain size distribution, high porosity, and high field capacity, low permeability, low swelling pressure. The mechanical properties and for waste composition, leaching, and gas formation, and found low dry matter, high organic content, antimony, and zinc were leaching in high levels. This study was carried out on the landfilled waste to gain insight on the properties of the waste to landfilled and the effect of properties on the behavior of the waste at the landfill. In the study made by Marklund, Andreas, and Lagerkvist, (2018), for the treatment of crushed CDW with a DM 73 - 75% and volatile solids (VS) 14 - 42 %DM by sink/float in both lab and field scale, gave a sink fraction with VS 10 %DM and a TOC of 6.1 %DM and a float fraction with VS 96%DM and TOC of 42%DM, and the study concluded that water density separation is not suitable to reduce the organic carbon content of the fraction to an extent that suits the required Swedish scenario.
Montero et al., (2010) did an investigation study on how the organic and other materials are distributed in the construction and demolition waste using high density ranges with heavy liquid separation process using a different medium with different densities to locate the high concentrations of organic matter and gypsum and found that the distribution of TOC distribution
using a liquid with a density of 1g/cm3 was 71 % in the sink fraction and 29% in the float fraction
and the TOC distribution in the sink fraction decreases when the liquid density increases and the TOC distribution in the float fraction increases when the liquid density increases the study
concluded that organic matter was present in the densities lower than 1.5 1g/cm3 the separation of
1.5 is not recommended because of low efficiency.
Huang et al., (2002) study assessed different construction and demolition waste treatment methods including air classification among others. The study examined a treatment line consisting of several units they are bar screening to separate the bulk from fine materials, trommel screening also to sieve different size materials, disk screening to separate sand and soil from gravel, grain or pebbles, magnetic separator to extract ferrous metals, air classifier to separate lightweight materials such as paper and plastics, and finally manual separation to separate other materials like wood, non-ferrous metals, and others. The study said that the reusable materials consist of three streams the first stream consists of fine soil and sand, the second stream is gravel, grain, and pebbles, and the third
5
stream consists of bricks rocks and concrete mix to be restored in the same process, as for the paper and plastic the study considered it not suitable for reuse but to be sent to incineration. The study found that if the purities of the three mentioned produced streams could be removed in advance then the fractions are feasible to be used in the construction of roadbeds and backfilling.
The Separation methods have been reviewed in the following sources.
Worrell and Vesilind, (2012), explained that material separation is to separate mixed materials into two (binary separation), or more fractions (polynary separation). The separation is studied depending on one or more properties of the materials, for example, density, aerodynamic velocity, color, size, shape, etc. The methods for the separations vary from hand sorting, mechanical, electrical, magnetic, optical, chemical, etc. (Wang et al., 2015; Stegmann, 2018). In this thesis only mechanical binary separation concept is considered namely air classification and float/sink separation.
Both processes depend on classification which depends on the settling rate, the particles are classified and separated by allowing the particles to settle in a medium usually water or air using the particle properties like shape, size, and density. The heavier, smother, bulkier, and has less surface area particles settle faster than the lighter, rougher, smaller, and have higher surface area settles slower. The laws that model the settling in classifiers are strokes’ law for fine particles >0.053mm, and Newton’s law for particles above 5mm. but in reality, due to the complexity of the process variable, both laws are not applicable either for modeling or for analysis (Boettcher, 1972; Gill, 1991; Worrell and Vesilind, 2012).
Reuse, incineration, and landfilling are considered after treatment methods and have been reviewed in the following sources.
Reuse is required by all EU members the action plan in the EU to establish a sustainable and a circular economy, and one of the requirements is to preserve and maintain the primary sources (European Union, 2015) and to find an economic useful value to the what is considered residues of the processes rather than waste (Taherzadeh and Richards, 2015).
By reducing the organic content of some fraction like in the studied case above the residues of the construction and demolition fines fraction, the residues with very low TOC which mainly consists of extracted concrete, stone, brick, etc. can be used as ballast in road construction (Naturvårdverket, 2005), or for example can be used as a filler in the concrete.
Incineration the incineration of waste as a waste to energy (WtE) has increased since the last decade this is mainly due to the landfill bans, taxation of landfilling the goals set for a circular society (Naturvårdsverket, 2004a, 2015b; Naturvårdverket, 2005; European Union, 2008, 2015), etc. Efficient energy recovery is considered recycling (European Parliament and Council, 2008). Due to the high demand for heating and electrical energy in Sweden over 90% of energy is recovered (Naturvårdverket, 2005). There are two common types of incineration plants in Sweden, the grated bed and fluidized bed boilers (Taherzadeh and Richards, 2015).
6
A study by Serbanescu et al., (2017) study shows a positive relation between TOC% DM and LHV kcal/kg, by studying air-dried dehydrated sludge from municipal wastewater treatment plant the equation found was:
𝑳𝑯𝑽 = 𝟗𝟔. 𝟐 ∗ 𝑻𝑶𝑪 + 𝟓𝟑. 𝟕𝟑𝟔 kcal/kg Equation 1
R2 = 0,9473
This can be used as an indication for the suitability for energy recovery by incineration boilers before doing further analyses as per the requirements of the boiler o be sent to.
For example, the Uddevalla Kraft AB which runs a grating boiler requires an energy content of 7.5 - 15 MJ/kg in each delivery. And Borlänge Energi runs a fluidized bed that requires an energy content of 2.5 – 4 M Wh/ton in each delivery, and Samocha and Prangnell, (2019) illustrate that MSW is suitable for incineration with volatiles content ranging from almost 20 – 50%.
Landfilling, The Swedish management system has played a major role in reducing landfilling (Taherzadeh and Richards, 2015). Construction and demolition landfilled quantities has fallen from 900,000 tonnes in 1994 to 370,000 tonnes in 2003 (Naturvårdverket, 2005). Waste that is not allowed for landfilling will be pre-treated before further processing or sent to recycling for the end of life (Naturvårdverket, 2005). Only three types of waste are allowed in Sweden they are inert waste, non-hazardous waste, and hazardous waste Each type has to meet strict criteria before it is allowed to be landfilled (Naturvårdsverket, 2004b, 2010).
We found in the literature review that the attempts to reduce the organic content of waste
fractions are done using mostly a single process separation and the results were not satisfactory to and which highlighted the gap of using more complex separation processes and multiple
7
2 PURPOSE, RESEARCH QUESTIONS, AND APPROACH
2.1 Purpose
The purpose of this study is to:
1. Reduce the content of organic material in the case study material. 2. Recovery of recyclable materials from chosen treatment methods.
2.2 Research Questions
According to the purpose and at the beginning of this study the following research question has been developed focusing on the reduction of TOC in the case study material and finding solutions for the secondary waste materials:
RQ: “How can functional recycling become more effective through the development of innovative treatment pathways for by-products of the recycling system”?
Method: 3 CASE STUDY ON FOCUSED MATERIAL (FINES FROM THE SORTING OF CONSTRUCTION WASTE MATERIAL).
RQ 1 ” What factors are key to determining the effectivity of potential methods for the case at hand?".
Methods: sampling, material analysis, comparison of material analysis to legislative requirements. RQ 2 “What methods of treatment are available to enable more effective downstream pathways for the material in focus with factors from RQ1. in focus?
Methods: Literature survey.
RQ 3 “How do select approaches from RQ2 perform in accordance with RQ1”? Methods: lab-scale demonstration, material flow analysis, material property analysis
2.3 Approach
The thesis workflow was conducted as follows:
Define the scope of samples to be studied. To narrow the scope of this study and to make it as specific as possible only one sample source has been chosen as a representative sample and to reduce the testing cost.
Define testing, experimenting, researching methods, and the standards to which it should abide. Literature
8
Defining applicable International, EU standards, or Swedish standards, are there any permissions and exception laws for general and specific cases.
The following standards in Table 1 have been chosen as mentioned in the environmental protection agency regulations landfill, criteria, and procedures for receiving waste at the disposal of waste (NFS 2004:10, NFS 2010:4) and the internal adapted protocols at Ragn-Sells.
Process / Test Standard
Sampling EN 14899: 2005
Density ASTM D854
DM EN-14346
LOI SS-EN 15169:2007
TOC SS-EN 15936:2012
Table 1 List of used standards
Define data collection and reporting methods. All data to be collected have been put in a
Microsoft excel sheet and all calculations will be done by the software, for statistical calculations Minitab® 17.1.0 software has been used.
Samples that needed TOC validation were sent to an accredited laboratory to analyze the TOC. In the beginning, manual visual separation of 100g samples were performed to the main components to identify the different fractions and substances that constituent the organic composition of the fraction. This will lead to a better understanding of the fraction to achieve more viable and targeted treatment methods.
This will allow the characterizes of the physical and chemical properties of the fraction and its components.
Depending on the physical properties of the organic components and its volume, the mechanical separation treatment will be designed, the proposed mechanical separation methods are simple air classification and float/sink separation processes, these will be the mechanical separation methods since the fraction will be generated by the shredding and sieving of the construction and demolition waste, the sieving produces three fractions fine fraction which our sample comes from, coarse fraction and unshredded fraction Figure 2 shows the process flow chart of the thesis work.
9
The fine fraction falls by gravity from the drum sieve, which can be utilized to serve this process, a laboratory-scale test for the air classification will be designed to set the optimum parameters for the experiment before scaling up to the full-size separation process in the future in this study only the laboratory-scale will be discussed.
Start fine
Manual sorting and characterization LOI to TOC validation Float/sink separation Analyses Air classification Analyses Float/sink separation Analyses Discussion and suggestions Air classification Analyses
10
3 CASE STUDY ON FOCUSED MATERIAL (FINES FROM THE
SORTING OF CONSTRUCTION WASTE MATERIAL)
The fines fraction resulting from construction waste sorting comes from several facilities at Ragn-Sells: Heljstorp, Högbytorp, Häradsudden, Borlänge, and Torsvik. Additionally, Heljestorp has fractions from Norsk Gjenvinning (NG), RGS Nordic AB, Ragn-sells Norway. The studied material comes from Ragn-Sells Norway. This fraction is mainly from construction and demolition waste which contains a high content of wood as a main building material in the Scandinavian countries. This fraction was manually sorted for recyclable materials and the remaining fraction will be treated mechanically which hereafter will be called uncrushed fraction, the uncrushed fraction was then crushed before a further screening of recyclable materials.
After crushing the fractions were fed up on a conveyor belt. Above the conveyor belt is a magnetic separator that separates the ferrous metals from the crushed fraction. The magnet collected metals are kept in a separate container.
The conveyor belt then feeds the crushed fractions into a drum sieve with two outcomes fines fraction >100 mm, medium fraction >250 mm, and coarse fraction which goes to as an incineration fuel. In the drum screen separated fines fraction material from other materials. The fines fraction is reused to cover the landfills and consist of a mixture of for example plastics, wood, textiles, concrete, tiles, glass, and more. The fines fraction constitutes 80% of the total fed material as the medium fraction is sorted using another drum sieve. The principle of a drum screen is to create a good circulation of the material by continuously moving waste through the drum rotation. Screening of the fine fraction takes place through the meshes of the basket walls.
Figure 3 shows the pretreatment that the fines fraction undergoes before it is studied in this study.
Figure 3 plant for mechanical processing of uncrushed fraction at Heljestorp. Numerical Explanation: 1) crushing, 2) metal separator, 3) drum screen, 4) fines fraction 5) coarse fraction 6) coarse fraction (incineration fuel).
3
4 5
6 2
11
The landfill cover is considered as waste and can contain organic material (Arvidsson et al., 2012), (Naturvårdsverket, 2004a) but since the landfill cover has a limited required quantity and the production of the fines fraction will continue. The need for a competitive way of treatment has arisen.
The fines fraction consists of a mixture of organic and nonorganic matter, hence the untreated fine fraction is not accepted as a fuel at the incineration facilities because it has low energy content due to the presence of the inorganic materials, and at the same time, the high organic constituents make the fines fraction not suitable for landfilling due to the methane that will be omitted.
In Europe only three categories of waste are allowed to be landfills unless an exception is requested from the authorities, TOC represents criteria among others that the waste must meet to be landfilled.
Inert waste 3% TOC – (§ 23 NFS 2010:4)
Non-Hazardous waste 5% - TOC (§ 29 NFS 2004:10) Hazardous waste 6% TOC – (§ 35 NFS 2010:4) (Naturvårdsverket, 2004b, 2010).
12
4 MATERIAL and METHOD
The decision to choose some methods was dependant on the results of previous methods, e.g.: the separation methods have been chosen after knowing the constituents of the fines fraction, as composting was an option then it was excluded to the fact that the fines fraction have a plastic content of 10% approximately hence the literature review has been affected also. some methods are dependent on the results of previous methods.
4.1 TOC Reduction Methods Study
TOC reduction is achieved either by the (a) alteration of the chemical structure of the organic content to a separable form, mainly the transformation consists of degradation of the organic carbon
to CO2 or any other gaseous or soluble form, and then the separation is done by natural emission
or leaching. Usually, the transformation process is preceded by other aiding process or processes like size reduction to increase the reaction surface. Examples of alteration treatments are aerobic degradation, anaerobic biodegradation, radiation treatment like UV treatment, medium oxidation, heat treatment like pyrolysis, combustion, (Godley et al., 2003; Shammas et al., 2009) Pressurized ozonation (Wang, K. Shammas and Hung, 2019), etc. Or (b) by separation process or processes like manual sorting, screening, and the separation processes are used when it is possible to separate the organic content without transforming it, and in the waste management industry, the cost of the treatment plays a major role in choosing between the two methods. Examples of separation only processes are screening, manual sorting, optical sorting, sieving, leaching, air classification, float/sink separation, electroporation, membrane bioreactors after leaching, attrition scrubbing, etc (Bodzek, Łobos-Moysa, and Zamorowska, 2006; Dermont et al., 2008; Christensen and Biliteewski, 2011; Marklund et al., 2019).
Air classification and float/sink separation have been chosen for this study because it is available at the facility and because is low in cost of operation other treatment methods have been excluded due to cost and unsuitability for example composting has been excluded because of the high content of plastic in the fines fraction that will not be decomposed via aerobic digestion rather it may produce microplastics that may affect echo system, Figure 4 shows an air classification and float/sink machines that are available at the premises in Heljestorp.
13
4.2 Sampling and Testing
Sampling was carried out following EN 14899: 2005, coning and quartering were adopted as it is the most used method of sampling in soil and solid waste (Gy, 2004; Campos-M and Campo-C, 2017).
A minimum of five samples has been taken for tests and analyses, and a minimum of five results from each test or analysis has been used to obtain an average. And that average is what is presented in data tables.
All collected samples have been preserved in a freezer at -4°C from the time of collection with a maximum delay of 10 minutes.
4.3 Material Fractions Description and Characteristics.
The source of the material belongs to the construction and demolition waste category CDW, which consists mainly of brittle materials like concrete & cement, tiles, glass, wooden walls & floors, plastic parts, etc. and this particular fine fraction comes from Norway, the coming material is used as a covering material to the landfills, and has been treated by crushing and sieving to achieve a grain size of <18 mm.
For this purpose, slow-moving cutting and tearing knives that effectively crush the brittle material to a grain size of> 18 mm.
After crushing fed up on a conveyor belt. Above the conveyor belt is a magnetic separator that separates the crushed material of ferrous metals. Metals are collected in a separate container. The conveyor belt then feeds into the crushed material in a drum sieve with an aperture of 18 mm. In the drum screen, the feed is separated to fines fraction extract, coarse fraction extract and rejects the studied material is taken from the fines fraction.
The fines fraction is expected to consist of materials such as tile, concrete, cement, glass, etc., Figure 5 shows the fines fraction complex constituents and constitute 80% of the total. The principle of a drum screen is to create a good circulation of the material by continuously moving waste through the drum rotation. Screening of the fines fraction takes place through the meshes of the basket walls. Figure 3 shows the drum sieve (Trommel screen).
14
Figure 5 shows the complex components of the fine fraction.
4.4 Manual Characterization and Constituents Mapping.
The purpose of the manual sorting is to have an insight into the constituents of the fines fraction to suggest the proper TOC reduction and treatment process.
Three 3000 g samples have been collected separately from three different places from a landfill pile cover after one hour of arrival to the site, five 100 g sample is taken from each 3000 g samples and manually characterized as per the following procedure:
1. The sample was sieved with a 3x2 mm mesh sieve to reduce the unsortable fine powder put with the (other named sorted fraction) and fraction and this will make the bigger pieces clearer to sort.
2. Manually sorted the particles into five distinguished categories they are namely polymers (all organic polymers and polystyrene), lignocellulose (wood, paper, cardboard, etc.), inert excluding (glass, stone, bricks, cement, etc.), glass (only glass colored or clear), insulation (rock wool, glass fiber), and others consist of all the particles less than 3mm in size and the undefined items.
3. Each fraction was weighed separately (undistinguished particles and sieved particles). 4. Each fraction is then put in a sealed container and preserved in a -4 °C freezer.
5. An LOI analysis has been done for the original fins fraction and the others labeled hand-sorted fraction and the result was LOI 36.54% DM for the original fines fraction LOI 32.00% DM.
15
4.5 Density
The density of solids is the ratio of mass over volume 𝜌 = and is expressed in kg/m3.
The density of the samples and process(s) outcomes have been measured using a KERN-EMB 200-3V scale with YDB-01 density kit Figure 6.
Figure 6 KERN EMB 200-3V with YDB-01 density kit scale
(KERN, 2020-09-10)
16
4.5.1 Material Densities Of Potential Materials In C&D Waste
A list of the densities of the common constituents materials of CDW is assembled in Table 2
Material Density (kg/m3)
Wood 352-994
Yard trimmings 940
Paper and cardboard 929 - 1530
Plastics 1100-1700
- Expanded polystyrene (EPS) 20
- Polyethylene and ethylene copolymers 918-940 - ABS 1020-1080 - Acrylic 1170-1200 - Polyamide 1120-1140 - Polycarbonate 1200 - Fluoroplastics 2080-2200 Sand 1441-1681 Textile 1270 Brick-masonry 1650-2309 Stone 1314-2690 Glass 2595 Metals 2700 - 7860
Table 2 lists of densities of potential materials that is can be found in the CDW.
(Avallone, III and Sadegh, 2007; Yesiller et al., 2014; Schouenborg et al., 2015)
4.6 Dry Matter (DM)
Dry matter (DM) is the percentage of the dried sample weight over the original sample weight before drying expressed as a percentage.
The detailed procedure is described in Appendix A.3
4.7 Loss-On-Ignition (LOI)
Loss-On-Ignition (LOI) is the percentage of the difference in the mass of the dry sample and the residues after the thermal oxidation of the sample expressed as a percentage of dry matter.
Loss-On-Ignition (LOI) process is carried immediately after the process of Dry Matter (DM). The detailed procedure is described in Appendix A.4
17
4.8 Total Organic Carbon (TOC)
Total organic carbon (TOC) is the representation of the organic matter in the specimen and it is measured in different methods. in this study, TOC is determined at an accredited laboratory namely (Eurofins Environment testing Sweden AB, Box 737, 531 17 Lidköping) using SS-EN 15936:2012. Mainly this analysis calculates the total organic carbon (TOC) by subtracting the total inorganic carbon (TIC) content from the total carbon (TC) TOC = TC – TIC (Schumacher, 2002).
4.9 LOI For TOC
Several studies had been made to validate the loss on ignition (LOI) measurement to determine total organic carbon TOC, taking into consideration the low cost and ease of conduct of LOI over TOC. Thus more tests can be performed in a much shorter time and with twelfth the cost (De Vos et al., 2005).
Most studies at a simplified form adapted the ratio of LOI/TOC or the TOC/LOI. In the studies of soils, there was a great concern for the presence of clay that can bind to water. clay does not exist in our material thus all clay-related calculations will be excluded. The other concern is the loss of carbon via the release of CO2 from carbonates at temperatures higher than 500°C, and this has been avoided by using furnace degrees less than 500°C (Bojko and Kabała, 2014). Please refer to the LOI test description. Statistical approaches Tukey’s posthoc test, Pearson’s correlation coefficient, regression equations via statistical software have been used to analyze the variances and describe the relations between loss on ignition and total organic carbon.
The studies have divided the results of the relation between LOI and TOC into two main groups, the first main group is the values of the conversion factor for LOI/TOC as 2.0, for values of LOI over 8-10% of the DM. the second main group which is divided into three subgroups the first subgroup if for the values of the conversion factor for LOI/TOC as 3.1, for values of LOI over 4-8 % of the DM. the second subgroup if for the values of the conversion factor for LOI/TOC as 5.0, for values of LOI over 2-4 % of the DM. and third subgroup if for the values of the conversion factor for LOI/TOC as 7.3, for values of LOI over 0-2 % of the DM (Bojko and Kabała, 2014). Although other studies have given higher LOI/TOC at lower LOI values with a conversion factor of 5.8 (Howard and Howard, 1990). a conversion factor of 15.4 (Christensen and Malmros, 1982). nd a conversion factor of >50 at a low LOI/TOC ratio (Szava-Kovats, 2009)
Many papers have not been in favor of the use of LOI as an estimation of TOC (Howard and Howard, 1990) (Bhatti and Bauer, 2002) and others more have favored the use of LOI as an estimation of TOC (Spain et al., 1982; Goldin, 1987; David, 1988; Donkin, 1991; GREWAL, BUCHAN and SHERLOCK, 1991; Konen et al., 2002)The studied fraction in this thesis consists of a fine fraction of the construction demolition industrial sector which does not contain clay and in that case, wouldn’t need to have a clay facto in the conversion equation and thus (De Vos et al.,
18
2005). As such, a conversion factor will be adapted after validating the existing fraction when comparing the LOI values with TOC values analyzed at an accredited laboratory.
Since the debate of LOI as an estimation of TOC is on lower values of LOI mainly >8% taking the lowest conversion factor LOI/TOC of 1.8 that gives a TOC value of 4.44% DM. and in the case of the highest conversion factor LOI/TOC of 50 that gives a TOC value of 0.16 % DM. samples that give values of LOI lower than 8% DM, will be validated with TOC analysis at an accredited laboratory. And since the statutory requirement to landfilling a non-hazardous waste is a TOC content of less than 10%DM § 29-30 NFS 2004: 10, that corresponds to an LOI value of 18%DM. A validation of LOI as an indication of the TOC value for LOI values more than 8% have been made:
Validation process:
Five 1000g different samples from different places have been taken from the fine fraction and every 3 50g samples have been sent to Eurofins laboratories (Eurofins environment testing Sweden AB Box 737 531 17 Lidköping) in an insulated polystyrene box with special ice bags.
Seven LOI analysis inhouse have been done to each of the five samples according to Swedish standard SS02813, and then from the results using linear regression a formula have been calculated using Microsoft Excel 365 2002 regression function results summary are shown in Table 3 and illustrated in Figure 7, resulting from the following formula:
𝒚 = 𝟎. 𝟓𝟗𝟖𝟏𝒙 − 𝟎. 𝟎𝟑𝟖𝟗𝟒 Equation 2 TOC for LOI Regression
Where:
y is the predicted TOC x is the LOI % DM. Slope full value is 0.5981 Intercept full value is -0.03894
19
Sample LOI % DM Av.
Laboratory TOC Av. 1 30.06% 14.50% 2 27.76% 11.80% 3 23.95% 10.27% 4 27.06% 11.50% 5 26.29% 13.27%
Table 3 the values of the average laboratory analyses results and LOI internal analysis results.
Figure 7 the regression relation formula between LOI and TOC.
Full regression statistical report outcomes are available in Appendix A.5Appendix A.5.
y = 0.5984x - 0.0391 10.00% 10.50% 11.00% 11.50% 12.00% 12.50% 13.00% 13.50% 14.00% 14.50% 15.00% 23.50% 24.50% 25.50% 26.50% 27.50% 28.50% 29.50% 30.50% TO C LOI
20
4.10 Separation and Treatment Methods
4.10.1 Solid material separationMaterial separation is to separate mixed materials into two (binary separation) or more fractions (polynary separation) depending on one or more properties of the materials(Worrell and Vesilind, 2012), for example, density, aerodynamic velocity, color, size, shape, etc. the methods for the separations vary from hand sorting, mechanical, electrical, magnetic, optical, chemical, etc. (Wang et al., 2015; Stegmann, 2018) in this thesis only mechanical binary separation concept is considered. In particular, namely air classification and sink float.
Both processes depend on classification which depends on the settling rate, the particles are classified and separated by allowing the particles to settle in a medium usually water or air using the particle properties like shape, size, and density. The heavier, smother, bulkier, and has less surface area particles settle faster than the lighter, rougher, smaller, and have higher surface area settles slower. The laws that model the settling in classifiers are strokes’ law for fine particles >0.053mm, and Newton’s law for particles above 5mm. but in reality, due to the complexity of the process variable, both laws are not applicable either for modeling or for analysis (Boettcher, 1972; Gill, 1991; Worrell and Vesilind, 2012).
Binary Separation
The material to be separated will be referred to as the input stream and it consists of a heterogeneous mixture of multiple materials but will be separated into two output streams that have similar properties, hence the mixture is considered to be composed of A and B and these are to be separated. The feed flow rate in kg/min for the mixture and the amount of the input stream consists
of A0 and B0. The first output stream consists of masses A1and B1 and the second output stream
consists of masses A2 and B2.
In the case of solid material separation generally, the efficiency is measured by the recovery rate as a percentage or by the purity of the extracted material.
The recovery of the output stream is expressed by the following formulas: Separation Process 𝐴 + 𝐵 𝐴 + 𝐵 𝐴 + 𝐵 𝑅𝑒𝑐 = (𝐴 𝐴 )100 𝑅𝑒𝑐 = (𝐵 𝐵 )100
21
Considering that the first output stream contains A as the desired material and the second output stream contains B as the desired material.
And the purity parameters formulas are:
In this thesis since the goal is to reduce TOC by a measure of LOI, then LOI reduction will be the operational parameter of the separation performance (LR).
Where LRP1 and LRP2 are the reduction percentage of P1 and P2 respectively.
And in the case of combining two separation processes it will be as follows:
(Worrell and Vesilind, 2012)
𝑃𝑢𝑟 = ( 𝐴 𝐴 + 𝐵 )100 𝑃𝑢𝑟 = ( 𝐵 𝐴 + 𝐵 )100 Separation Process 𝑀 𝑃 𝑃 𝐿𝑅 = (𝐿 𝐿 )100 𝐿𝑅 = (𝐿 𝐿 )100 Separation Process 1 𝑀 𝑃 𝑃 Separation Process 2 𝑃 𝑃 𝐿𝑅 = (𝐿 𝐿 )100 𝐿𝑅 = (𝐿 𝐿 )100
22
4.10.2 Heavy-media separation (Fluid float/sink separation)
The process of heavy-media separation is part of the float-sink separation methods using liquid (water) as the media. A lot of factors play a critical roll in the process complexity, especially the heterogeneous nature of the feed fraction (size, shape, hydro velocity, density, porosity, wettability, etc), type of liquid media (viscosity, temperature, flow, density, contaminations build-up, etc), the different forces, settling time, and turbulences of the liquid media(Christensen, 2011).
This process as discussed before is governed by the newton and stroke laws to define the settling velocity as any particle sinking by in a fluid media changes start to accelerate until it reaches its terminal velocity, and this is achieved when the three main forces bouyant, gravity, and drag forces are in equilibrium bouyant equals the drag and gravity force (Worrell and Vesilind, 2012).
Newton’s law states that acceleration of the particle is equal to the forces divided by its mass 𝑑𝑣
𝑑𝑡 = (𝐹 − 𝐹 )
1 ρ 𝑉 Where:
dv/dt is Particle acceleration (m/sec2)
ρs is particle density (kg/m3)
V is the volume of the particle (m3)
And strokes law is
𝑣 =𝑑 𝑔(𝜌 − 𝜌)
18𝜇 Where:
v is Particle settling velocity (m/sec) d is the particle diameter (m)
g is gravitational acceleration (m/sec2)
ρs is particle density (kg/m3)
ρ is fluid density (kg/m3)
µ is the fluid viscosity (kg/sec-m)
The best results are obtained by having a big difference between the different particles settling velocities, strokes law formula shows that the settling velocity is affected by the particle diameter (d) due to the exponential effect of the parameter assuming that the particles have spherical shapes, hence the heterogeneous nature of the shredded waste makes it difficult to calculate and define the behavior of the process. Taking into consideration the variations of the parameters and the fact that Newton’s and Strokes laws for ideal parameters and process where Newton’s law is for a single
23
particle, and that these laws do not consider the interactions that happen between the particles themselves.
Considering only the density of the particles and when simplifying the Strokes law depending only on the density it gives:
𝑣 ∝ (𝜌 − 𝜌)𝑑 Where:
v is Particle terminal settling velocity (m/sec) d is the particle diameter (m)
g is gravitational acceleration (m/sec2)
ρs is particle density (kg/m3)
ρ is fluid density (kg/m3)
(Worrell and Vesilind, 2012)
Due to economic reasons, only continuous processes are recommended in the field, but in this study, a simple batch process has been chosen as illustrated in Figure 8 to minimize the complexity of the process, where only density differences between the two outcome fractions, less than the liquid media density, and greater than the liquid media density. And a settling time of 24 hours has been chosen to eliminate the time factor.
Figure 8 Design of the float/sink batch container
4.10.3 Air Classification
Air classification is a type of sink/float separator of solid materials that takes advantage of the differences in the density, aerodynamic properties, and size (Shapiro and Galperin, 2005) of the
Less than 1g/cm3 density fraction
Greater than 1g/cm3 density
fraction
24
components of the mixed particles using air as the fluid medium. It utilizes the air stream to separate and carry the light-dense particles and leaving the heavy-dense particles to fall.
The air source can be either blowing or suction (pushed or pulled).
Several factors play a role in the efficiency of the process among those is the type of feed material the drier the particles the better, and if the particles have less tendency to adhere to each other the better, air turbulence and particle collisions can contribute to the congestion and less purity of the outcomes on the other hand air turbulence and vortices can contribute to the separation of agglomerated particles.
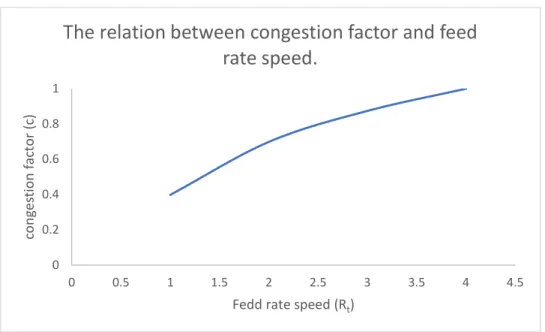
aerodynamics velocity makes it possible to estimate the process effectiveness of air classification and this can be controlled by the air velocity, particle sizes, and feed rate the higher the feed rate the lower separation efficiency due to congestion, and the lower the speed rate the higher the separation efficiency (Afl et al., 1977; Gill, 1991; Worrell and Vesilind, 2012).
The equation that illustrates the relation between the feed rate Fr and the efficiency of the system
is expressed by c the congestion factor is as follows see Figure 9:
𝑅 = 𝑉
𝐹 Where:
Rt is the average residence time of the falling particles.
V is the volume of the entrance. Fr is the feed rate.
C is the congestion factor. (Afl et al., 1977)
Considering the only two variables are Fr and c.
25
Figure 9 showing a positive direct relation between congestion factor and feed rate speed
From the above chart, we find out that the higher the feed rate speed the higher congestion resulting in a less efficient operation.
In some mixture it is hard and unfeasible to control the particle size, thus this variable is either neglected or considered fixed. Mainly the aerodynamic velocity is determined by a free drop test
vfd for the different particles and in the absence of a free drop test the particles terminal velocity is
calculated according to the following formula:
vfd= 1.9 + 0.092ρ+ 5.8A.
Where:
vfd is the particle's terminal velocity.
ρ is the particle's density.
A is the particle area.
This formula is used for particles in the range of 0.4 to 6.4516 cm2. And our fractions particles fall
into this range.
Due to the heterogeneous nature of the particles the area function is eliminated (Saitoh, Nagano and Izumi, 1976) which will result in an accepted inaccuracy in the results. And thus the formula will be
vfd= 1.9 1ρ0.5
in this model, the particle terminal velocity will be affected only by the density of the particles. (Worrell and Vesilind, 2012)
0 0.2 0.4 0.6 0.8 1 0 0.5 1 1.5 2 2.5 3 3.5 4 4.5 co ng es tio n fa ct or (c )
Fedd rate speed (Rt)
The relation between congestion factor and feed
rate speed.
26 Types of air classifiers:
Air classifiers may by design to Counterflow classifiers with vertical (rising) flows, Crossflow classifiers with the horizontal air stream, Cascade air classifiers, Fluidized bed classifiers, Inertial air classifiers, Centrifugal air classifiers, Vortex air classifiers, Gravitational–centrifugal air classifiers, Rotor classifiers, and Circulating air classifiers. (Shapiro and Galperin, 2005)
Laboratory air classification:
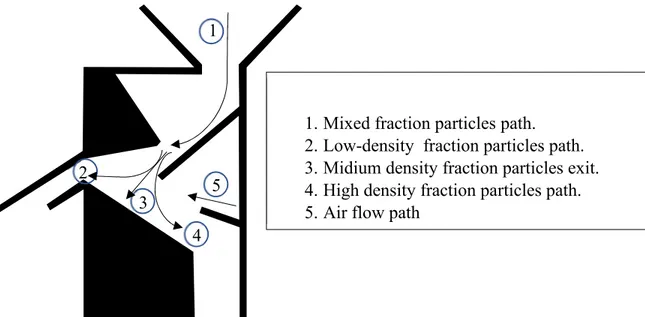
A zigzag cascaded type has been chosen with a transparent facade for easy to build monitoring and modification. The chosen design is shown in Figure 10.
Figure 10 cross-section diagram for the air classification used at the laboratory showing the sample and it’s fractions paths
A cardboard model has been used at first to test the functionality of the air classification then the laboratory model was built using plywood and a plexiglass facade as shown in Figure 11
Detailed design and shop drawings of the used laboratory air classifier are in Appendix A.7 2 1 3 4 5
1. Mixed fraction particles path. 2. Low-density fraction particles path. 3. Midium density fraction particles exit. 4. High density fraction particles path. 5. Air flow path
Figure 11 Left the cardboard model, middle the plywood model during assembly, right the final laboratory classifier model at use.
27
4.11 After Treatment Methods
The methods that have been chosen are dependent on the manual sorting, experiment results, end cost hence biological treatment like anaerobic and aerobic digestion has been excluded due to the high content of plastic in the high organic content fraction as a high content of plastics will remain in the residues of the process that have to further be treated most probably in incineration treatment (Wang, K. Shammas and Hung, 2019), Near-infrared reflectance spectroscopy separation to separate glass from other low organic content fraction treatment or the separation of and classification of plastic (Masoumi, Safavi and Khani, 2012) in the high organic content fraction due to high cost of.
4.11.1 Reuse
It is required by all EU members the action plan in the EU to establish a sustainable and a circular economy, and one of the requirements is to preserve and maintain the primary sources (European Union, 2015) and to find an economic useful value to the what is considered residues of the processes rather than waste (Taherzadeh and Richards, 2015).
By reducing the organic content of some fraction like in the studied case above the residues of the construction and demolition fines fraction, the residues with very low TOC which mainly consists of extracted concrete, stone, brick, etc. can be used as ballast in road construction (Naturvårdverket, 2005), or for example can be used as a filler in the concrete, etc.
4.11.2 Incineration
The incineration of waste as a waste to energy (WtE) has increased since the last decade is mainly due to the landfill bans, taxation of landfilling the goals set for a circular society (Naturvårdsverket, 2004a, 2015b; Naturvårdverket, 2005; European Union, 2008, 2015), etc. Efficient energy recovery is considered recycling (European Parliament and Council, 2008). Due to the high demand for heating and electrical energy in Sweden over 90% of energy is recovered (Naturvårdverket, 2005). There are two common types of incineration plants in Sweden, the grated bed and fluidized bed boilers (Taherzadeh and Richards, 2015).
A study by Serbanescu et al., (2017) study shows a positive relation between TOC% DM and LHV kcal/kg, by studying air-dried dehydrated sludge from municipal wastewater treatment plant the equation found was:
𝑳𝑯𝑽 = 𝟗𝟔. 𝟐 ∗ 𝑻𝑶𝑪 + 𝟓𝟑. 𝟕𝟑𝟔 kcal/kg Equation 3
R2 = 0,9473
This can be used as an indication for the suitability for energy recovery by incineration boilers before doing further analyses as per the requirements of the boiler o be sent to.
For example, the Uddevalla Kraft AB which runs a grating boiler requires an energy content of 7.5 - 15 MJ/kg in each delivery. And Borlänge Energi runs a fluidized bed that requires an energy content of 2.5 – 4 M Wh/ton in each delivery, and Samocha and Prangnell, (2019) illustrate that MSW is suitable for incineration with volatiles content ranging from almost 20 – 50%.
28 4.11.3 Landfilling
The Swedish management system has played a major role in reducing landfilling (Taherzadeh and Richards, 2015). Construction and demolition landfilled quantities has fallen from 900,000 tonnes in 1994 to 370,000 tonnes in 2003 (Naturvårdverket, 2005). Waste that is not allowed for landfilling will be pre-treated before further processing or sent to recycling for the end of life (Naturvårdverket, 2005). Only three types of waste are allowed in Sweden they are inert waste, non-hazardous waste, and hazardous waste Each type has to meet strict criteria before it is allowed to be landfilled (Naturvårdsverket, 2004b, 2010).
29
5 RESULTS
The purpose of this study is to reduce the organic content measured in the loss on ignition as a representation of total organic carbon TOC by mechanically treating the selected fines fraction and to understand the fraction better and define its content. A manual characterization and constituents mapping test has been carried out and the results are presented in section 5.1, the results of the treatment processes to reduce the total organic carbon are presented in sections 5.2, 5.3, 5.4, and 5.5
5.1 Manual Characterization and Constituents Mapping.
The process in this experiment is according to the method sections:4.2 Sampling and Testing, 4.5 Density, 4.6 Dry Matter (DM), 4.7 Loss-On-Ignition (LOI), and 4.8 Total Organic Carbon (TOC)
It aims to understand the constituents of the different components of the waste fines fraction to determine the appropriate method of treatment.
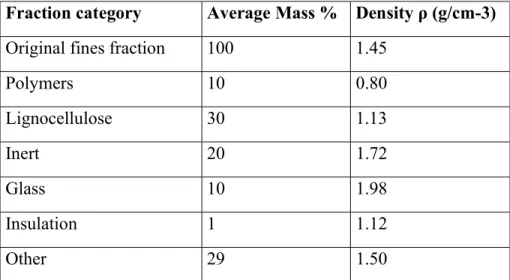
Table 4 and Figure 12 shows the weight percentage and density of the five different manually sorted fractions.
Fraction category Average Mass % Density ρ (g/cm-3)
Original fines fraction 100 1.45
Polymers 10 0.80 Lignocellulose 30 1.13 Inert 20 1.72 Glass 10 1.98 Insulation 1 1.12 Other 29 1.50
30
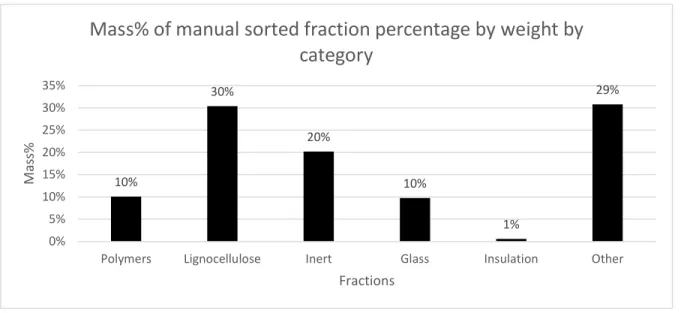
Figure 12 results of manually sorted fraction percentage by weight by category Showing that approximately 10% of the fraction consists of plastic constituents, which will affect the selection of the suitable treatment methods, the high organic contents are present in three categories (Polymers, Lignocellulose, and Other).
A LOI% DM analysis of the other fraction has been done to and the result was 32,01% DM showing that the other fraction has a great amount of organic content.
Figure 13 shows the photos of the five manually sorted fractions.
Detailed tables and figures of the manually sorted fractions are available in annex-B.
5.2 Air Classification – A Single Process.
The process in this experiment is according to the following previous method sections:
4.2 Sampling and Testing, 4.5 Density, 4.6 Dry Matter (DM), 4.7 Loss-On-Ignition (LOI), 4.8 Total Organic Carbon (TOC), 0 Binary Separation, and 4.10.3 Air Classification. It aims to experiment and understand the single separation process of air classification and the process parameters.
A separation experiment has been made using the designed air classifier as shown in Figure 10 with three air velocities that have been chosen they are air velocity of 5 m/s as the minimum feasible air velocity based on the outcome that showed a significant difference in the light fraction and heavy fraction, air velocity of 10 m/s as a mid-range air velocity between the minimum chosen
10% 30% 20% 10% 1% 29% 0% 5% 10% 15% 20% 25% 30% 35%
Polymers Lignocellulose Inert Glass Insulation Other
M
as
s%
Fractions
Mass% of manual sorted fraction percentage by weight by
category
31
velocity and the maximum stable velocity, and the maximum stable velocity of 13.8 m/s. the used air source is taken from the facility compressed air grid. With each velocity 10 samples of 1000 grams have been fed to the classifier with a total sample of 30 samples at a steady feeding speed rate of 333 g/min or feeding 1000 grams of the fine fraction in a period of 3 minutes. The process has been run as a batch process. The air temperature was 19.2 °C.
Then from each velocity outcome, six samples have been taken and an LOI analysis has been carried out to study the relationship between the velocity and analyzed LOI.
Table 5 shows the results of the average mass percentages of each 10 samples per velocity. Air velocity (m/s) High-density fraction light density fraction Loss 5 89.03% 8.01% 2.96% 10 51.21% 43.58% 5.22% 13.8 19.49% 62.84% 17.67%
Table 5 the average mass results of the air classification experiment showing the high density, low-density, and loss fractions.
Figure 14 shows the linear relation between the velocity and high-density mass average, Figure 15 shows the linear relation between the velocity and light density mass average, and shows the polynomial relationship between the velocity and lost fraction mass average which reflects the complexity of that relationship. Table 6 shows the results of measuring the density of the different outcomes of the air classification single process.