Are Driving and Overtaking on Right Curves
More Dangerous than on Left Curves?
Sarbaz Othman, MSc
Department of Applied Mechanics, Chalmers University of Technology, Gothenburg, Sweden
Robert Thomson, PhD
Swedish National Road and Transport Research Institute, Gothenburg, Sweden
Gunnar Lannér, MSc
Department of Civil and Environmental Engineering, Chalmers University of Technology, Gothenburg, Sweden
__________________________________
ABSTRACT – It is well known that crashes on horizontal curves are a cause for concern in all countries due to the frequency and severity of crashes at curves compared to road tangents. A recent study of crashes in western Sweden reported a higher rate of crashes in right curves than left curves. To further understand this result, this paper reports the results of novel analyses of the responses of vehicles and drivers during negotiating and overtaking maneuvers on curves for right hand traffic. The overall objectives of the study were to find road parameters for curves that affect vehicle dynamic responses, to analyze these responses during overtaking maneuvers on curves, and to link the results with driver behavior for different curve directions. The studied road features were speed, super-elevation, radius and friction including their interactions, while the analyzed vehicle dynamic factors were lateral acceleration and yaw angular velocity. A simulation program, PC-Crash, has been used to simulate road parameters and vehicle response interaction in curves. Overtaking maneuvers have been simulated for all road feature combinations in a total of 108 runs. Analysis of variances (ANOVA) was performed, using two sided randomized block design, to find differences in vehicle responses for the curve parameters. To study driver response, a field test using an instrumented vehicle and 32 participants was reviewed as it contained longitudinal speed and acceleration data for analysis. The simulation results showed that road features affect overtaking performance in right and left curves differently. Overtaking on right curves was sensitive to radius and the interaction of radius with road condition; while overtaking on left curves was more sensitive to super-elevation. Comparisons of lateral acceleration and yaw angular velocity during these maneuvers showed different vehicle response configurations depending on curve direction and maneuver path. The field test experiments also showed that drivers behave differently depending on the curve direction where both speed and acceleration were higher on right than left curves. The implication of this study is that curve direction should be taken into consideration to a greater extent when designing and redesigning curves. It appears that the driver and the vehicle are influenced by different infrastructure factors depending on the curve direction. In addition, the results suggest that the vehicle dynamics response alone cannot explain the higher crash risk in right curves. Further studies of the links between driver, vehicle, and highway characteristics are needed, such as naturalistic driving studies, to identify the key safety indicators for highway safety.
__________________________________ INTRODUCTION
An analysis of highway safety was conducted in the western region of Sweden [Othman, 2009] by integrating crash and maintenance data for 3000 crashes. The combination of data sources allowed for more insightful analyses than would be possible with only crash data normally reported to the police. In particular, the analysis of crash type and infrastructure characteristics is an important added value. Further analysis of the crash types highlighted
the differences between run-off-road crashes and lane changing (overtaking) crashes. In particular, distributions of crashes with respect to curve direction were of interest and an area for further collaborative research with human factors and vehicle dynamics researchers.
The analysis [Othman, 2009] showed that overtaking crashes are more frequent in right curves compared with left curves. A further investigation to analyze
vehicle/road interaction as well as human behavior in curves was therefore of interest. Safe tracking of a vehicle along a curve at relatively high speed requires greater attention by drivers than when driving along a straight section of a roadway. Subsequently, the demands on the driver to stay safely within the road boundaries are amplified if there is a lane changing maneuver in the curve. Driving challenges presented to the driver are greater when there is inconsistency and lack of predictability in the road alignment ahead. Moreover, the effects of inconsistency are of greater concern when curves are severe [Oxley, 2003]. Curves induce lateral acceleration and higher crash rates are expected when vehicles experience higher lateral accelerations [Leonard, 1994].
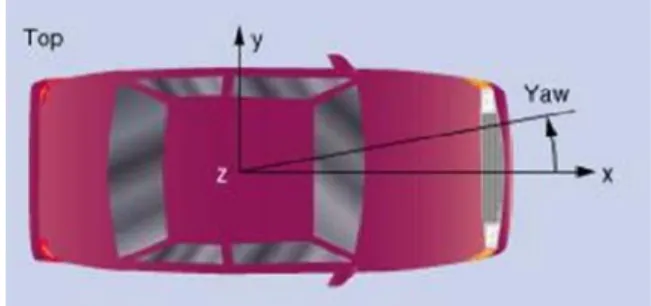
The handling characteristics of a road vehicle determine its response to steering commands and to environmental inputs, such as road parameters, that affect its direction of motion. There are two basic issues in vehicle handling: one is the control of direction of motion of the vehicle; the other is the vehicle’s ability to stabilize its direction of motion against external disturbances [Wong, 2001]. During turning maneuvers, the steer angle from the driver can be considered as an input to the vehicle system and the motion variables of the vehicle such as lateral acceleration and yaw velocity may be regarded as outputs. Thus, lateral acceleration (directed along the vehicle’s y axis, Figure 1) and yaw angular velocity (rotational velocity about the vehicle’s z axis, Figure 1) have been used in this study for comparing the response characteristics of different values of speed, road-condition, super-elevation and radius in left and right curve directions during turning (overtaking).
Figure 1- Yaw Angular Velocity OBJECTIVES OF THE STUDY
The goals of this study were to find road geometry parameters that affect the stability of vehicles during negotiating curves and to analyze vehicle dynamics parameters (lateral acceleration and yaw angular velocity) when driving through right and left curves. The last goal was to identify connections between road parameters and vehicle responses with the
driver’s behavior in different curve directions focusing on longitudinal speed and acceleration. PREVIOUS STUDIES
There are many studies investigating crash types and safety-related features in curves. However, there are limited studies that distinguish between right and left curves when investigating crashes. In particular, the authors of this study could not find any studies investigating overtaking maneuver behavior in left and right curves. The nearest investigations are two undated citations by Taylor et al. and Stimpson et al. cited in two studies [Krammes, 1993; Steyer, 2006] which state that one of the operating measures identified as a contributing factor to crash risk on horizontal curves is vehicle lateral placement. Lateral placement is defined as the lateral position of vehicles in the original travel lane. This indicates how good is the driver in keeping the vehicle between lane boundaries during negotiating curves. According to Miller [Miller, 1982] it is a function of vehicle size, lane width and lane type. Steyer [Steyer, 2006] also investigated lateral placement, though not the overtaking maneuver, between right and left curves. The study noted that one of the important safety-related features in curve negotiation is vehicle lateral placement. It also states that the driving path should be considered when investigating crashes on curves. Moreover, the study makes a distinction between right and left curves and offers some suggestions as to why centre-line encroachments occur. Centre-line encroachments on curves to the driver’s near-side (that is, left curves in right hand traffic and right curves in left hand traffic) may be considered ‘controlled’ or ‘intentional’ encroachments where some drivers intentionally ‘cut the corner’ or ‘straighten the curve’ when it is possible to be done safely. The study argues that these types of encroachments are mainly associated with the radius of the curve, curve length, grade and available sight distance. Centre-line encroachments on curves on the driver’s far-side (that is right curves in right hand traffic and vice versa) may be due to speed and a tendency for drivers to steer away from roadside hazards [Steyer, 2006]. An analysis in France highlighted some infrastructure characteristics, for all type of roads, which increase the risk of severe crashes involving a heavy goods vehicle (HGV). The results showed twice as many HGV crashes on right-hand curves than on left-hand curves (25% and 13% respectively) when two vehicles are involved [Gothié, 2008].
As it has been mentioned earlier, research on overtaking crashes is comparatively rare, despite the frequency and severity of these types of crashes. Clarke, Ward and Jones [Clarke, 1998] reported that
overtaking crashes accounted for eight percent of fatal crashes on rural roads in Nottinghamshire, England and that their crash severity index (the proportion of cases resulting in death or serious injury) was over twenty percent. In Australia, Armour [Armour, 1984] found that overtaking accounts for about ten percent of rural casualty crashes. In a study of separated roads in Sweden [Othman, 2009], overtaking crashes represented eight percent of 3000 investigated crashes. Another study in Denmark [Nielsen, 2000] identified the overtaking maneuver as a major cause of head-on collisions with severe consequences. Other studies found that the rate of overtaking crashes is related to the provision and geometric design of passing lanes according to Hughes [Hughes, 1992] and Polus [Polus, 2000]. From the review of the limited studies available for overtaking crashes which distinguish between left and right curves, there is a lack of investigations that link vehicle dynamics, road geometry and driver behavior when addressing road safety. Thus, a focus of this study is on infrastructure features and driver behavior in curves that can fundamentally affect vehicle dynamics during negotiating and overtaking in right and left curves.
METHODOLOGY
The aim of this study was to find road geometry parameters that affect vehicle stability when driving through curves. The approach was to use numerical simulation of vehicle maneuvers in different curves using a controlled parametric study. The results were compared to previously derived results from crash analyses and volunteer driving studies. These results could then be used to study the parameters producing different effects for different curve directions and could be further linked to human behavior while negotiating curves. Driver behavior information was obtained from a field test study [Alonso, 2007]. The field test was conducted in parallel to the accident analysis study [Othman, 2009] by a collaborative partner in a European project called RANKERS (RANKing for European Road Safety) [RANKERS, 2007].
Vehicle Dynamics Simulation
A vehicle dynamic simulation program was needed that could capture the dynamic response of a vehicle using the travel speed and steering angle as inputs. The program should also be able to model road geometry features that affect vehicle dynamic responses. The desired outputs of the model were lateral acceleration and yaw angular velocity which should indicate the stability of the vehicle. The desired outputs can be achieved using a simple vehicle model, the “bicycle model”, with 3 degrees of
freedom [Wong, 2001] or a more complicated system modeling more mechanical components with many more degrees of freedom.
PC-Crash [Datentechnik, 2007], initially developed for the simulation of motor vehicle crashes, was selected for the simulations. PC-Crash can configure a vehicle model based on the data from the vehicle manufacturer (and user) and provides the facilities to define a road section according to the user’s specifications. The simulation runs can be configured to drive the vehicle along a predefined path and record the dynamic responses. PC-Crash has been tested and validated for professional traffic accident reconstruction [Moser, 1999]. Validation of the vehicle dynamics model in PC-Crash is demonstrated in a study testing extreme turning conditions (vehicle yaw) in order to examine the accuracy of the computer simulation [Cliff, 2004]. The yaw maneuvers in [Cliff 2004] were more severe than the simulations anticipated for this study.
A SEAT León passenger car has been used in the PC-Crash simulations to be consistent with the instrumented vehicle used in the field study. It should be noted that the goal of the simulations was to compare a vehicle’s response in left and right curves under similar conditions and not the detailed simulation of a specific vehicle model.
Lane Changing Maneuver
The crash analysis conducted earlier [Othman 2009] has identified overtaking as one of the collision types in curves. It was important to choose a relatively severe maneuver to identify any vehicle stability issues. It was also critical to have a repeatable test method that can be used to compare vehicle performance in different curves.
A severe double lane-change maneuver has been chosen for the evaluation of vehicle dynamics in the simulations to represent conditions leading to overtaking crashes found in [Othman 2009]. The maneuver consists of rapidly driving a vehicle from its initial lane to a parallel lane, and returning to the initial lane, without exceeding lane boundaries. Track dimensions of the double lane-change are according to ISO 3888 specification [ISO, 1999]. The total length of the maneuver was 125 m. The maneuver was modified to curves as it was originally described for straight line operation.
Experimental Design for PC-Crash Simulation Based on the prioritization of a study’s objectives, experimental design guides the selection of the test parameters. The main functions of the experimental design in this study were to define a model for the
effects of road features on vehicle dynamic responses and to determine differences in vehicle dynamic responses between left and right curves.
Before running the simulations in PC-Crash, factors of interest needed to be identified to determine how the runs should be conducted. Four factors that most likely affect lateral acceleration and yaw angular velocity during overtaking have been chosen. Three of the factors (speed, super elevation, radius) have three levels – or values - and the remaining factor, road condition (or friction), two levels. Table 1 shows these factors, their levels and chosen codes. Table 1. Factors that may Affect Lateral Acceleration
and Yaw Angular Velocity
Different levels for each factor will have a great effect on the vehicle’s lateral acceleration/yaw angular velocity. For example, it is clear that there are large differences in lateral acceleration when driving at 70 or 110 km/h. These differences are not interesting for the comparison and should be eliminated from the study. Therefore a two sided randomized block design has been chosen to reduce (or eliminate) these effects [Box, 2005]. Left and right curves were one side of the design, while runs within each curve type were defined as the other side of the design (i.e. blocks). The runs within each curve were made randomly in order to reduce/eliminate block differences. A full run for all factors was calculated to consist of 3×3×3×2=54 for one curve direction (i.e. a total of 108 runs were conducted for both left and right curves).
Field Test
The field test experiment was conducted by a partner in the European Project called RANKERS. The field tests focused on road-driver interaction and its impact on road infrastructure design, particularly addressing road layout influence on driver behavior [Alonso, 2007]. The field studies of real traffic driving situations were performed on the AP-66 motorway of the Spanish road network. In the tests, an instrumented vehicle (SEAT León) and a set of drivers was used. The sample of thirty-two licensed
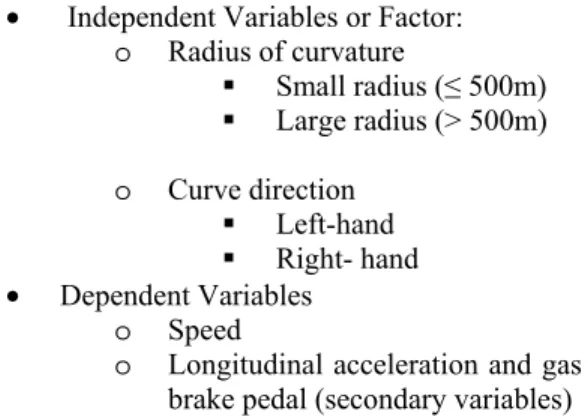
drivers, from age 21 to 57 years old, was recruited as experimental subjects. Driver characteristics were equally distributed between the variables: gender, experience, and familiarity with the road. Special attention was made on the selection of appropriate road locations where analysis of the driver-infrastructure interaction could be carried out. The following list of variables defined the experimental design for the field test:
• Independent Variables or Factor: o Radius of curvature Small radius (≤ 500m) Large radius (> 500m) o Curve direction Left-hand Right- hand • Dependent Variables o Speed
o Longitudinal acceleration and gas / brake pedal (secondary variables) ANALYSIS
The analysis of the simulation output was divided into two parts. The first part investigates and identifies parameters which have a significant effect on the lateral acceleration and yaw angular velocity during overtaking on curves. The second part analyzed differences of lateral acceleration/yaw angular velocity between driving on right and left curves. The field test has been used to link the simulations to human behavior in curves.
Part I: Finding Road Parameters
The starting point in this part of the analysis was to find a model for the chosen factors. The model is shown in Equation 1 and, apart from effect of the mean of factors (b0), includes effects of each factor
and any first order interaction between them. Moreover the model considers second order interactions of speed, x1, and super elevation, x2.
The model, as shown in equation 1, considers a total of 13 parameters, one from the mean, four from the factors alone, six from first order interaction and two from second order interaction.
4 2 2 0 11 1 22 2 1 (1) i i ij i j i i j y b b x b x b x b x x = ≠ = +
∑
+ + +∑
Where: x1 = speed x2 = super elevation x3 = curve radius x4 = road conditionFactor Levels Value Code
Speed [km/h] 3 (70, 90, 110) (-1, 0, 1)
Super elevation [%] 3 (5.5, 2.5, -2.5) (-1, 0, 1)
Curve radius [m] 3 (300, 600, 800) (-1, 0, 1)
Road condition [μ] 2 wet [μ=0.5]
b = coefficient of the factors in the model (to be determined)
To estimate the coefficients of the factors in the model in equation 1, bi, the inverse of the system of
equations
(
y
=
Ab
)
has been applied, using the design matrix in the appendix as the coefficient matrix, A, and using the simulation output, lateral acceleration, as the outcome, y, from the model. Since the system of equations is overestimated (i.e. 54 equations to find 13 parameters) a least square approximation has been used to find the unknowns, which is the best solution for the mean of the system The next step was to find and check the significance of the factors (95% confidence interval) by finding the variance (equations 3, 4 & 5).2 ( i) i i ( 3 ) V a r b = σ ⋅C Where: 54 2 2 1 1 ˆ ( ) (4) ( ) (5) i R R T y y MS DoF C X X σ = − − = = =
∑
MSR is mean of squaresŷ is the grand average.
DoFR is degrees of freedom of the residual vector =
54 – 13 = 41.
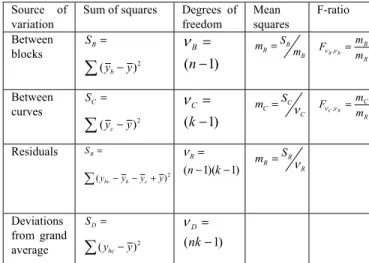
Part II: Analyzing Vehicle Dynamic Responses In order to analyze vehicle dynamic responses and see if there is any evidence for significant differences between different curve directions and blocks, respectively, an analysis of variances was performed. The calculations are presented in Table 2. It was assumed that the block and curve affects were additive (i.e. no interaction between blocks and curves) and the errors were Normally, Independently, and Identically Distributed (NIID).
Table 2- Equations used in ANOVA-Table where “n” is number of blocks or runs (54 runs) and “k” is
number of curve directions = 2 Part III: Field Test
Two statistical analysis techniques were used with the data collected in the field studies. The first one was the Analysis of Covariance (ANCOVA) to know how the radius of curvature influences speed. The second was a Factorial Multivariate Analysis of Covariance (MANCOVA) to determine how curvature direction and radius of curvature could influence speed, longitudinal acceleration, accelerator and brake pedal use when driving along the curves. Prior to the actual execution of the statistical study, a pretreatment of the registered data was necessary in order to prepare and organize the variables for analysis. Each curve was divided into 9 sections and was also given a curve identifier representing the number of the curve under the study [Alonso, 2007]. RESULTS
The main goals of the simulations were to define road features affecting vehicle dynamic responses and determine differences in the responses corresponding to curve directions. The results are presented separately for lateral acceleration and yaw angular velocity. The last subsection shows results from the field test review.
The vehicle dynamic responses differed along the curve for left and right curves when overtaking maneuvers were introduced. On left curves there were three, equally high, peaks at the beginning, middle and the end of the curves. On right curves there was one high peak in the middle with two small peaks at the ends. Figures 2 and 3 show lateral accelerations and yaw angular velocities for overtaking on curves with radius of 500 m, super elevation equal to 3%, and a travel speed of 70 km/h. The first peak (before 20 m in all cases) is when the vehicle starts to leave the initial lane and when the vehicle crosses the lane boundary the values approach zero. The second peak coincides with the start of steering back to the initial lane. Again, crossing the lane boundary is associated with the curves approaching zero values. Finally the third peaks arise when the driver straightens out the vehicle when returning to the initial lane after completing the maneuver. In the following subsections only the absolute maximum values of the lateral accelerations and yaw angular velocities are plotted and compared in detail. The maximum value is the closest value to the grip margin [Klomp, 2007] when loss of control is expected, regardless of when the maximum value is found during the maneuver. However, the responses of the vehicle along the
Source of variation
Sum of squares Degrees of freedom Mean squares F-ratio Between blocks
∑
− = 2 ) (y y S b B ) 1 ( − = n B ν B B B m S m = R B m m Fν ,BνR= Between curves∑
− = 2 ) (y y S c C ) 1 ( − = k C ν C C C S m = ν R C m m Fν ,CνR= Residuals ∑ − − + = 2 ) (y y y y S c b bc R ) 1 )( 1 ( − − = k n R ν R R R S m = ν Deviations from grand average ∑ − = 2 ) (y y S bc D ) 1 ( − = nk D νcurve will be also explained and compared between curve directions in the discussion section.
0 20 40 60 80 100 120 -0.5 -0.4 -0.3 -0.2 -0.1 0 0.1 0.2 Curve length [m] Y aw angul ar v el oc ity [ rad/ s]
Yaw angular velocity during ovetaking on a right curve
0 20 40 60 80 100 120 -5 -4 -3 -2 -1 0
1 Lateral acceleration during overtaking on a right curve
Curve length [m] Lat er al a cc el er at ion[ m /s /s ]
Figure 2- Lateral Acceleration and Yaw Angular Velocity on right curves [Radius = 500 m, Speed = 70 km/h] 0 20 40 60 80 100 120 140 -3 -2 -1 0 1 2 3 4 Curve legnth [m] Lat er al ac ce le ra tion [ m /s /s ]
Lateral acceleration during overtaking on a left curve
0 20 40 60 80 100 120 140 -0.2 -0.1 0 0.1 0.2 0.3 0.4 Curve length [m] Y aw A ng ul ar v el oc ity [r ad /s ]
Yaw angular veloctiy during overtaking on a left curve
Figure 3- Lateral Acceleration and Yaw Angular Velocity on left curves [Radius = 500 m, Speed = 70 km/h]
Lateral Acceleration
The acquired variance results from Equation 4 that have been estimated for absolute maximum lateral acceleration were 0.0945 and 0.1978 which were Estimated Pooled Variances for right and left curves respectively. They are used for calculation purposes and the remaining estimations for right and left curves are shown in Tables 3 and 4 and illustrated in Figure 4.
The parameters b1, b2, b3 and b4 represent confidence intervals of the factors speed, super
elevation, curve radius and road condition, respectively, and the remaining coefficients are the first order interaction between the factors (e.g. b12 is the speed – super elevation interaction and b11 is second order interaction of the speed). The parameter, b0 is the effect due to the mean of all factors and is not of interest when studying the influence of individual parameters.
Table 3 Parameter Estimation for Right Curves, with b, the Variance of b, and the Upper and Lower Bounds of a 95% Confidence Interval
Right B Var(b) Upper Lower
b0 4,87 0,0088 5,06 4,69 b1 1,57 0,0026 1,67 1,47 b2 -0,06 0,0026 0,04 -0,16 b3 -0,44 0,0026 -0,34 -0,54 b4 0,24 0,0018 0,32 0,16 b11 -0,10 0,0079 0,08 -0,27 b12 -0,11 0,0039 0,01 -0,23 b13 0,03 0,0039 0,15 -0,10 b14 0,36 0,0026 0,46 0,26 b22 -0,06 0,0079 0,11 -0,24 b23 0,04 0,0039 0,16 -0,09 b24 0,08 0,0026 0,18 -0,02 b34 -0,13 0,0026 -0,03 -0,23
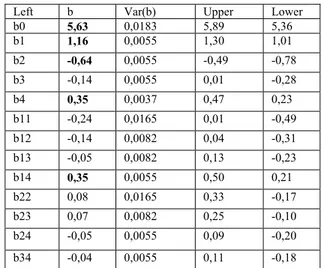
Table 4- Parameter Estimation for Left Curves, with b, the Variance of b, and the Upper and Lower
Bounds of a 95% Confidence Interval
Left b Var(b) Upper Lower
b0 5,63 0,0183 5,89 5,36 b1 1,16 0,0055 1,30 1,01 b2 -0,64 0,0055 -0,49 -0,78 b3 -0,14 0,0055 0,01 -0,28 b4 0,35 0,0037 0,47 0,23 b11 -0,24 0,0165 0,01 -0,49 b12 -0,14 0,0082 0,04 -0,31 b13 -0,05 0,0082 0,13 -0,23 b14 0,35 0,0055 0,50 0,21 b22 0,08 0,0165 0,33 -0,17 b23 0,07 0,0082 0,25 -0,10 b24 -0,05 0,0055 0,09 -0,20 b34 -0,04 0,0055 0,11 -0,18
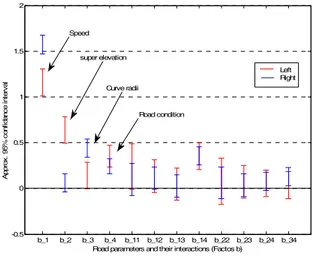
The estimates of the factors and their associated confidence limits are shown in Tables 3 and 4; the factors which have a significant effect on the output are in bold text. If the confidence interval does not span the zero line, the factor is significant. These intervals are presented graphically in the error plot (Figure 4). The single factors affecting lateral
acceleration in right curves are speed, radius and road condition. Furthermore, affects of two interacting factors, speed – road condition and radius – road condition, were significant and their affect on lateral acceleration could not be explained by noise. On the other hand, single factors affecting lateral acceleration in left curves were speed, super elevation and road condition, while only the interaction between speed and road condition had a significant effect. b_1 b_2 b_3 b_4 b_11 b_12 b_13 b_14 b_22 b_23 b_24 b_34 -0.5 0 0.5 1 1.5 2
Road parameters and their interactions (Factos b)
A ppr ox . 9 5% c onf idan ce in te rv al Speed Curve radii super elevation Road condition Left Right
Figure 4- An error plot of the confidence intervals of factors b that affect lateral acceleration for left and right curves
One objective was to determine if there are differences in lateral accelerations and yaw angular velocities between left and right curves. Analysis of variance (ANOVA) was used to compare lateral acceleration in left and right curves to each other. The ANOVA results are shown below in Table 5 Where SS is the sum of squares, Df is degrees of freedom, MS is mean of squares and Prob(F) is the p value from the F distribution. Curve directions are relevant for stating that there is a difference and the low probability value, when compared to the F-distribution; make it very unlikely that the differences between the curves can be explained by noise. Thus, the different lateral acceleration between right and left curves is significant during overtaking maneuvers. Table 5- ANOVA-Table Source SS Df MS F Prob(F) Curves 15.412 1 15.4209 54.18 1.184 E-09 Block 178.404 53 3.3661 11.83 3.331 E-16 Error 15.084 53 0.2846 Total 208.909 107
Yaw Angular Velocity
As explained in the previous section, confidence intervals for the analysis parameters are presented in the error plot below, Figure 5, which shows the confidence intervals of the factors, and whether or not they span zero and thus are significant. The single factors affecting yaw angular velocity in right curves were speed, radius and road condition while only speed had an effect on yaw angular velocity in left curves. In addition, yaw angular velocity in both left and right curves were sensitive to second order interactions of speed and to the interaction between speed and road condition.
b_1 b_2 b_3 b_4 b_11 b_12 b_13 b_14 b_22 b_23 b_24 b_34 -0.1 0 0.1 0.2 0.3 0.4
Road parameters and their interactions (Factos b)
A pp ro x. 95 % c onf id anc e i nt er va l Left Right Speed super elevation Curve radii Road condition
Figure 5- An error plot of the confidence intervals of factors b that affect yaw angular velocity for right and left curves
The ANOVA analysis was done to prove or refute that there is difference in vehicle responses when comparing results for left and right curves. The low probability value, when compared to the F-distribution, makes it very unlikely that the differences between the curves can be explained by noise. This means that the difference of yaw angular velocity between right and left curves, during overtaking, is significant.
Field Test
The results of the field test identified interesting differences in longitudinal speed and acceleration between left and right curves (Figure 6). On the large radii curves, speed is nearly constant when curves are left, but for curves to the right, speed decreases in the middle and increases in the last third of the curve.
Figure 6- Longitudinal speeds for left and right curves. (Adapted from [Alonso, 2007]).
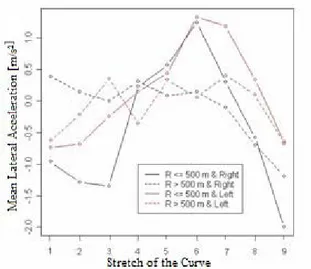
Figure 7 shows how longitudinal acceleration is negative at the beginning of the curves when the curve is to the right and R ≤ 500 m. Moreover, when curve is to the right but R > 500 m, longitudinal acceleration is more regular along the curves. The results from the data recorded in the driving studies indicate that drivers behave differently when negotiating left and right curves.
Figure 7- Longitudinal acceleration for left and right curves. (Adapted from [Alonso, 2007]).
DISCUSSION
The objective of this investigation was to find how vehicles and drivers perform on curves. In particular, why overtaking crash types are over-represented on right curves compared to left curves [Othman, 2009]. Thus, it is worth mentioning that, although finding factors affecting lateral acceleration/yaw angular
velocity is interesting and one of the goals of this study, it is of greater concern to find road factors that affect overtaking maneuvers in left and right curves differently. That is, factors that affect vehicle behavior in both right and left curves indicate that vehicle stability is sensitive to associated curve geometry features regardless curve direction. For the second goal finding if there are any significant differences of lateral acceleration and yaw angular velocity was not the only desired result. It was important to also determine the curve directions that produce the highest values. However, in comparing absolute maximum values both lateral acceleration and yaw angular velocity were significantly higher on left curves than on right curves. That was a statistical result and not the case for the all simulation combinations. These findings alone do not reflect results of the crash history analysis where right curves are more dangerous than left curves in overtaking [Othman, 2009]. However peak accelerations occurred at different times in the curve during lane changes for different curve directions. The magnitude of the peak values was more consistent in left curves than right curves. In right curves, little acceleration is observed when driving from the initial lane to the parallel lane. However, accelerations are severe in the middle when returning to the initial lane. This is a result that steering at this point in the maneuver must compensate both for the curve direction and the lane changing. The three peaks in left and right curves for all cases (Figures 2 and 3), showed that first and third peaks in left curves were higher than in right curves. More detail and effects of other road features on lateral acceleration and yaw angular velocity are described in the following sections.
Lateral Acceleration
The significant factors affecting vehicle response have been established in Tables 3 and 4, and visualized in Figure 4. It is interesting to note that they are different for left and right curves. Right curves were sensitive to radius and interaction of radius – road condition, while left curves were sensitive to super-elevation. The common active factors between right and left curves were speed, road condition and speed-road condition interaction. These common factors could be expected to be explained from basic vehicle dynamics. It is also relevant to see that there are no quadratic terms in the model that were significant for lateral acceleration response. The significant factors in left curves were sensitive to radius when initiating overtaking (leaving initial lane) while right curves were sensitive to radius when returning back to the initial lane (Figures 2 and 3). This rapid change of lateral forces through the curve is a result of the vehicle experiencing a transient
“curve radius” much smaller than indicated by the curve design radius. This can yield higher lateral force than the road design code has considered [Granlund, 2010], which may reach or exceed a limit condition. Thus, the results clearly demonstrate that vehicle performance is different between right and left curves during overtaking.
In Table 5, the data from the ANOVA results show that the difference between left and right curves is statistically significant at the 99% level with p-value of 1.18 x 10⁻⁹. This is highly significant and explains
that overtaking produces different responses in left and right curves. However, lateral acceleration is higher for left curves than on right curves. The mean lateral acceleration of all 54 runs in left curves was 0.08g (16%) higher than in right curves. This result is not consistent with the result of the earlier crash analysis [Othman, 2009]. Thus, the over-representation of overtaking crashes on right curves cannot be explained by vehicle dynamics characteristics when considering only maximum absolute lateral acceleration. This was found when identical driving conditions were given for left and right curves. However, right curves were more sensitive, to radius and interaction of radius – road condition, than left curves. At the same time, left curves were more sensitive to super-elevation. This indicates that right curves generally are sensitive to more road geometry parameters than left curves. Moreover, right curves induce a severe lateral acceleration in the middle of overtaking. In other words more steering input is required by the driver to perform the overtaking. When comparing peak values between curve directions, the differences were also statistically significant. Lateral accelerations at the start and finish of overtaking were higher on left curves than right curves, but lower in the middle of the maneuver.
The field test revealed that the driver chooses higher speeds in right curves than in left curves. The results of the field test were only analyzed as normal driving through the curves and overtaking was not identified. Thus, these results cannot be compared directly with the overtaking simulations. However, driving through curves without overtaking has been simulated with PC-Crash both with constant and variable speeds. The results did not show differences in vehicle dynamic behavior between left and right curves. The simulation results confirm that differences between left and right curves observed in the field tests are mainly due to human behavior. The fact that higher speeds were observed in right curves is interesting, even though the field tests were not investigating overtaking. Higher speed induces higher lateral acceleration and is additive to the transient effect of
decreasing radius in overtaking (discussed previously) in right curves.
The field test results linked to simulation show that the driver influences the vehicle performance and stability differently for right and left curves during overtaking. Stability is used in the context of defining how close the vehicle is to its limit condition for lateral forces.
Yaw Angular Velocity
As found in the analysis of lateral acceleration, there are significant effects of road parameters on yaw angular velocity and producing clear differences between right and left curves. The difference of yaw angular velocity was highly significant with p-value of 7.74 x 10⁻¹¹. But, similar to lateral acceleration,
left curves had much higher mean yaw angular velocity than right curves when comparing maximum values. In analyzing peak values of the yaw angular velocity, the middle peak of right curves was significantly higher than at the start and end of the maneuver.
For both lateral acceleration and yaw angular velocity results in overtaking maneuvers, higher absolute values were observed in left curves which contradict the results from the crash analysis [Othman, 2009]. However, these results are for constant speed maneuvers. The sensitivity of right curves to speed and radius suggests that the driver behavior in the curve can result in more critical vehicle responses. The type of driver responses observed in the field test [Alonso, 2007] identified one type of behavior (higher speed) in right curves that can potentially produce vehicle responses that can explain the safety issues observed in [Othman, 2009].
CONCLUSION
These simulation analyses have given insight into how road geometry factors and curve direction affect vehicle stability during overtaking maneuvers. Left curves were sensitive to super elevation while right curves to radius. The simulation showed also how variations in radius decreased vehicle stability. This occurs in the middle of overtaking maneuvers during right curves but occurs at the start and finish of overtaking maneuvers in the left curves. This behavior can contribute to the severity and frequency of overtaking crashes [Clarke, 1998]. Road design guidelines and road safety monitoring programs should reconsider the influence of road characteristics on traffic safety in curves. Parameters that have a negative influence on safety should be identified so that potential countermeasures are developed. Parameters that are sensitive to driver behavior are of particular interest.
Future work should focus on combined effect of vehicle dynamic responses, environment and human behavior during overtaking and driving through curves. This work needs to be based on more reliable data sources to define simulation inputs such as data from Field Operational Test (FOT) and Naturalistic Driving Studies (NDS).
REFERENCES
Alonso M, Vega H, Plaza J. (2007). Human Factors in road infrastructure design: analysis of road layout influence in driver behavior. Department of Human Factors, CIDAUT Foundation, Valladolid, Spain. International Conference Road Safety and Simulation (RSS). 2007.
Armour M. (1984). A description of casualty accidents on Australian rural highways. Report No. AIR 1120-3. Melbourne, Australia: ARRB Transport Research.
Box G E P, Hunter W G, Hunter J S. Statistics for Experimenters, John Wiley & Sons, New York. 2005.
Clarke D, Ward P, Jones J. (1998). Overtaking road accidents: Differences in maneuver as a function of driver age. Accident Analysis and Prevention, 30, 455-467
Cliff W, Lawrence J, Heinrichs B, el at. (2004). Yaw Testing of an Instrumented Vehicle with and without Braking. . SAE Paper No. 2004-01-1187.
Datentechnik S. (2007). PC Crash version 7.0 - A Simulation program for Vehicle Accidents, English Manual. Linz Austria 2002.
Gothié M, Cerezo V, Conche F. (2008). Relationship between road infrastructure characteristics and hgv accidents. CETE de Lyon Bron, France. International Conference on Heavy Vehicles. Paris 2008. Paper Nr. 86
Granlund J. (2010). Safer Curves on Multiple Lane Roads. Vectura Consulting, Sweden. Transport Research Arena Europe 2010, Brussels
Hughes W, Joshua S, McGee H. (1992). Study designs for passing sight distance requirements.
(Publication No.FHWA-RD-91-078). Washington DC: US Department of Transportation, Federal Highway Administration.
ISO (1999). International Organization for Standardization. International Standard ISO 3888-1. Technical Committee ISO/TC 22, Road vehicles, Subcommittee SC 9, Vehicle dynamics and road-holding ability.
Klomp M. (2007). On Driver Force Distribution and Road Vehicle Handling. A Study of Understeer and Lateral Grip. Licentiate Thesis. Department of Applied Mechanics. Chalmers University of Technology. Göteborg. Sweden.
Krammes R, Brackett R, Shafer M, el at. (1993). Horizontal alignment design consistency for rural two-lane highways. (Report No. FHWA-RD-94-034). Washington DC: Federal Highway Administration, US Department of Transport. Leonard J, Bilse D, Recker W. (1994).
Super-elevation rates at rural highway intersections. (Report No. RTA-53P434). Irvine, CA: University of Carolina Institute of Transportation Studies.
Miller E, Steuart G. (1982). Vehicle Lateral Placements on Urban Roads. Transportation Engineering Journal, Vol. 108, No. 5, September/October 1982, pp. 495-508
Moser A, Steffan H, Kasanický G. (1999). The Pedestrian Model in PC-Crash – The Introduction of a Multi Body System and its Validation. SAE Paper No. 1999-01-0445.
Nielsen M. (2000). Accidents on rural roads in Denmark. VTI Conferees, 13A, 7. Linköping, Sweden: Swedish National Road and Transport Research Institute.
Othman S, Thomson R, Lannér G. (2009). Identifying Critical Road Geometry Parameters Affecting Crash Rate and Crash Type. Chalmers University of Technology, Gothenburg, Sweden. 53rd AAAM Annual Scientific Conference, October 4-7, 2009, Baltimore, MD. Vol 53 · October 2009, pp 155 -165.
Oxley J, Corben B, Koppel S, el at. (2003). Cost-Effective Infrastructure Measures on Rural Roads. Monash University Accident Research Centre. Australia.
Polus A, Livneh M, & Frischer B. (2000). Evaluation of the passing process on two-lane rural highways. Transportation Research Record, 1701, 53-60.
RANKERS Project. Ranking for European Road Safety. Homepage http://rankers.cidaut.es. Spain; 2008.
Steyer R, Sossoumihen A, Weise G. (2000). Traffic safety on two-lane rural roads: New concepts and findings. Proceedings of the 2nd
International Symposium on Highway Geometric Design (pp 299-312). Cologne, Germany: Road and Transportation Research Association.
Wong J Y. (2001). Theory of Ground Vehicles. Department of Mechanical Aerospace Engineering. Carleton University. Ottawa. Canada.
Appendix Design Matrix A
b0 b1 b2 b3 b4 b11 b12 b13 b14 b22 b23 b24 b34
Lateral Acc. Yaw Angular Vel. Left Right Left Right
1 -1 -1 -1 -1 1 1 1 1 1 1 1 1 5.25 3.56 0,26 0,18 1 0 -1 -1 -1 0 0 0 0 1 1 1 1 6.42 5.65 0,35 0,25 1 1 -1 -1 -1 1 -1 -1 -1 1 1 1 1 6.64 6.02 0,71 0,85 1 -1 0 -1 -1 1 0 1 1 0 0 0 1 4.74 3.58 0,27 0,19 1 0 0 -1 -1 0 0 0 0 0 0 0 1 5.84 5.56 0,35 0,26 1 1 0 -1 -1 1 0 -1 -1 0 0 0 1 6.06 5.68 0,73 0,64 1 -1 1 -1 -1 1 -1 1 1 1 -1 -1 1 3.94 3.62 0,28 0,19 1 0 1 -1 -1 0 0 0 0 1 -1 -1 1 5.09 5.16 0,38 0,41 1 1 1 -1 -1 1 1 -1 -1 1 -1 -1 1 5.16 5.14 0,91 0,49 1 -1 -1 0 -1 1 1 0 1 1 0 1 0 4.19 2.98 0,22 0,15 1 0 -1 0 -1 0 0 0 0 1 0 1 0 5.45 4.64 0,2 0,22 1 1 -1 0 -1 1 -1 0 -1 1 0 1 0 6.31 5.96 0,45 0,42 1 -1 0 0 -1 1 0 0 1 0 0 0 0 3.53 3.11 0,22 0,16 1 0 0 0 -1 0 0 0 0 0 0 0 0 4.92 4.65 0,31 0,22 1 1 0 0 -1 1 0 0 -1 0 0 0 0 5.99 5.65 0,5 0,56 1 -1 1 0 -1 1 -1 0 1 1 0 -1 0 3.32 3.04 0,24 0,16 1 0 1 0 -1 0 0 0 0 1 0 -1 0 4.37 4.67 0,33 0,22 1 1 1 0 -1 1 1 0 -1 1 0 -1 0 5.03 5.16 0,5 0,8 1 -1 -1 1 -1 1 1 -1 1 1 -1 1 -1 4.96 2.78 0,26 0,16 1 0 -1 1 -1 0 0 0 0 1 -1 1 -1 6.08 4.33 0,36 0,22 1 1 -1 1 -1 1 -1 1 -1 1 -1 1 -1 6.37 5.86 0,69 0,34 1 -1 0 1 -1 1 0 -1 1 0 0 0 -1 4.21 2.79 0,26 0,15 1 0 0 1 -1 0 0 0 0 0 0 0 -1 5.32 4.51 0,37 0,22 1 1 0 1 -1 1 0 1 -1 0 0 0 -1 6.08 5.62 0,7 0,43 1 -1 1 1 -1 1 -1 -1 1 1 1 -1 -1 4.24 2.92 0,31 0,16 1 0 1 1 -1 0 0 0 0 1 1 -1 -1 4.79 4.38 0,39 0,21 1 1 1 1 -1 1 1 1 -1 1 1 -1 -1 5.22 5.14 0,75 0,67 1 -1 -1 -1 1 1 1 1 -1 1 1 -1 -1 5.32 3.66 0,28 0,18 1 0 -1 -1 1 0 0 0 0 1 1 -1 -1 7.30 5.42 0,4 0,23 1 1 -1 -1 1 1 -1 -1 1 1 1 -1 -1 8.93 7.80 0,5 0,3 1 -1 0 -1 1 1 0 1 -1 0 0 0 -1 4.47 3.68 0,27 0,19 1 0 0 -1 1 0 0 0 0 0 0 0 -1 6.51 5.60 0,41 0,23 1 1 0 -1 1 1 0 -1 1 0 0 0 -1 7.78 7.89 0,52 0,3 1 -1 1 -1 1 1 -1 1 -1 1 -1 1 -1 3.95 3.60 0,29 0,19 1 0 1 -1 1 0 0 0 0 1 -1 1 -1 5.77 5.65 0,41 0,24 1 1 1 -1 1 1 1 -1 1 1 -1 1 -1 7.03 7.76 0,56 0,31 1 -1 -1 0 1 1 1 0 -1 1 0 -1 0 4.22 3.09 0,23 0,16 1 0 -1 0 1 0 0 0 0 1 0 -1 0 6.18 4.60 0,35 0,21 1 1 -1 0 1 1 -1 0 1 1 0 -1 0 7.52 6.76 0,44 0,35 1 -1 0 0 1 1 0 0 -1 0 0 0 0 3.61 3.09 0,23 0,16 1 0 0 0 1 0 0 0 0 0 0 0 0 5.27 4.60 0,34 0,22 1 1 0 0 1 1 0 0 1 0 0 0 0 6.63 6.75 0,46 0,34 1 -1 1 0 1 1 -1 0 -1 1 0 1 0 3.55 3.02 0,25 0,15 1 0 1 0 1 0 0 0 0 1 0 1 0 4.77 4.64 0,34 0,22 1 1 1 0 1 1 1 0 1 1 0 1 0 5.89 6.77 0,49 0,34 1 -1 -1 1 1 1 1 -1 -1 1 -1 -1 1 5.12 2.68 0,27 0,15 1 0 -1 1 1 0 0 0 0 1 -1 -1 1 6.72 4.29 0,39 0,22 1 1 -1 1 1 1 -1 1 1 1 -1 -1 1 8.37 6.44 0,48 0,32 1 -1 0 1 1 1 0 -1 -1 0 0 0 1 4.36 2.89 0,28 0,16 1 0 0 1 1 0 0 0 0 0 0 0 1 5.94 4.28 0,43 0,22 1 1 0 1 1 1 0 1 1 0 0 0 1 7.16 6.59 0,52 0,31 1 -1 1 1 1 1 -1 -1 -1 1 1 1 1 4.12 2.81 0,28 0,15 1 0 1 1 1 0 0 0 0 1 1 1 1 5.52 4.33 0,46 0,22 1 1 1 1 1 1 1 1 1 1 1 1 1 6.60 6.47 0,56 0,31