http://www.diva-portal.org
This is the published version of a paper published in Algal Research.
Citation for the original published paper (version of record):
Albers, E., Malmhäll-Bah, E., Olsson, J., Sterner, M., Myers, J J. et al. (2021)
Influence of preservation methods on biochemical composition and downstream
processing of cultivated Saccharina latissima biomass
Algal Research, 55: 102261
https://doi.org/10.1016/j.algal.2021.102261
Access to the published version may require subscription.
N.B. When citing this work, cite the original published paper.
Permanent link to this version:
Algal Research 55 (2021) 102261
Available online 10 March 2021
2211-9264/© 2021 The Authors. Published by Elsevier B.V. This is an open access article under the CC BY license (http://creativecommons.org/licenses/by/4.0/).
Influence of preservation methods on biochemical composition and
downstream processing of cultivated Saccharina latissima biomass
Eva Albers
a,*, Eric Malmh¨all-Bah
a, Joakim Olsson
a, Martin Sterner
b, Joshua J. Mayers
a,
G¨oran M. Nylund
c, Katarina Rupar-Gadd
d, Mehdi Abdollahi
e, Suzana Cvijetinovic
a,
Ulrika Welander
d, Ulrica Edlund
b, Henrik Pavia
c, Ingrid Undeland
eaDept. Biology and Biological Engineering, Div. Industrial Biotechnology, Chalmers University of Technology, SE-412 96, G¨oteborg, Sweden bDept. Fibre and Polymer Technology, KTH Royal Institute of Technology, Teknikringen 56, SE-100 44, Stockholm, Sweden
cDept. of Marine Sciences — Tj¨arn¨o, University of Gothenburg, SE-452 96, Str¨omstad, Sweden
dDept. Built Environment and Energy Technology, Linnaeus University, Lückligs Plats 3, SE-351 95, V¨axj¨o, Sweden
eDept. Biology and Biological Engineering, Div. Food and Nutrition Science, Chalmers University of Technology, SE-412 96, G¨oteborg, Sweden
A R T I C L E I N F O Keywords: Seaweed Preservation Downstream processing Protein Alginate Biogas A B S T R A C T
Saccharina latissima biomass cultivated along the Swedish west coast was subjected to four different scalable preservation methods after harvest; freezing, sun-drying, oven-drying and ensiling. Freeze-drying and freezing at −80 ◦C were also included to provide dry and wet references. The effects of the different preservation methods
on the composition of Saccharina biomass (on dry weight, DW, basis), and the recovery as well as properties of high-quality protein, alginate and biogas were evaluated. Sun-drying significantly reduced protein, alginate and fatty acid content of the seaweeds and thereby concentrated ash in the biomass compared to the other methods. Protein/amino acids and fatty acids were significantly concentrated in ensiled biomass, while mannitol and laminarin were reduced compared to the other biomasses. Oven-drying and − 20 ◦C freezing affected the
composition the least, with lower ash content and alterations in some specific amino and fatty acids. Sun-drying and ensiling resulted in significantly lower protein solubility at high pH compared to the other biomasses which translated into the lowest total seaweed protein recovery using the pH-shift process. Highest protein yield was obtained with the freeze-dried reference. Ensiling lead to a significant decrease in the molecular weight of alginate, while sun-drying caused a negative effect on alginate by inducing a shift in the guluronic and man-nuronic acids composition of alginate. Sun-drying gave the lowest methane yield in the anaerobic digestion experiments while freezing at − 80 ◦C gave the highest yield, closely followed by freezing at − 20 ◦C and ensiling.
To conclude, preservation methods must be carefully chosen to protect the valuable component in Saccharina latissima, and to achieve an efficient downstream processing ultimately yielding high quality products as part of a seaweed biorefinery.
1. Introduction
Cultivated seaweeds have gained interest as a potential source of biomass in the conversion from a fossil-dependent to a biobased society. Further to their high contents of hydrocolloids, seaweeds have also been increasingly addressed as a potential source of food protein not competing with other crops for arable land. In Europe, large attention has been given the cultivation of kelps, especially Saccharina latissima, because of its large productivity and preference for temperate waters.
Due to high moisture content (70–90%) and the presence of many
sensitive molecules, freshly harvested cold water seaweeds deteriorate quickly [1,2], which limits the post-harvest processing possibilities of these seaweeds, especially for food applications. Thus, it is vital to find proper storage methods that can preserve the seaweed quality from the harvest-step until final usage or processing on a large scale. Dehydration is one of the most common methods for preservation of seaweeds; and traditionally, fresh seaweed harvested from the sea are dehydrated by sun-drying, oven-drying or, less commonly, freeze-drying for con-sumption or long-term storage before industrial processing. For eco-nomic and simplicity reasons, sun-drying is usually used for colloid
* Corresponding author.
E-mail address: albers@chalmers.se (E. Albers).
Contents lists available at ScienceDirect
Algal Research
journal homepage: www.elsevier.com/locate/algal
https://doi.org/10.1016/j.algal.2021.102261
production (agar, carrageenan, or alginate), from red and brown sea-weeds [3]. However, sun-drying is strongly dependent on the weather and the length of the day and it is the most difficult method when it comes to the control of drying rate and other parameters [4]. Heat-aided drying is also a very common method for stabilization of fresh plant-like organisms like seaweeds, especially in the preparation of certain frac-tions like ulvan and lipids [3,5]. It results in a faster drying rate but requires high amounts of energy. Previous studies have shown that after drying, even at low temperatures (25 or 30 ◦C), for examples the total
phenol, flavonoid and vitamin C contents of seaweed are reduced [6,7]. When using higher temperatures (60–70 ◦C), the nutritional value of
brown seaweeds has been found to be negatively affected compared to fresh material in some studies [4,8], but not in other [9]. It has also been shown that oven-drying leads to higher protein extractability and in vitro protein digestibility while freeze-drying results in proteins with better physicochemical properties [1].
Freezing is also a classic and commonly used preservation method, that retards both chemical reactions and microbial growth by the low temperature and conversion of water into ice. However, the formation of ice crystals can cause significant damage to the frozen material, espe-cially cell walls of vegetables [10]. Furthermore, in pools of unfrozen water, e.g. hydrogen ions, salts, and other molecules can become significantly concentrated and largely speed up chemical and biochemical reactions [10]. It is, for instance, well known that proteins can denature during freezing and frozen storage [11], which is expected to affect their extractability with aqueous solvents. Del Olmo et al. [12] found total polyphenol content and antioxidant capacity to remain at higher levels in frozen kombu than in high-pressure processed and salted kombu after storage for 180 days. In addition, frozen storage (− 30 and − 80 ◦C) and freeze-drying of Ulva rotundata preserved ulvan
poly-saccharides with higher molecular weights compared to hot-air drying, brining, and dry salting stabilization [3].
Ensiling is a preservation method primarily used for the storage of moist forage by lowering pH and omitting oxygen to avoid the growth of spoiling microorganisms [13]. The pH reduction can be achieved by additives, such as specific bacteria, enzymes, or acids; among the latter, several organic acids can be applied, but formic acid has the most widespread usage [14]. Ensiling has been performed on seaweed biomass, primarily using endogenous bacteria or inoculated lactic acid bacteria [15–17], but acid-based methods have also been tested [18]. In parallel work in our laboratory, acidic additives were found effective for the ensiling of Saccharina and the best results were obtained with a mixture of formic and propionic acids mimicking a commercial ensiling additive (unpublished work).
To integrate seaweeds into a biorefinery yielding multiple products with applications as, for example, food or materials, it is of vital importance to understand and predict how composition and molecular structures change as a function of specific preservation methods. In such a seaweed biorefinery, proteins are particularly interesting as new food ingredients and polysaccharides as candidates for bio-based materials. Under biotic conditions, proteins and polysaccharides are susceptible to degradation by the action of proteolytic and glycoside-cleaving en-zymes, respectively, but also by oxidation and chemical hydrolysis [19,20]. In proteins, some of the essential amino acids like lysine, methionine, tryptophan, and histidine are particularly reactive, which can reduce the nutritional quality. As an example, lysine can yield lysoalanine under alkaline conditions [20]. Alginate, a dominating polysaccharide in Saccharina, is composed of the sugar units mannuronic acid (M) and guluronic acid (G). Alginate was shown to be degraded by depolymerisation and loss of uronic acid substituents upon storage in water at ambient temperature [21]. In addition, both alkaline and acidic conditions are known to induce chemical degradation of poly-saccharides causing the molecular weight to decrease over time [22,23]. The mechanical integrity and gel-forming capacity of alginate are quite dependent on its molecular weight and G content and thus degradation may be detrimental to the applicability [24,25]. For a Saccharina
biorefinery process, the influence of preservation conditions on the molecular properties of alginate is key information.
Seaweeds also have a high content of carbohydrates that are not easily degradable in a traditional alcoholic fermentation, but on the other hand suits biogas production [26]. The biogas process involves complex microorganism consortia with the capability of degrading complex organic wastes [27]. Evaluation of different preservation methods regarding influence on methane potential is however of great importance since changes in nutritional value and molecular properties, such as molecular weight, might influence the biogas production substantially.
An assortment of studies have evaluated the effect of different preservation methods on the extraction of single components such as ulvan [3] and proteins [28], or the effect of a single preservation method like drying on the general quality of the seaweed [1,4,6,29] or protein extractability [1]. However, a comprehensive comparison between the most common principles to preserve seaweeds, and their effects on the subsequent compositional quality as well as the possibility to integrate the seaweed biomass in biorefining operations with multiple product outputs has not been reported before.
The aim of this study was to investigate how the application of different preservation methods to Saccharina biomass affects i) the biomass composition, ii) the ability to process the biomass with a focus on protein, alginate, and biogas recovery, and iii) the properties of these recovered key components. The applied methods were freezing at − 20 ◦C, two drying protocols, and ensiling, which were benchmarked
against freeze-drying and freezing at − 80 ◦C. A sub-goal was also to
evaluate the performance of the actual ensiling process to better un-derstand the properties of this preserved biomass in processing.
2. Material and methods
2.1. Preservation of cultivated Saccharina latissima biomass
Seaweeds were harvested in May 2016 from a 2 ha S. latissima farm in the Koster Archipelago, Sweden (N58◦51.53′, E11◦04.06′). S. latissima is
a cold-water species typically cultivated during the winter with harvest in spring or early summer [30]. After transportation to Tj¨arn¨o Marine Laboratory (N58◦52.55′, E11◦08.77′), the seaweed biomass was
pre-pared for the following preservation techniques: freezing at − 20 ◦C
(“Frozen − 20 ◦C”), drying in cabinet (“Oven-dried”), drying outdoors
(“Sun-dried”), or ensiling (“Ensiled”). These methods were compared to less invasive methods: freezing at − 80 ◦C (“Frozen − 80 ◦C”) and
freezing and subsequent freeze-drying (“Freeze-dried”) using a Free-Zone® 6 Liter freeze-dryer (LABCONCO). An overview of all preserva-tion methods used is presented in Fig. 1.
Seaweed biomass intended for all preservation techniques, except sun-drying, were first stored in mesh bags at 4 ◦C for one day to remove
excess seawater from the surface of the seaweeds, before they were transported on ice to Gothenburg for further processing. Material for freezing were cut in approximately 3 × 3 cm pieces, packed in plastic bags and frozen at − 20 or − 80 ◦C. The biomass frozen at − 20 ◦C was
moved to − 80 ◦C after 3 months.
Drying in heated cabinets was done in 20 kg batches of seaweed biomass cut into slightly larger pieces (approx. 5 × 5 cm) to avoid them falling through the grid of the dryer. The seaweed pieces were dried in industrial-type dryers (Protech Food Machinery AB) set to drying mode at 40 ◦C overnight with the fan set at 60 Hz. A water activity (a
w) of
0.25–0.30 was reached after the drying. The dry blades were crushed by hand before portions of approx. 100 g was packed separately in plastic bags and dark-stored at room temperature.
Outdoor drying was done by hanging a length of the sea-based cultivation line (5 m) with attached seaweeds outdoors exposed to wind and sun. After 10 days, portions of dried and crushed biomass (approx. 100 g) was packed separately in plastic bags and dark-stored at room temperature.
The ensiling process was done in duplicates in plastic fermentation barrels of 30 L (for beer brewing, Better Brew, UK) equipped with an air lock and a plate placed 9.5 cm above the bottom to allow a space to separate effluent liquid from the biomass. The plate contained holes (5 mm diameter) and 4 tubes (15 mm diameter) with holes (3 mm) placed upwards through the packed biomass into the head space. The ensiling process was started by adding 2 mL kg−1 of ensiling additive (65% v v−1
formic acid, 25% v v−1 propionic acid, i.e. the formic:propionic acid
ratio was 3.2 g g−1) to the cut seaweed (3 × 3 cm pieces) and mixing
thoroughly for 3 min. The pH at the start was measured on 4 g of seaweed pieces suspended in 4 mL of MilliQ water. Approx. 10 kg of biomass was loaded in each barrel giving a head space of approx. 3 cm. The barrels were sealed, the air lock filled with glycerol and stored at room temperature. The continuance of the ensiling was recorded by weighing the barrels regularly for 91 days. When ending the process, the barrels were opened, the pH measured, and the amounts of effluent liquid were weighed. Samples of the effluent liquids and the ensiled biomass was stored frozen at − 20 ◦C. For indication of microbial activity
and evaluating the release of ensiling additives, the liquid effluents were analysed for formic, propionic, lactic, acetic, and butyric acids, as well as ethanol in filtered samples by HPLC, Rezex ROA Organic acid H+
column (300 × 7.8 mm, Phenomenex Inc.) at 80 ◦C with 5 mM H 2SO4 as
eluent at a flow rate of 0.8 mL min−1 and refractive index detection.
Mass recovery of C, N, S elements were calculated from data measured: weights of biomass and liquid, C, N, S elemental composition of biomass and liquid, liquid density (determined by accurately weigh-ing 4 mL of liquid), and known amount of carbon in the ensilweigh-ing addi-tive. Gas losses were assumed to solely consisting of carbon dioxide.
2.2. Analyses of biomass composition
For the compositional analyses, all the preserved biomasses were freeze-dried. The freeze-dryer was loaded with slightly less than 1 kg material in total and run for seven days to achieve complete dry mate-rial. The weights were recorded before and after the freeze-drying and used to calculate the dry weight (DW) of preserved biomasses. The dry material was grinded (coffee mill, Rubiscon 48068, 140 W) to a fine powder, freeze-dried a second round and stored at − 20 ◦C.
2.2.1. Measurement of ash and C, H, N and S elements
The ash of freeze-dried samples were determined by combustion at 550 ◦C [31]. Determination of C, H, N and S elements on duplicates was
done using a Vario MICRO Cube elemental analyser (Elementar Analy-sensysteme GmbH) using the manufacturers recommendations, for
which 3–5 mg of sample was weighed to 0.001 mg accuracy or using 300 μL of ensiling liquid that was dried overnight at 85 ◦C. The C-molar
formula was calculated from the elemental composition assuming that the residual on ash-free basis was oxygen.
2.2.2. Analyses of carbohydrates
Total carbohydrates were determined on approx. 20 mg samples hydrolysed by a two-step sulfuric acid method [32] and monomers detected in microtiter plates (Sarstedt) using the colorimetric MBTH reagent [33] and plate readers SPECTROstar Nano or FLUOstar Omega (BMG LABTECH).
Monosaccharides were measured via high-performance anion ex-change chromatography (HPAEC) according to a modified version of the standard method SCAN-CM 71:09 [34]. Approximately 20 mg of sample was used for the hydrolysis. As a first step in the hydrolysis process, each sample was soaked in 3 mL 72% (w w−1) of sulfuric acid while put in a
desiccator under vacuum atmosphere for 80 min. The second step in the hydrolysis procedure was to dilute the samples with 84 mL water, so that the sulfuric acid concentration reached 4% (w w−1), followed by heating
to approximately 125 ◦C for 1.5 h. The samples were hydrolysed in 100
mL Pyrex flasks and heating was performed in a laboratory autoclave. The carbohydrate compositions of the hydrolysed samples were deter-mined using a high-performance anion exchange chromatograph (Dio-nex) equipped with a pulsed amperometric detector (HPAEC-PAD, Dionex ICS-3000) and CarboPac PA1 column (4 × 250 mm, Dionex), using Milli-Q water and solutions of sodium hydroxide and sodium ac-etate. The eluent was pumped at 1.5 mL min−1 with a program starting
with 0.10 M sodium hydroxide and increasing to 0.16 M sodium hy-droxide with 0.19 M sodium acetate during the run. The data were processed with Chromeleon 7.1 software. The carbohydrate standards used for calibration were fucose, arabinose, galactose, glucose, xylose, mannose and commercial alginate (from Macrocystis pyrifera, Sigma Aldrich) with a determined G:M acid composition. The composition of the reference alginate was determined by NMR and the reference algi-nate was hydrolysed in the same way as the sample material.
For laminarin and mannitol determination, extraction was done ac-cording to [35] as described for laminarin with subsequent neutraliza-tion with CaCO3; released glucose and mannitol were measured by HPLC
using the same method as for compounds in the ensiling liquid described above (Section 2.1).
2.2.3. Analysis of total fatty acids, proteins and amino acids
The total fatty acid analysis was done using 25 mg freeze-dried sample based on direct transesterification into fatty acid methyl esters
followed by analysis using GC-FID as previously described [36]. Total proteins were determined on approx. 5 mg freeze-dried sample that was extracted by hot TCA followed by alkaline extraction as described earlier [37], but with slight modifications in that bead beating was used prior to extraction (2 min, 30 Hz, QIAGEN Tissuelyser II). Detection of dissolved protein was done in microtiter plates (Sarstedt) with the colorimetric Lowry based kit, DC™ protein (BioRad) using plate readers SPECTROstar Nano or FLUOstar Omega (BMG LABTECH) and bovine serum albumin as standard.
Amino acids were determined on approx. 30–50 mg freeze-dried samples after hydrolysis in 6 M HCl and quantification by LC/MS as previously described [38]. The nitrogen-to-protein conversion factor (Kp
value) was calculated from the amino acid and nitrogen data as described by Forbord et al. [39].
2.3. Biorefinery processing of preserved biomass 2.3.1. Biomass preparations
In addition to preserved and the directly freeze-dried biomasses, seaweed kept frozen at − 80 ◦C was included in the biorefinery
pro-cessing experiments as a control for the − 20 ◦C-frozen biomass; making
in total six differently treated biomasses. These were all prepared for further processing by obtaining homogenized samples with smaller and uniform particle sizes. The bags with biomasses that had been frozen, which also included the ensiled biomass, were thawed under cold running water to a semi-thawed state. The material was ground in a kitchen aid (KitchenAid 5KSM150 with meat grinder Jupiter 478100) with the 2 mm hole plate at refrigerated temperature. All ground ma-terial from a treatment was mixed well together, after which the biomass was distributed to plastic bags with enough material for a single run of processing and stored frozen at − 80 ◦C. Dried material (approx. 4 g per
run) was milled in a coffee mill (Rubiscon 48068, 140 W) for 2–2.5 min until a particle size <0.5 mm. Different batches of milled material were pooled and mixed well before distributed to plastic bags with enough material for a single run of processing and stored frozen at − 80 ◦C.
Before applying the subsequent biomass processing, the bags with frozen material were carefully thawed under cold running water.
2.3.2. Protein extraction
Proteins were extracted by a modified version of the pH shift process used by Vilg and Undeland [40]. The process was applied to all masses in duplicate. To harmonize the method for all the different bio-masses, the actual moisture content of each individual biomass was first measured using an IR-scale (Precisa Moisture Balance HA 300). For each separate process trial, an amount equivalent to approximately 3.5 g dry weight (DW) of wet or dry seaweed was placed in a beaker and cold distilled water added to yield a moisture content of 88.5% (the highest measured moisture content of biomasses). The moisture-adjusted biomass was mixed with cold distilled water to a wet weight (WW) ratio of 1:6 (biomass:water) and homogenized using a polytrone (ULTRA-TURRAX® T18 basic, IKA®) for 2 min at speed 4 (18,000 rpm). The seaweed slurry/homogenate was kept on ice at all time, if not stated otherwise.
To determine the pH of biomasses before processing, the pH was measured in the homogenate after 15 min of stirring on a magnetic stirrer (MeterLab® PHM210 STANDARD pH METER).
After the pH measurement, 1 M NaOH was added to adjust the slurry to pH 12 and the slurry was then left to incubate under stirring on ice for 20 min. After incubation, samples for measurements of total protein were taken from the homogenate. The slurry was centrifuged (Sorvall® RC-5C Plus) at 8500 × g, 4 ◦C for 20 min, and the resulting supernatant
(S1) was separated from the pellet (P1) using a sieve (~0.5 mm) and weighed. Samples of S1 were taken for protein measurements before 1 M HCl was added to adjust S1 to pH 2 and left to incubate stirring on ice for 20 min. The S1 adjusted to pH 2 was frozen overnight at − 80 ◦C and
thawed the next day under cold running water and centrifuged at 8500
×g, 4 ◦C for 20 min. Samples from the resulting pellet (P2) were taken
for protein and amino acid measurements, while the rest of the samples were stored at − 80 ◦C.
Protein content of the seaweed biomasses and their corresponding protein isolate samples was measured using the Lowry method as modified by [41]. Amino acid analysis was done on 10–20 mg of freeze- dried and milled protein pellets as described for biomass samples in the previous section.
2.3.3. Alginate extraction
Crude alginate was extracted with our previously developed frac-tionation method [42]. Extraction was performed on 400 mg dry biomass, or wet frozen material with a dry weight corresponding to 400 mg. Briefly, after 16 h of extraction with 0.1 M sodium citrate (Na3C6H5O7) in water as the chelating solution, each sample was
centrifuged for 20 min at 2680 ×g and the supernatant was collected. Hydrochloric acid (10 M) was added to the supernatant to set pH to 1.0 ±0.2 to precipitate alginate. The precipitate pellet was dispersed in hydrochloric acid (pH 1.50) and again centrifuged. The precipitates were washed 3 times by adding 45 mL of 60% (w/w) ethanol(aq), fol-lowed by shaking, centrifugation, removing the supernatant, and then adding another aliquot of washing solution. The purified precipitate samples were dried under an airflow at room temperature for 1 day and then stored dry in a desiccator for at least 3 days. Samples were then weighed to calculate the total yield of precipitated material and stored in a desiccator at room temperature until further analysed.
Size exclusion chromatography (SEC) was used to estimate the mo-lecular weight distribution of the precipitated samples using a Dionex Ultimate-3000 HPLC system (Dionex) operating at 40 ◦C. Samples (1 mg
mL−1 dissolved in 5 mM sodium hydroxide) were filtered through 0.2
μm Nylon filters. Sodium hydroxide (10 mM) was used as the eluent,
elution rate was 1 mL min−1. Three PSS Suprema columns were used in
series, all with the dimensions 300 × 8 mm, with 10 μm particle size, and
with the pore sizes of 30, 1000, and 1000 Å. A Waters-410 refractive index detector (Waters) was used; pullulan polymers having molecular weights ranging from 342 to 708,000 g mol−1 were used for calibration.
The data were processed with the Chromeleon 7.1 software.
1H NMR was used to determine the uronic acid composition of the
extracted crude alginate fractions. Samples were dissolved in water, and the pH was adjusted to 3 via small additions of hydrochloric acid. Samples were heated to 100 ◦C for 1 h. After cooling, the solutions were
neutralized to pH 7 with sodium hydroxide, stirred until the alginate was completely dissolved, and then left to dry under an airflow at room temperature for approximately one day. Samples were dissolved in deuterium oxide to yield approx. 1% dry weight and transferred to NMR tubes with 5 mm diameters. 1H NMR spectra were recorded at 500 MHz
on a Bruker DMX-500 NMR spectrometer. MestReNova software was used for data acquisition. The uronic acid compositions were calculated from the NMR-peak areas according to the methodology previously described [43].
2.3.4. Biogas production by anaerobic digestion
The biomethane potential (BMP) was determined in triplicates on biomasses using lab-scale reactor set-ups. Frozen and ensiled seaweeds were stored at − 20 ◦C, whereas dried samples were stored at room
temperature prior to analysis of BMP. Tests were performed in 500 mL bottles filled with substrate and inoculum to a volume of 400 mL. An inoculum-to-substrate ratio on volatile solid (VS) basis of 4:1 was used. The amount of added VS from the solid substrates per reactor was approximately 0.5 g per bottle. Reactor content of a commercial anaerobic digester plant, treating food waste and fish industry slurry (V¨astervik Biogas AB), was used as inoculum for BMP tests. The chem-ical characteristics of the inoculum were; dry weight (DW) 30.5 g kg−1,
volatile solid (VS) 986.5 g kg−1, pH 7.8, ammonium‑nitrogen 480 mg
L−1, and volatile fatty acids (VFA) 207 mg L−1. The experiment also
from inoculum with cellulose as a standard substrate to verify adequate activity of the inoculum. After filling the reactors, the headspace was flushed with nitrogen to create anaerobic conditions. The reactors were closed and 1 L tedlar™ bags were connected to each reactor to collect the produced biogas. The reactor bottles were incubated in a water bath at a mesophilic temperature of 37 ◦C. The content of each bottle was
mixed every other day throughout the test by using a shaking table for a few minutes at 50 rpm. After 44 days, the runs were ended and the produced biogas volume and methane content in the tedlar bags were recorded.
To determine the loading of the biogas experiments, actual content of biomasses was determined; DW by oven-drying at 105 ◦C and VS by
ashing of the samples at 550 ◦C overnight according to Standard
methods for the examination of water and wastewater [44]. The diges-tate was centrifuged at 4696 ×g for 5 min and the supernatant was analysed by Hach Lange analysis cuvettes for Organic Acids (Fatty acids) detecting acetic acid equivalents, LCK 365, i.e. volatile fatty acids (VFA), and ammonium, LCK 303, for NH3-N. A Hach Lange spectrophotometer
DR3900 was used for the detection (https://se.hach.com/).
The methane concentration of the collected gas was determined using a gas analyser GFM 410 (Gas Data Limited, Coventry, UK). The data were recalculated to normalized standard conditions (standard atmospheric pressure, 0 ◦C, dry gas) and the biogas volume produced in
inoculated bottles with biomasses or cellulose as substrate was corrected for the biogas volume produced from the blank inoculum. BMP yields were determined as the normalized methane volume produced during the test period of 44 days relative to the amount of VS added as well as normalized methane volume produced relative to amount of dry weight (DW). The maximum theoretical methane yields are predicted on a complete conversion of organic compounds into methane and carbon dioxide and do not correct for non-degradable compounds or regener-ation of bacterial biomass [45].
2.3.5. Statistical analyses
For biomass composition, statistical significance of pair-wise com-parisons against the freeze-dried biomass was evaluated by Student’s t- tests using the function in Excel to calculate p-values assuming two- tailed distribution and equal variance. Each set of amino acid, fatty
acid and sugar data were analysed by principal component analysis (PCA) using the statistical toolbox of MATLAB® (The MathWorks Inc.) to identify correlations between preservation methods and the com-pounds of each set and results were visualised with the biplot function. A Scree plot was used to evaluate the importance of variance in the data of each principal component.
For evaluation of the results of downstream processing, one-way analysis of variance (ANOVA) was carried out to determine significant differences between groups, followed by Duncan’s multiple range test.
3. Results and discussion
To evaluate the suitability of specific preservation methods for cultivated Saccharina latissima biomass, knowledge on changes in biomass composition and effects on downstream processing in response to the preservation is needed. The wet frozen − 80 ◦C and freeze-dried
biomasses were considered to be impacted the least and thus regarded as controls when appropriate. With the focus on preservation perfor-mance and downstream processing in this paper, an important factor for the large-scale usage of these techniques in a seaweed industry is omitted, their environmental footprint. A recent study highlights that some preservation methods, particularly those that involve high levels of energy consumption due to this high moisture content (e.g. drying or freezing), can dominate the environmental footprints of kelp products, see Thomas et al. [46] for deeper discussion. Obviously, a lower foot-print is desirable, preferably, without lowering the quality of products from S. latissima, which is what is evaluated in this paper.
3.1. Performance of the ensiling process
The ensiling additive with mixed acids made the pH of the biomass drop from 6.15 to 4.50 and 4.42 in batch 1 and 2, respectively. The weights of the ensiling barrels were monitored to get indications on activity of spoiling microorganisms, which break down biomass into carbon dioxide that is emitted through the gas lock. However, small losses of weight were found with slightly more biomass retained in batch 2 than in batch 1, 99.4% and 99.2%, respectively. The slightly better performance of batch 2 could be seen also in the pH, which had decreased to 4.32 at the end of the process, whereas the pH in batch 1 instead had increased slightly to 4.57. Both these pH levels seem a little too high to ensure a proper ensiling process. In comparison, when ensiling grass, the pH should be below 4 to ensure efficient preservation [14].
The loss of biomass into the effluent liquid was large giving biomass retentions of 0.62 and 0.66 for batches 1 and 2, respectively, supporting that the ensiling process was not fully satisfactorily. The decomposition of biomass resulted in the release of water, particles, and dissolved compounds into the effluent liquid, in which 65–70 g dry weight (DW) L−1 of suspended and dissolved solids were found (Table 1). Thus, some
microbial activity may have occurred, which was responsible for the degradation of the seaweed, and indeed, some compounds typically
Table 1
Composition of ensiling liquid effluent with averages and standard deviations from N replicates (number in brackets).
Component/compound (g L−1) Ensiled, batch
1 Ensiled, batch 2
Total suspended and dissolved solids, DW (N =3) 64.9 ± 0.7 71.0 ± 1.6 Density (N = 4) 1034 ± 5 1033 ± 1 Carbon (N = 2) 14.7 ± 0.2 15.5 ± 0.1 Hydrogen (N = 2) 2.44 ± 0.03 2.59 ± 0.02 Nitrogen (N = 2) 0.95 ± 0.01 1.01 ± 0.01 Sulphur (N = 2) 1.04 ± 0.01 1.14 (N = 1) Table 2
Composition of differently preserved biomasses of cultivated S. latissima. Averages from triplicate analyses ± standard deviations are given. Levels of components in ensiled biomass related to the initial weights of biomass are shown in brackets. Significant differences compared to freeze-dried biomass according to t-tests are shown with ** for p < 0.01 and * for p < 0.05.
Biomass component (mg g−1 DW) Preservation method
Freeze-dried Sun-dried Oven-dried Frozen − 20 ◦C Ensiled, batch 1 Ensiled, batch 2
Total proteins 78 ± 9 61 ± 4* 78 ± 1 83 ± 5 90 ± 3 (55) 101 ± 5* (66)
Total carbohydratesa 284 ± 13 300 ± 23 295 ± 28 300 ± 17 263 ± 19 (162) 301 ± 21 (198)
Mannitol 173 ± 2 190 ± 2** 186 ± 1** 175 ± 4 114 ± 0.5** (71) 128 ± 3** (84)
Total fatty acids 13.1 ± 0.2 6.7 ± 0.1** 12.7 ± 0.2 12.5 ± 0.2* 21.8 ± 0.1** (13.5) 29.6 ± 0.2** (19.5)
Ash 292 ± 1 312 ± 5** 278 ± 8* 281 ± 1** 317 ± 3** (196) 282 ± 2** (185)
Mass balance (%) 84 87 85 85 81 84
DW: dry weight.
resulting from microbial activity [47] were found in the liquid, of which butyric acid is one of the main indicators of bacterial growth. When relating the amount of butyric acid found in the liquid to the amount of biomass (counting liquid as part of ensiled material), these levels were 0.15 and 0.12% g g−1 DW for batches 1 and 2, respectively, which is
above the threshold of 0.1% set for the quality of agricultural ensilage [47]. Also, ethanol (from yeast activity) and acetic acid (from bacterial activity) were found, 0.2 and 0.05% g g−1 DW, respectively, but these
are at lower levels than set quality thresholds. A small amount of lactic acid was found as well, 0.05% g g−1 DW. The acids of the ensiling
ad-ditive were also present and the ratio of these was 4.4 and 4.1 g g−1 for
batches 1 and 2, respectively, which is higher than the added mix (3.2 g g−1) and thus a larger portion of formic acid was released from biomass
into the liquid. The microbial activity could be caused by that some oxygen had diffused into the ensiling barrel, probably because the sealing of the lid was not tight enough. The barrels used are intended for beer brewing, in which the yeast fermentation evolves large amounts of carbon dioxide and thus creating anaerobic environment and a back-pressure that pushes out oxygen. We had small gas losses and hence a lower gas pressure in the barrel which possibly could allow oxygen to diffuse into the silage.
Since biomass weight was lost into the effluent liquid, the elemental composition (C, H, N, S) of the liquid was analysed to make mass bal-ances of the ensiling process (Table 1). The balance over the whole ensiling process was found to close rather well at around 80%. Carbon was recovered in biomass, liquid, and gas losses at 72 and 80% for batches 1 and 2, respectively. In biomass and liquid, nitrogen was recovered at 76 and 87% and sulphur at 82 and 88% for batches 1 and 2, respectively. It total, the variation was not large between batches but since batch 2 performed slightly better, it was decided that only biomass from this barrel should be used for the later downstream processing.
3.2. Composition of the differently preserved biomasses
The differently preserved biomasses obtained can be grouped into dry and wet biomasses with low and high moisture contents, respec-tively. The sun-dried biomass contained 7.8 ± 0.4% moisture (g g−1 wet
weight, WW) and the oven-dried 4.7 ± 0.2% g g−1 WW of moisture
(average ± standard deviation of triplicates given). The freeze-dried biomass was completely dry. The wet biomasses, i.e. frozen at − 20 ◦C
and ensiled biomass from batches 1 and 2, contained similar amounts of moisture, 85.0 ± 0.9, 86.0 ± 0.25, and 85.1 ± 0.6% g g−1 WW,
respectively. The original biomass had a slightly higher moisture content of 87.8 ± 0.4% g g−1 WW. This is to be expected as liquid was lost to the
effluent during ensiling and during storage at − 20 ◦C for a longer time,
ice crystals are formed on the surface, which are easily lost in the later handling.
The crude biochemical composition of the S. latissima biomasses were determined on a dry weight (DW) basis (Table 2). No significant differences were seen regarding the content of total carbohydrates. However, for mannitol (measured separately as polyols are not detected in the total carbohydrate analysis method), significantly higher content was found after both types of drying compared to freeze-dried material, whereas lower content was found after ensiling, which could reflect some microbial activity that uses mannitol as a carbon source during the ensiling. Regarding proteins, there were significantly lower protein levels in the sun-dried than freeze-dried biomass, but higher in the ensiled biomasses, albeit only significant for batch 2. Also, for total fatty acids, sun-dried biomass had a significantly reduced content; only about half of that in the freeze-dried biomass, while the fatty acid content was about two times higher in the ensiled biomass. It is likely that sun- drying, with long-term exposure to light, induced oxidation of both proteins and fatty acids, yielding e.g. volatile carbonyls which are released from the biomass [48]. Soluble proteins may also be lost with the liquid that trickles from the biomass initially during sun-drying. A difficulty with sun-drying is that the conditions alter from location and
Table 3 Elemental composition of differently preserved biomasses of cultivated S. latissima . Averages from duplicate analyses ± (max value − min value) / 2 are given. C-molar formula of biomasses calculated on ash-free basis with oxygen as the residual part. Significant differences compared to freeze-dried biomass according to t-tests are shown with ** for p < 0.01 and * for p < 0.05. Element (mg g − 1 DW) Preservation method Freeze-dried Sun-dried Oven-dried Frozen − 20 ◦C Ensiled, batch 1 Ensiled, batch 2 Carbon 322.4 ± 0.4 292.6 ± 0.4** 307.2 ± 0.2** 315.8 ± 0.2* 297.1 ± 0.0** 314.7 ± 0.9 Hydrogen 48.7 ± 1.0 48.2 ± 0.0 49.2 ± 0.2 49.4 ± 0.3 47.1 ± 0. 2 49.2 ± 0.2 Nitrogen 17.7 ± 0.1 15.2 ± 0.1** 17.8 ± 0.1 17.2 ± 0.2 18.5 ± 0.1* 19.9 ± 0.0** Sulphur 11.2 ± 0.9 10.9 ± 0.2 9.5 ± 0.4 8.9 ± 0.2 11.2 ± 0.7 11.3 ± 0.5 C-molar formula CH1.859 O0.764 N0.048 S0.013 CH1.963 O0.824 N0.044 S0.014 CH1.909 O0.827 N0.050 S0.012 CH1.863 O0.778 N0.047 S0.011 CH 1.891 O0.781 N0.053 S0.014 CH1.858 O0.772 N0.054 S0.013
time, which subsequently affect the composition of biomass. Other studies have found minor effects of sun-drying on biochemical compo-sition [7], pointing at our particular conditions as less favourable for the preservation. The very minor differences found in composition of bio-masses subjected to freeze-drying or oven-drying at 40 ◦C agree with
previous studies [8,9]. Significant differences in ash contents were also found, with the lowest content in biomasses which were oven-dried and frozen at − 20 ◦C, and highest content in sun-dried biomass. The
measured components accounted for 81–87% of the DW, which range is often seen [31]. Some components present at low levels, but not measured, could partly account for the 13–19% missing part in the mass balance, i.e. nucleic acids, pigments and phenolic compounds. In
Sac-charina, phenolics are mainly in the form of phlorotannins, which in S. latissima collected from the same area has been measured to be 4–12
mg g−1 DW [35], and from our cultivation trials we have measured
maximum 2 mg g−1 DW (unpublished data). Furthermore, the glycerol
backbone of the lipids was not measured here, as we only monitored the total fatty acids.
The ensiling process depends heavily on the achievement of proper conditions to preserve the content, which is illustrated by the better performance in the ensiled batch 2 compared to batch 1. Additionally, it should be noted that when substantial losses occur into the liquid, which is drained off, the content is related to the residual weight and thus not to the initial mass, which can mean an in-concentration of components in ensiled biomasses. Thus, for the contents related to the initial weights of biomass (Table 2, data within brackets), it was seen that the only component being preferably retained in the biomass was fatty acids. The largest reduction in comparison to the level in the initial biomass was seen for mannitol, 50–60%, but losses were also substantial for total carbohydrates and ash, 30–40% for both, while it was moderate for proteins, 15–30%.
From the elemental composition, it was seen that the carbon content in S. latissima was reduced after all the preservation methods, whereas the content of hydrogen and sulphur were similar (Table 3). The content of nitrogen was significantly lower in sun-dried biomass and higher in ensiled biomass and thus followed the same trend as the content of protein, which is the main nitrogen-containing compound in biomass. The rather consistent elemental composition was also seen in the similar C-molar formulas of the biomasses from all preservation methods.
The total amino acid content followed the same trends as protein and nitrogen contents for the different preservation methods. The highest content was found in freeze-dried and ensiled biomass, 71.1 and 69.5 mg g−1 DW, respectively, while the lowest total content was found in
sun-dried biomass, 31. mg g−1 DW (Table 4). In the latter, all amino
acids were significantly reduced compared to the freeze-dried biomass. In the other biomasses, only the contents of some specific amino acids were changed. In oven-dried biomass, the contents of alanine, glycine, lysine, and serine were reduced and in frozen − 20 ◦C biomass, the
contents of alanine, glutamic acid, glycine, histidine, leucine, methio-nine, phenylalamethio-nine, serine, tyrosine, and valine were reduced. After ensiling very small differences were seen in the amino acid pattern, with only the proline content being slightly higher, compared to freeze-dried biomass. The proportion of essential amino acids was significantly increased after all preservation methods compared to freeze-drying and was most pronounced after sun-drying. Overall, alanine, glycine, lysine, and serine were most susceptible to changes as a result of the preser-vation method. For lysine, its amino group is a potent nucleophile which makes it able to participate in numerous reactions, for example, lysoa-lanine formation [20].
Alanine and glutamic acid were the most representative among amino acids. According to earlier studies, these exist to a significant extent in free form in brown seaweeds [49], and together with glycine, are the main components responsible for the sweet (alaninate) and umami (glutamate and aspartate) flavour of seaweed [49,50]. In freeze- dried biomass, these amino acids comprised 45% of total amino acids, while in all other biomasses, the content of these was reduced, especially in sun-dried (37%) and ensiled (40%) biomasses, which thus potentially have less flavour.
The nitrogen-to-protein conversion factors (the Kp values) were
lower for both dried biomasses and lowest for the sun-dried one, which points at losses of non-protein nitrogen during drying. This factor varies with season and growth location of seaweeds [39,51,52]. Our value for the freeze-dried biomass, 3.76, is similar to factors determined in pre-vious studies for cultivated S. latissima sampled in May, 3.8–4.4 [39,53].
The main part of monosaccharides in S. latissima was glucose and guluronic and mannuronic acids, which mainly were the ones changing in response to preservation (Table 5). The uronic acids constitute algi-nate whereas glucose is mainly found in laminarin and cellulose. In our
Table 4
Amino acid contents of differently preserved biomasses of cultivated S. latissima. Essential amino acids are histidine, isoleucine, leucine, lysine, methionine, phenylalanine, threonine, and valine. Averages from duplicate analyses ± (max value − min value) / 2 are given. Significant differences compared to freeze-dried biomass according to t-tests are shown with ** for p < 0.01 and * for p < 0.05.
Amino acids (AA) (mg g−1 DW) Preservation method
Freeze-dried Sun-dried Oven-dried Frozen − 20 ◦C Ensiled, batch 2
Alanine 13.57 ± 0.55 5.43 ± 0.12** 9.25 ± 0.33* 10.80 ± 0.32* 11.73 ± 0.95 Arginine 1.85 ± 0.10 0.82 ± 0.03* 1.34 ± 0.09 1.46 ± 0.01 2.03 ± 0.15 Aspartic acid 3.52 ± 0.25 1.25 ± 0.01* 2.28 ± 0.23 2.64 ± 0.06 3.62 ± 0.44 Glutamic acid 14.31 ± 0.84 4.26 ± 0.20** 9.63 ± 0.98 10.43 ± 0.03* 11.62 ± 1.08 Glycine 3.96 ± 0.07 2.05 ± 0.05** 2.80 ± 0.11** 3.06 ± 0.02** 4.25 ± 0.31 Histidine 0.84 ± 0.04 0.26 ± 0.02** 0.61 ± 0.07 0.66 ± 0.02* 0.87 ± 0.09 Isoleucine 3.82 ± 0.20 2.18 ± 0.06* 2.99 ± 0.14 3.31 ± 0.03 4.22 ± 0.25 Leucine 6.94 ± 0.21 3.83 ± 0.07** 5.28 ± 0.37 5.84 ± 0.05* 7.45 ± 0.58 Lysine 2.66 ± 0.05 1.22 ± 0.10** 2.14 ± 0.02** 2.47 ± 0.03 2.83 ± 0.32 Methionine 1.89 ± 0.03 0.98 ± 0.01** 1.48 ± 0.13 1.56 ± 0.01* 1.92 ± 0.18 Phenylalanine 3.65 ± 0.04 1.93 ± 0.04** 2.87 ± 0.20 3.34 ± 0.04* 4.12 ± 0.26 Proline 2.16 ± 0.01 1.50 ± 0.12* 1.70 ± 0.13 1.91 ± 0.09 2.48 ± 0.07* Serine 2.21 ± 0.05 1.11 ± 0.01** 1.59 ± 0.06* 1.75 ± 0.02* 2.24 ± 0.11 Threonine 2.88 ± 0.01 1.55 ± 0.04** 2.16 ± 0.18 2.37 ± 0.17 3.18 ± 0.22 Tyrosine 0.93 ± 0.04 0.38 ± 0.02** 0.69 ± 0.07 0.73 ± 0.00* 1.00 ± 0.15 Valine 5.89 ± 0.07 3.11 ± 0.01** 4.48 ± 0.38 5.00 ± 0.05** 5.94 ± 0.53 Total AA 71.1 ± 2.5 31.9 ± 0.2** 51.3 ± 3.5* 57.3 ± 0.4* 69.5 ± 5.7
Total essential AA (% of total) 29.5 ± 0.61 (41.5 ± 0.6) 15.4 ± 0.1** (48.5 ± 0.1)** 22.7 ± 1.6 (44.2 ± 0.1)* 25.3 ± 0.1* (44.1 ± 0.0)* 31.5 ± 2.6 (45.4 ± 0.0)* Nitrogen-to-protein conversion
biomasses, laminarin comprised the largest part of the glucose, 85–92%, resulting in cellulose contents in the range of 10–20 mg g−1 DW. These
cellulose levels are substantially lower than the approx. 10% of dry matter found for S. latissima harvested in Scotland [52]. However, as cellulose is a structural polysaccharide there are possibly a reduced need of rigidity of the blades in cultivation as the lines are densely covered and thus the blades support each other. Sun-drying reduced the content of guluronic and mannuronic acids, i.e. alginate, as well as that of fucose, whereas arabinose was largely enriched. For oven-dried and frozen − 20 ◦C biomasses, almost no differences were seen, only glucose/
laminarin was slightly increased. Ensiling was the least efficient method for retaining sugars, and large reductions were seen for glucose/lami-narin and arabinose, whereas the content of guluronic acid (as well as alginate) increased.
For the fatty acid profiles of S. latissima biomasses, several significant differences were seen in response to the preservation method (Table 6). Generally, the major saturated fatty acids (SFA) were C14:0 and C16:0, the major monosaturated fatty acid (MUFA) was C18:1, and the major polyunsaturated acids (PUFA) were C18:2 and C20:5 (EPA). The total MUFA content were on average the lowest (~2.0 mg g−1 DW) in
com-parison to SFA (~6.4 mg g−1 DW) and PUFA (~7.6 mg g−1 DW). Sun-
drying reduced the content of most fatty acids, but especially the PUFAs, resulting in a total PUFA content of only 0.8 mg g−1 DW
compared to 4.8 mg g−1 DW for the freeze-dried biomass. EPA was the
fatty acid decreasing the most, 97% of that in freeze-dried material. In both oven-dried and frozen − 20 ◦C biomasses, the content of the major
classes of fatty acids was maintained even if changes in individual fatty acids were seen, e.g. for C16:1, C18:1–4, C20:4 (ARA) and EPA. For ensiled biomass, the content of all fatty acid sub-classes increased, especially the content of PUFA, which more than doubled as compared to freeze-dried biomass. The single PUFAs responsible for the increase seen were C18:2, C18:4, ARA, and EPA. Additionally, there were shifts in the contents of C18 fatty acids; while the content of C18:3(n− 3) α
slightly increased, the content of C18:3(n− 6) γ decreased 4 times. Most notable was the almost 20 times increased content of C18:0 in ensiled compared to freeze-dried biomass. These shifts in content of single fatty acids may at least partly be the results of microbial activity during the ensiling process.
The data were further evaluated with principal component analysis. The data set with amino acids was shown to retain most of the data variation (96.8%) in the first principal component, which indicates there is very little variation represented in the other components. Therefore,
Table 5
Sugar contents of differently preserved biomasses of cultivated S. latissima. Monosaccharide data from acid hydrolysis with IC detection. Averages from duplicate analyses ± (max value − min value) / 2 are given for monosaccharides. Averages from triplicate analyses ± standard deviations are given for laminarin. Laminarin content of ensiled batch 1 was 62 ± 2 mg g−1 DW, significantly different to freeze-dried (p < 0.01). Significant differences compared to freeze-dried biomass according
to t-tests are shown with ** for p < 0.01 and * for p < 0.05. Sugar (mg g−1 DW) Preservation method
Freeze-dried Sun-dried Oven-dried Frozen − 20 ◦C Ensiled, batch 2
Arabinose 0.3 ± 0.1 2.1 ± 0.1** 0.5 ± 0.0 0.3 ± 0.0 ND Fucose 14.9 ± 0.3 8.8 ± 0.2** 13.9 ± 0.3 14.0 ± 0.2 13.3 ± 1.0 Galactose 4.7 ± 0.1 4.0 ± 0.2 5.0 ± 0.2 4.3 ± 0.0 4.4 ± 0.3 Glucose 146.8 ± 1.5 171.9 ± 6.3 144.0 ± 4.7 163.4 ± 0.05** 83.5 ± 3.7** Mannose 10.4 ± 0.1 10.7 ± 0.2 10.3 ± 0.0 10.5 ± 0.1 9.2 ± 0.8 Xylose 2.4 ± 0.1 2.3 ± 0.1 2.6 ± 0.0 2.3 ± 0.1 2.7 ± 0.2 Guluronic acid (G) 106.3 ± 0.2 83.1 ± 2.5* 104.7 ± 0.8 100.2 ± 1.8 151.1 ± 5.1* Mannuronic acid (M) 84.7 ± 0.8 70.3 ± 1.5* 84.3 ± 0.7 81.7 ± 0.4 81.2 ± 3.7 Total sugars 371 ± 10 353 ± 14 365 ± 3 377 ± 3 345 ± 3 Laminarin 125 ± 1 159 ± 2** 132 ± 2* 142 ± 6* 72 ± 11** Alginatea 191 ± 1 153 ± 4* 189 ± 1 182 ± 2 232 ± 9* ND—not detected.
aCalculated as the sum of guluronic and mannuronic acids.
Table 6
Fatty acid contents of preserved biomass of cultivated S. latissima. Additionally to the reported fatty acids, there were traces of C22:0, C22:1 and C24:0 in the range 0.01–0.02 mg g−1 DW. Averages from triplicate analyses ± standard deviations are given. Significant differences compared to freeze-dried biomass according to t-tests
are shown with ** for p < 0.01 and * for p < 0.05. Fatty acid (mg g−1 DW) Preservation method
Freeze-dried Sun-dried Oven-dried Frozen − 20 ◦C Ensiled, batch 1 Ensiled, batch 2
C14:0 2.14 ± 0.02 1.65 ± 0.03** 2.03 ± 0.05* 2.09 ± 0.06 2.56 ± 0.04** 2.80 ± 0.07** C16:0 3.53 ± 0.06 3.23 ± 0.08** 3.41 ± 0.06 3.43 ± 0.07 4.26 ± 0.03** 4.62 ± 0.02** C18:0 0.24 ± 0.00 0.34 ± 0.02** 0.27 ± 0.01** 0.23 ± 0.01 4.26 ± 0.03** 4.62 ± 0.02** C20:0 0.16 ± 0.002 0.15 ± 0.002** 0.16 ± 0.001 0.17 ± 0.004* 0.19 ± 0.002** 0.21 ± 0.002** Total SFA 6.1 ± 0.1 5.4 ± 0.1** 5.9 ± 0.1 5.9 ± 0.1 7.3 ± 0.1** 8.0 ± 0.1** C16:1 0.70 ± 0.02 0.07 ± 0.00** 0.57 ± 0.02** 0.64 ± 0.02** 0.67 ± 0.01 0.81 ± 0.02** C18:1 1.33 ± 0.02 0.29 ± 0.00** 1.13 ± 0.01** 1.31 ± 0.02 1.64 ± 0.00** 2.17 ± 0.00** C20:1 0.19 ± 0.00 0.18 ± 0.01 0.19 ± 0.00 0.18 ± 0.01 0.19 ± 0.01 0.19 ± 0.01 Total MUFA 2.2 ± 0.1 0.6 ± 0.0** 1.9 ± 0.0* 2.1 ± 0.1 2.5 ± 0.0** 3.2 ± 0.0** C18:2 1.03 ± 0.02 0.30 ± 0.00** 1.20 ± 0.00** 1.06 ± 0.02 2.74 ± 0.05** 4.37 ± 0.04** C18:3(n− 6) γ 0.13 ± 0.00 0.04 ± 0.01** 0.12 ± 0.00** 0.16 ± 0.00** 0.03 ± 0.00** 0.03 ± 0.00** C18:3(n− 3) α 0.66 ± 0.01 0.15 ± 0.00** 0.55 ± 0.01** 0.64 ± 0.01 0.81 ± 0.00** 1.06 ± 0.00** C18:4 0.63 ± 0.01 0.06 ± 0.00** 0.59 ± 0.01* 0.50 ± 0.01** 2.52 ± 0.04** 3.99 ± 0.04** C20:2 0.02 ± 0.00 0.01 ± 0.00** 0.02 ± 0.00 0.02 ± 0.00 0.16 ± 0.00** 0.04 ± 0.00** C20:3 0.10 ± 0.001 0.04 ± 0.000** 0.09 ± 0.001** 0.11 ± 0.001** 0.11 ± 0.003** 0.14 ± 0.000** C20:4(n− 6), ARA 0.85 ± 0.03 0.04 ± 0.00** 0.99 ± 0.01** 0.70 ± 0.01** 2.18 ± 0.03** 3.33 ± 0.00** C20:4(n− 3) 0.18 ± 0.00 0.04 ± 0.01** 0.18 ± 0.00 0.20 ± 0.00** 0.25 ± 0.01** 0.39 ± 0.00** C20:5, EPA 1.06 ± 0.03 0.03 ± 0.00** 1.07 ± 0.02 0.91 ± 0.02** 3.06 ± 0.06** 4.99 ± 0.03** C22:6, DHA 0.12 ± 0.002 0.06 ± 0.001** 0.11 ± 0.005* 0.12 ± 0.001 0.08 ± 0.002** 0.13 ± 0.002** Total PUFA 4.8 ± 0.1 0.8 ± 0.0** 4.9 ± 0.01 4.4 ± 0.1** 11.9 ± 0.2** 18.5 ± 0.1**
PCA analysis was irrelevant for the statistical evaluation of amino acids. On the other hand, fatty acids and sugars were suitable with the varia-tion spread between first and second principal component, while also accounting for a large amount of the total variation (Fig. 2). The fatty acids displayed strong preservation with ensiling methods, apart from C18:3 γ, which was highly dependent on methods, in which temperature is changed, to be maintained (oven-drying, freezing at − 20 ◦C and
freeze-drying). In general, temperature-assisted preservation methods were clustered together in both scenarios, except the sun-drying method. Higher quantities of sugars like mannuronic acid, fucose, and galactose were associated with freeze-drying and oven-drying, while higher levels of mannitol, glucose, and laminarin were mainly associ-ated with freezing at − 20 ◦C. The sun-drying method was poor in
pre-serving fatty acids as compared to other methods, as shown by a placement of this method in the opposite end in relation to all fatty acids in the plot. However, it was effective in retaining arabinose at higher
quantities. Ensiling differed from other methods; they prominently preserved most of the fatty acids and two sugars: xylose and guluronic acid and for the fatty acids, the two batches of ensiling clustered together.
Despite the losses to the ensiling liquid, high-value components (amino acids, fatty acids, and specific sugars) in S. latissima biomass were preserved, and in some cases even concentrated, in the ensiled residual biomass. Sun-drying performed the worst in preserving most of the compounds, except for sugars and especially mannitol, which in fact exhibited the highest contents after sun-drying and oven-drying. To remove effects from different ash contents in the differently preserved biomasses, which is of relevance as one of our goals was also to recover carbon-based components, the contents of protein, alginate and fatty acids (i.e. the most important compounds for biogas production) were calculated also on an ash-free basis (Table S1, Supplementary material). The overall trends regarding significant changes in these compounds in response to the different preservation methods as compared to freeze- dried biomass were similar as with ash included. However, exceptions were that the reduction in protein content during sun-drying was not significant and that the contents of alginate and fatty acids were significantly reduced during freezing at − 20 ◦C and oven-drying,
respectively, when expressed on ash-free basis.
3.3. Effects of preservation method on biomass processing
Biomasses from the different preservation methods were taken to biorefinery processing and benchmarked against frozen − 80 ◦C and
freeze-dried biomass, which represent less invasive methods of wet and dry preservation, respectively. For all the biomasses, the pH was determined as it can affect the processing protocols. Both freeze-dried and frozen − 80 ◦C biomass had a neutral pH, 7.0 ± 0.1 and 6.9 ± 0.2,
respectively (average ± standard deviation from triplicates are given). Also, after oven-drying and freezing at − 20 ◦C, the pH was maintained at
7.0 ± 0.1 and 6.8 ± 0.2, respectively, whereas, the pH of the sun-dried biomass had slightly decreased to 6.3 ± 0.1. As expected, the ensiled biomass (batch 2) had a substantially lower pH, 4.4 ± 0.0.
3.3.1. Protein recovery
Seaweed proteins may have a great potential as new food ingredients given the steadily increasing interest in sustainable, and preferably vegetarian, protein sources for food production. We recently showed promising results when applying the pH-shift process to freeze-dried red, green and brown seaweed; especially in that the isolates became highly concentrated [40,54]. In this study, results show that the biomass pre- treatment method had great effects on the protein yield in the pH-shift process (Table 7). Freeze-dried biomass resulted in the highest amount of isolated proteins per amount of ingoing biomass, followed by oven- dried biomass and then frozen biomasses (− 20 ◦C and − 80 ◦C). As
shown in Table 7, the higher recovery with freeze-dried biomass was not due to higher protein solubility. Instead, it was due to higher recovery of supernatant in the solubilization step caused by the very fine particles formed in milling of freeze-dried biomass. This gave a smaller sediment in the first centrifugation compared to the other biomasses; thereby
Fig. 2. PCA for different preservation methods on A. sugars and B. fatty acids.
Table 7
Results from the extraction of proteins using the pH-shift process. Protein solubility at pH 12 is expressed as protein concentration in the first supernatant divided by the protein concentration of the initial algae-in-water homogenate (×100). Protein yield is expressed as total protein in the isolate divided by the initial biomass dry weight (DW). Also, the relative amount of essential amino acids in the protein isolates is given. The pH-shift process was run in duplicate, and protein analyses from each experiment in triplicate. Data show mean values from the two experiments ± (max/min) / 2. Amino acid analyses were performed in duplicates on protein isolates. Significant differences according to ANOVA (p < 0.05) are shown with different letters for protein solubility and yield, respectively.
Preservation method
Frozen − 80 ◦C Freeze-dried Sun-dried Oven-dried Frozen − 20 ◦C Ensiled, batch 2 Protein solubility (% of total protein) 82.5 ± 0.2a 82.5 ± 3.0a 62.1 ± 10.0b 83.4 ± 3.2a 80.7 ± 0.3a 31.3 ± 2.9c
Protein yield (mg g−1 DW) 12.9 ± 0.9c 21.6 ± 0.1a 7.3 ± 0.4d 16.2 ± 1.3b 14.7 ± 0.1c 7.0 ± 0.1d
retaining less of the soluble protein phase [28].
The protein yield was significantly lower with ensiled and sun-dried biomasses, which agrees with the lower solubility at pH 12 for these two biomasses. Especially the ensiled biomass had a very low solubility, which could be due to soluble proteins being lost into the effluent liquid generated during the ensilage process. In the sun-drying process, a similar argument could be made as there is an initial drip of liquid from the biomass when it is hung to dry, which could contribute to a loss of soluble proteins. Another reason for the lower yield with sun-dried biomass could be the formation of protein cross-links due to the harsh outdoor conditions, yielding e.g. lipid radicals or carbonyls, which can initiate cross-linking of proteins [55]. Lipid oxidation was confirmed by the large PUFA losses during sun-drying (Table 6). Sun-drying requires a low amount of energy but indeed it gives a minimum amount of control on drying rate and temperature and it is strongly dependent on the weather and the length of the day [4]. It was previously shown by Young [56] that the uncontrolled conditions under drying; not least sun-light, can denature different kinds of proteins in seaweed, which might explain why the proteins of the sun-dried seaweeds in the current study resulted in a lower protein yield.
The higher protein yield obtained using oven drying (16.2%) compared to sun-drying (7.3%) could be due to the faster drying ki-netics, with hot-air convection drying most likely being more efficient in inhibiting the endogenous enzymatic breakdown of proteins [3]. Wong and Cheung [1] also suggested that the elevated temperature employed in the oven-drying can damage the seaweed cell walls more intensively than sun-drying, which might facilitate protein extraction. Both frozen types of seaweeds, − 20 ◦C and − 80 ◦C, resulted in significantly lower
protein yields (14.7 and 12.9%) as compared to oven-dried biomass (16.2%), despite similar protein solubilities. Our results differed from those of Wong and Cheung who compared protein extractability from three Sargassum species subjected to oven drying at 60 ◦C or freeze-
drying; in their study oven-drying improved the protein extractability compared to freeze-drying, while protein from freeze-dried samples displayed significantly better physicochemical properties [1]. Among the reasons for discrepancies with our results, it could be that they added 2-mercaptoethanol to aid the protein solubilization at pH 12 which breaks e.g. disulphide bonds, and they used solid ammonium sulphate to induce precipitation. Although the protein yield in the pH shift process differed substantially between the biomasses, the relative amount of essential amino acids in all isolates were very similar; 48–52%, showing that a product with similar nutritional properties was produced, but in different quantities.
3.3.2. Crude alginate recovery
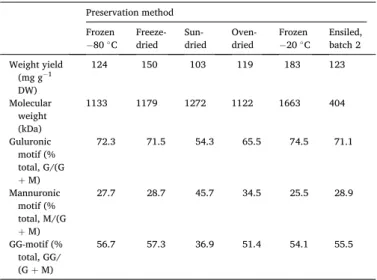
Alginate is a core component in Saccharina biomass and commer-cially extracted and sold for use as a gelling agent and consistency maker in food, textile, biomedical, and cosmetic applications. As such, high molecular weight and G content are key ‘quality’ parameters contrib-uting to mechanically more stable gels. The extraction method applied in this study is different from the one established in commercial pro-duction. We used our in-house developed method [42] based on extraction with the chelating salt sodium citrate, which keeps the pro-cessing liquid close to neutral and, hence, causes less degradation than the commercial method based on extraction with sodium carbonate [57]. This explains the generally very high molecular weights recorded for the isolated alginate fractions (Table 8). The recorded molecular weights should however not be interpreted as absolute values as they are obtained with SEC in relation to a calibration standard compound. The calibration standard, the neutral polysaccharide pullulan, differ in terms of hydrodynamic volume in the eluent to the charged alginate samples causing the recorded molecular weights to deviate from the true values. Still, internal comparisons can be made and it is clear that one sample stands out from the others: the alginate extracted from ensiled biomass had a significantly lower molecular weight than all other samples. As discussed previously, the pH of the ensilage was in the range of 4.
Clearly, the acidity of the ensilage is more detrimental to the alginate than any of the other preservation method conditions. This was expected considering the documented susceptibility of alginate to degradation under acidic conditions [22].
As for the molecular composition of alginate, particularly the G:M ratio (Table 8), it seemed to remain fairly stable around 70:30 regardless of the preservation method, with one notable exception. Sun-drying of biomass caused the G:M ratio to shift with a preferential loss of G and GG sequences. This is not preferred from an application point of view.
3.3.3. Biogas production
In seaweeds, a mixture of several sugars and sugar acids are present, which is more suitable for biogas production, as in this process a mixed microbial culture is used as compared to fermentation with conventional microorganisms, e.g. ethanol from glucose by yeast [26]. Additionally,
Table 8
Extraction yield of dry crude alginate from single runs and molecular weight and GC content of the crude alginate.
Preservation method Frozen
−80 ◦C Freeze- dried Sun- dried Oven- dried Frozen −20 ◦C Ensiled, batch 2 Weight yield (mg g−1 DW) 124 150 103 119 183 123 Molecular weight (kDa) 1133 1179 1272 1122 1663 404 Guluronic motif (% total, G/(G +M) 72.3 71.5 54.3 65.5 74.5 71.1 Mannuronic motif (% total, M/(G +M) 27.7 28.7 45.7 34.5 25.5 28.9 GG-motif (% total, GG/ (G + M) 56.7 57.3 36.9 51.4 54.1 55.5
Fig. 3. Methane yields based on volatile suspended solids (VS, black bars) and dry weight (DW, open bars) of preserved biomass, with averages from triplicate digestions shown with standard deviation given as error bars. Significant dif-ferences according to ANOVA (p < 0.05) are shown with different letters for yields based on VS and DW, respectively.