Developing Action
Plan for Inventory
Management
!
PAPER WITHIN Final Project Work in Industrial Engineering and Management AUTHOR: Anton Truong & Emelie Hong
TUTOR: Yinef Pardillo Baez JÖNKÖPING May 2019
Acknowledgements
The work has been carried out at the School of Engineering in Jönköping in the subject area Industrial Engineering and Management. The work is a part of three-year Bachelor of Science in Engineering programme.
Many thanks are given to our supervisor Yinef Pardillo Baez for the great input, guidance and support throughout the study. We would especially like to thank Axelent AB for letting us perform our thesis research at the company and the purchase manager for continuously supporting our work. The authors take full responsibility for opinions, conclusions and findings presented.
Supervisor: Yinef Pardillo Baez Scope: 15 credits
Abstract
Purpose: This paper approaches the improvements of how to efficiently improve the inventory management within SME. The purpose of this study is to optimize the inventory based on ABC-classification and provide an action plan based on PDCA.
Method: The study used a case study in Axelent AB. To understand the current inventory management, unstructured interviews and a semi-structured interview were performed. The data collection has been the literature interview and also documents provided from the company. The authors collected both primary and secondary data in order to answer the research questions.
Findings: The current state of analysis shows that the company does not have any structure way of efficiently improve the inventory management. Currently the case company does not have any efficient inventory management, thus they need a way to improve it. Inventory Control technique has been used on 436 out of 4000 products from the case company. The results of ABC-classification provide knowledge of what items to prioritize in order to reduce costs and keep low inventory. The authors did a subclassification of each A, B and C-category based on the annual quantity. The result was that majority of the products were stocked in high volume which was identified as a critical factor. This study also provided an action plan of procedures to the case company.
Implications: Inventory Management has recently been a focus to achieve competitive advantage. There has been previous lack of studies within SME related to inventory management and PDCA. This study is implicated for the case company only, but also supports other relevant or further studies of how improvement to inventory management within small medium enterprises.
Limitations: The study had several limitations. The study has been focusing on 426 products which does not give an overall result within inventory management. The authors were not allowed to show sensitive data such as cost of products. The case study has been performed in the inventory of Axelent AB with focus in the input and output.
Keywords: Inventory Management, Inventory Control, ABC-classification,, action plan, Plan-Do-Check-Act, Small Medium Enterprise
Content
1 Introduction 1
1.1 Background 1
1.1.2 Company’s background 1
1.2 Problem formulation 2
1.3 Purpose and research questions 2
1.3 Scope & Limitations 2
1.4 Disposition 3
2 Method and Implementation 4
2.1 Work process 4
2.2 Approach 5
2.3 Design 5
2.4 Literature review 5
2.5 Data collection 6
2.5.1 Primary & Secondary Data collection 6
2.5.2 Interview – Unstructured & Semi-structured approach 6
2.5.3 Company data 7
2.5.4 Analysis of qualitative and quantitative data 7
2.6 Research Quality 8
2.6.1 Validity 8
2.6.2 Reliability 8
3 Theoretical Framework 9
3.1 Connection between research questions and framework 9
3.2 Part 1: Efficient Inventory Management Goals 9
3.2.1 Small medium Enterprise 9
3.2.2 Inventory Management 10
3.2.3 Total cost 11
3.2.3 Capital tied up 12
3.3 Part 2: Inventory Control technique 12
3.3.1. ABC-Classification 12
3.3.2 Planning Inventory 13
3.4 Part 3: Action Plan 14
3.4.1 PDCA (DEMING CYCLE) 14
4 Findings and analysis 16
4.1 Situation Assessment 16
4.1.1. Suppliers 16
4.1.2 The current state of inventory management 16
4.1.3 Sample of the products 16
4.2 Lead time 17
4.3 Findings and analysis of ABC- classification 17
4.4 Findings and analysis of PDCA-cycle 21
5 Discussion 25
5.1. Discussion of Findings 25
5.2. Discussion of method 27
6 Conclusion and Recommendations 28
6.1 Further research 28
References 32
1
1 Introduction
The first chapter will consist of background of the study. Continuing from this, the background will be followed up by the purpose of the study as well as research questions. Delimitations will be clarified and finally a disposition will be detailed on how the authors will build up the structure of the study.
1.1 Background
Today the industries are facing difficult challenges to keep maintain a competitive advantage. As more industries are growing and becoming larger, it is essential to focus on their supply chain, which means the control of material flow from suppliers until end customers. Narrowing it down, the importance of capital tied up on stock and overall costs cannot be overlooked as it plays a major role for industries (Erlandsson, Duhan, 2008., Axsäter, 2006). In fact, to be able to control these factors can give a strategic competitive advantage for organizations. According to Porter five forces, to have a low cost but still sell the products for a normal price is an effective way of gaining competitive advantage. Furthermore, it is important to recognize inventory management as one of the major strategic importance for industries (Porter, 1998).
When it comes to manufacturing industries, it is essential to be efficient with capital tied up resources, shorter lead-time but high quality and less finished goods waiting in inventory. In a recent literature review, different explanation of the field of area is explained and it can be used to apply for a real-life issue. Not only is it important to realize the importance of inventory control, but also inventory management. Manufacturing industries, Small-to-medium enterprises (SME) today are facing difficulties to remain competitive in marketplace due to high competition and there is lack of study of inventory management efficiencies within SME sector (Plinere, Borisov, 2015., Axsäter, 2006., Chan, 2017., Mellat-Parast, Spillan, 2014).
The benefits of efficient inventory management results in lower total cost while production and transportation processes will continuously increase flexibility and decrease inventory level. Previous researches have shown that putting focus and effectively improving inventory management and inventory control will reduce total costs for companies (Axsäter, 1990). ABC-classification is a common technique used to prioritize products and reduce overall costs, inventory level and capital tied up on stock (Chen, 2011., Sohail, 2018., Tanwari et al., 2000).
To have an efficient inventory management, a plan with consistent sequences is needed. One specific approach is Plan-Do-Check-Act (PDCA) which is a management technique aimed at continuous improvement. This action plan is furthermore explained as way to implement an improvement plan of improving inventory management (Jagusiak-Kocik, 2017., Springer, 2000).
1.1.2 Company’s background
The company gave permission for this study to mention its name.” Made in Hillerstorp. Works
Worldwide.” The head office of the company is placed in Hillerstorp. Axelent Group consist of three
different divisions, Axelent AB, Axelent Engineering and Axelent software. The industry is manufacturing safety products for various companies in 52 different countries globally. The industry provides safety solutions to different companies that are working mainly with production and manufacturing too. Furthermore, they also provide a user-friendly application that allows customers to get access to an overview of what products are needed for customers. The head office has in total 130 employees and an annual revenue of 450 million SEK.
SME need to emphasize the challenge to maintain competitive in the market as they are gaining more global presence. The priority for the company is to become more cost efficient (Mellat-Parast, Spillan, 2014). Axelent wants to continuously improve their processes and become more efficient in terms of inventory management.
In the current situation, the company has control and overview of what is happening in the inventory to a certain degree but would like to become even more efficient in terms of costs. One of the company strengths is speed, implying the focus company have means to deliver supplies in fast pace.
2
To satisfy customer needs, the company try to reduce the lead time by sending the order to the customer the same day as the order has been placed. This shows that the company is utilizing a strategy of customer satisfaction.
1.2 Problem formulation
The problem with SME today is that they have challenges maintaining competitive in the market, therefore it is essential for SMEs to focus on certain areas in the company to maintain their position (Chan et al., 2017, Kharub, Mor, Sharma, 2018). Mellat-Parast and Spilla (2014) proposes that a significant focus on logistics aspects gives a cost-efficient advantage for companies without limitation of it being a small medium or large enterprise. In addition, previous studies identified inventory management as challenge many companies are facing (Plinere, Borisov., 2015, Shen, Deng, Lao, Wu., 2017, Sohail, 2018). A general issue which SMEs’ are facing is tight focus on inventory management and it means to lower the total costs in inventory and a reduced investment in capital tied up stock (Erlandsson, Duhan 2008., Chan, 2017). The case company is currently having difficulties managing their inventory management in an efficient way. The company has too high capital tied up on their inventory and want to create an efficient way of improving this problem. Axelent fulfills the criteria of being a SME and having issues with inventory management, thus chosen as case company for this study. The company wants to classify their inventory based on ABC technique and further classify products with an additional parameter. Classifying individual products based on their annual cost and volume gives the company an advantage to see what products they need to put effort and focus on, thus reducing the inventory level, lead time and overall costs. The problem faced by Axelent AB can be considered as an example for other companies which has similar situation.
1.3 Purpose and research questions
The purpose of this report is to develop an action plan to increase efficiency of inventory management, thus contributing to the company and future research in this field. Due to limitation of efficient inventory management within SME sector in accordance to the background, mitigating the knowledge gap between improving inventory management within SME was needed.
To fulfill the purpose, it is important to understand current state of art of inventory management. The study will investigate how the company inventory management system is working presently. Understanding how the company is working with their inventory management allows possibility to look at the flaws and then introduce new improvements. Therefore, the first research question is:
•! How does the company’s inventory management currently work?
The company need a more efficient way to see which products need a larger focus. A common technique, ABC-classification, is deemed necessary to use to create an improved inventory. Using the technique, the case company can have a better overview of prioritized products and descriptive information of how to approach each product class with appropriate solution. With this, the outcome of this study could present a sophisticated way to balance the product groups. Thus, the second question is:
•! Which are the item groups based on ABC-classification and howcan the different item groups efficiently improve the inventory management?
Once the inventory management has been detailed and inventory has been classified, an action plan with procedures will be proposed to the company to improve their inventory management. Hence the last research question is:
•! Which are the actions in the PDCA-cycle to efficiently improve inventory management?
1.3 Scope & Limitations
The company’s interest is limited to 436 products out of total 4000 products. These 436 products have most frequent demand according to the company, but with the ABC-analysis it is possible to narrow it down even further on which exact products to focus on. Throughout the study, the purchase manager
3
of the company will support the work and provide relevant information. The case study will be performed in Axelent AB’s inventory with the focus on the products input and output. The limited location will be based in Hillerstorp. Sensitive data will only be analyzed and not presented as an agreement with Axelent AB has been made.
1.4 Disposition
The work of the study will be divided into following sections for the reader to see a clearer structure of the work:
Chapter 1 – Introductory section: The first section will cover up the background, explaining how
the field of area started and became more relevant as time passed on. Furthermore, it will explain what current challenges are being faced today by companies and how the research questions will be conducted with the elaboration of challenge as basis.
Chapter 2 – Method and Implementation: The second section will emphasize use of methods in
this study. Techniques used to collect data is also presented in this chapter. Lastly, validity and reliability will be explained.
Chapter 3 – Theoretical framework: In this section, the authors will explain the theoretical
framework behind the study and reasoning of its importance for this study.
Chapter 4 – Findings & Analysis: The following section will contain result from the study and an
analyze of the results.
Chapter 5 – Discussion of findings & methods: Discussion of the findings will be used to answer
the research questions. Methods will also be discussed.
Chapter 6 - Conclusion and further research: Furthermore, the conclusion will propose what
factors the company should focus, and the future research will elaborate possible research followed up by this study.
4
2 Method and Implementation
This chapter will present working process of the study, research approach and design of study. Data collection techniques, validity and reliability of the study will be presented as well.
2.1 Work process
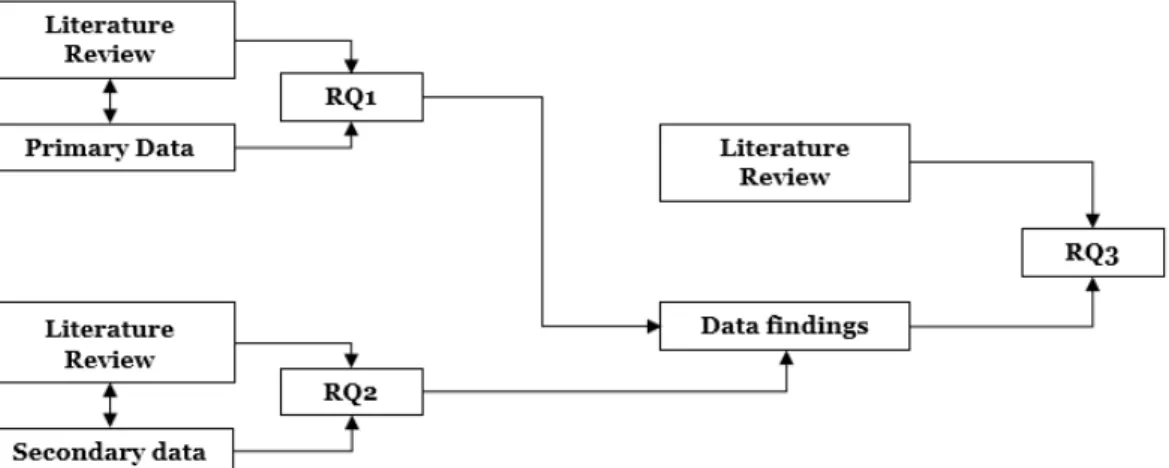
When the study was initialized, a literature review was performed simultaneously to understand the current knowledge gap as meeting the focus company to understand the problem. Upon setting the purpose of the study, data collection was gathered through interviews and analysis of company data. After understanding company problem and current literature, the collected data was analyzed in regard to theoretical framework. This study took in regard to only analyze the company data. This led to discussion of findings, methods and lastly a conclusion was drawn. The study’s working process is seen on figure 1.
Figure 1. Working process (Own elaboration).
To fulfill the research questions and purpose of this study, techniques have been performed to gather and analyze data. When forming RQ1, literature review was needed to investigate how inventory management works SMEs’. It was later answered by using techniques to collect primary data. RQ2 required current literature of ABC-classification to understand its impact on inventory management. This study essentially used secondary data, given directly from the focus company to answer the second RQ.
The last RQ also needed current literature of how PDCA-cycle improves inventory management as it enabled to critically think whether the actions in the cycle would be suitable or not for the focus company. The findings of RQ1 and RQ2 was also determining the procedures of the action plan that will be developed later. Connection between theories and data are presented in figure 2.
5
2.2 Approach
Research papers has different approaches. This research paper will focus on a deductive approach to generate a result for this study and the company. The reasoning behind this approach is to generate answers by using generalized methods and theories used by previous researchers and a deductive research approach is also defined by Welman (2005) as a way of moving from general to something specific. A case study will be the main method followed by research technique as interview and data collections such as company’s data and literature review.
2.3 Design
The design of this study is mainly composed of qualitative characteristics and quantitative. This paper focus on a case study as the fundamental method as it analyzes in-depth on a single organization or an individual and is commonly used when meeting following requirements (Bryman, Bell, 2003., Easterby-Smith, Thorpe, Jackson, 2015):
· The case study is being practiced at one single specific location. · One single organization
· One person
It is important to consider why a case study is relevant for this study. Williamson (2002) and Gerring (2017) explains that a case study will not be as effective when a situation or phenomenon is already well-understood but is rather effective when it comes to dynamic areas or a need of more understanding of how and why processes occur.
Furthermore, Yin (2012) also backs up the use of case study as relevant when its applied to produce answers to “How” and “What” questions. When it comes to descriptive/explanatory problems and research questions, it is highly suggested to use case studies. On the contrary, when facing different situations, other approaches than case study can be used (Yin, 2012). Consequently, the aim of this study was to study a single company, therefore the case study was deemed appropriate to use.
Axelent AB is acting as a single case for this study as they meet the requirements of being an SME and has inventory management issues. As the purpose of the study was to develop an action plan and introduce a better structural inventory management, it fitted with the focus company’s context. Furthermore, this study will also use qualitative approach as it is relevant for “How” questions (Easterby-Smith et al., 2015). More studies back up the use qualitative practices in case study to collect data with techniques such as observation and interviews (Bryman, Bell, 2003).
2.4 Literature review
The objective of literature review is essentially to learn from previous research on specific topics such as this case regarding Inventory Management within SME. The use of literature review is to emphasize better on what current studies shows and other relevant insights (Jesson et al., 2011., Petticrew & Roberts, 2006). The literature review also helped out to identify relevant theories. In addition, literature review aims to learn from certain topics and peer-reviewed articles to gain more knowledge about the field (Easterby-Smith, Thorpe & Jackson, 2015). According to William (2002) a logical framework is based on a thoughtful discussion from the literatures. Further background and context are built for the study and make it easier for the researcher to understand the problem as well as the content.
As previously mentioned, most of the information in this study is based on articles and peer-reviewed journals. The search for relevant literature was performed during January 2019 to May 2019. The literature was mainly acquired from Jönköping University’s library collection and online databases such as Emerald Insight, Springer, ScienceDirect, ProQuest Central, National Productivity Council, SAGE and Primo. Physical literatures from different researchers and authors that publishes scientific articles within essential field was also used to strengthen the fundamental basis of this study. It is also important to highlight that some that some previous and existing studies may not be up to date, as they have a time span between 2000-2018. Many of the studies have not explored SME sector as well.
6
2.5
Data collection
Different techniques have been used to answer the research questions. Interview was primarily used to collect primary data in regard to RQ1. Data analysis of the company’s data was needed as it contributes to RQ2, RQ3 and acted as secondary data.
2.5.1 Primary & Secondary Data collection
The data was mainly provided by the company. It is essential to distinguish primary and secondary data. Persaud (2012) is describing primary data as a source where researchers have collected in firsthand by using various techniques such as interview. In this study, the primary data is mainly collected through interview technique with the company purchase manager. This gives this study advantages such as validity.
Salkind (2010) further explains that secondary data has previously been collected and processed. Secondary data can basically be distinguished as the data used by other researchers or people that are not originally a part of the acquisition of data. This makes the secondary data substantially solid as it has been processed and the secondary data are often represented by academic researchers. Another advantage with secondary data usage is the cost-savings and efficiency of acquisition of processed secondary data as it is easier to access global data bases through technology (Salkind, 2012).
2.5.2 Interview – Unstructured & Semi-structured approach
An interview is a technique for collecting qualitative data and is often used in case studies (Williamson, 2002). Advantages with interviews are that the interviewers are freely to take control of the context, higher chance of receiving actual answers from respondents and can be further developed to more specific questions. An unstructured interview for example allows interviewers to freely adapt more questioning and can proceed to continue with follow up questions (Williamson, 2002). Face-to-face meetings during interview was used which give the respondent higher level of motivation. Interviews provide much richer data than questionnaires. Another advantage is the ability to check with the respondent if the questions are clear and the respondent can interpret the data from same perspective as the authors. However, one disadvantage with face-to-face interviews is time-consumption due to geographical location of the respondent (Williamson, 2002). Due to the distance, phone interviews were used but mostly unstructured interviews.
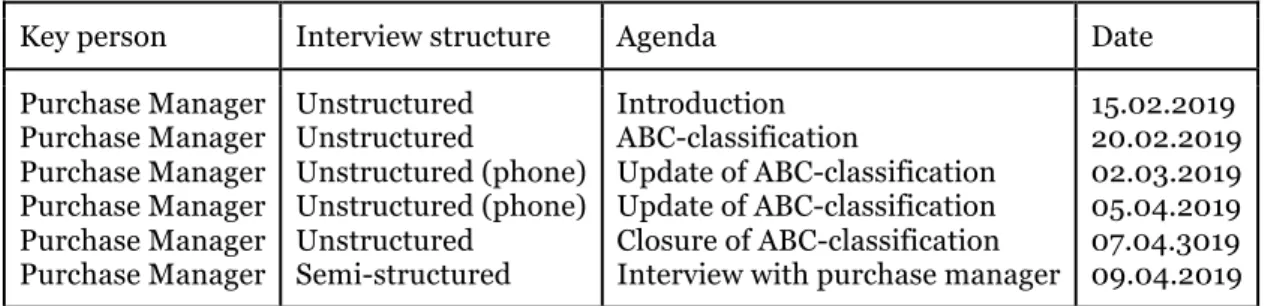
The purpose of this technique was primarily to collect primary data which was later analyzed and used to answer the RQ1 and understand the problem area. This in turn, further contributes how inventory management within SME works. The study followed the structure of using an unstructured interview first to understand the topic and field, then proceeded with semi-structured technique to ask follow-up questions related to the problem as shown in table 1. Questions were prepared beforehand for the respondent through mail before the semi-structured interview occurred. This was essential for the respondent to prepare information and data to the semi-structured interview. During this study, spontaneous questions were sent to the respondent to collect additional information. Table 1 further explains when the authors had interviews with the respondent, what type of structure and the agenda of the meeting. The dates have also been notified. The semi-structured interview was essential to analyze the current state.
Table 1. Interviews
Key person Interview structure Agenda Date
Purchase Manager Purchase Manager Purchase Manager Purchase Manager Purchase Manager Purchase Manager Unstructured Unstructured Unstructured (phone) Unstructured (phone) Unstructured Semi-structured Introduction ABC-classification Update of ABC-classification Update of ABC-classification Closure of ABC-classification Interview with purchase manager
15.02.2019 20.02.2019 02.03.2019 05.04.2019 07.04.3019 09.04.2019 (Own elaboration)
7
2.5.3 Company data
Company data has been essential to conduct an ABC-Classification. The data has contained detailed information from the ERP system. It acts as the secondary data in the study and the detailed information consists of annual quantity, annual cost, price per quantity, reorder points, lead time and economic order quantity, which has been calculated already in the ERP-system. The analysis of the secondary data was required to understand how their inventory should be classified in regard to literature review. The data was easily accessible by withdrawing information from Axelent’s ERP-system and all information was up to date. As the data was handed directly to the authors, its reliability can be perceived as low. This study did not perform any specific steps to achieve the company data, thus might result in difficulties for future studies to collect the exact same information.
According to Yin (2007), there are both advantages and disadvantages using company’s documents. The advantages refer to the word’s stability, precision, discretion and coverage. Company’s documents are stable and can be reviewed anytime. Precision means the documents contain same information based on the time of the data and relevant references. Discretion stand for that the data is form before the study which means it is not influence by it. Coverage means anything can be written down on a document. The disadvantage is that is challenging to collect data and the right documents might not be obtained (Yin, 2007).
2.5.4 Analysis of qualitative and quantitative data
This study has been collected both qualitative and quantitative data. Furthermore, a qualitative interview was conducted to get an overview of how the current inventory management works. According to Williamson (2002) there is no specific rules of how to do a qualitative analysis. Instead there are tools and technique to interpret data. In this case an interview. There as some steps to help to analyze the qualitative data but it not necessary to follow it strictly.
1. Transcribe the data
•! This means to translate the interview into words. In this case the authors recorded the interview and then transcribed into words.
2. Read through the transcript in order to familiarize yourself
•! It is extremely important to understand what the interview is about in general before going into details. While reading a researcher might take interesting notes. It can be written in separate documents which can be useful in analysis and discussion.
3. Categories the data
•! Categorizing has an advantage of helping the researchers to think in depth about their data. In this case the authors divided the questions and answers in different categories: background of purchase manager related to Axelent AB, Suppliers’ relationship and Inventory Management & ABC-classification
4. Playing with ideas
•! This step can be done in any stage of the analysis. This step means basically to take words and phrases and think of the possible meanings of it. This step is included in the analysis part. 5. Writing memos
•! Memos is another name of documents. Basically, writing down the ideas of the interview. 6. Conceptually organizing the categories
•! This step involving thinking of the relationship with each category. 7. Undertake words searches
•! Not an important step. It is common that one particular word or phrase occurs often, and a simple word processor can be used in case.
8 8. From tentative theories
•! This step might occur in step 5 when the researchers starts to see connection with their ideas and relevant theories. In this study the authors did research before the interview to understand the subject.
9. Ask questions and check hunches
•! Before completing the report, the researchers should check the feasibility of the theories. To complete this the researchers should support the theories with relevant references.
This study includes analyzing quantitative data from the company’s ERP-system. This data was later used to classify company inventory. See figure 6 of an example of quantitative data.
2.6 Research Quality
The following section will describe validity and reliability of the study as they are essential for this study to be deemed as valid and reliable for future reference.
To evaluate the quality of the study, it is important to know the validity and reliability of respectively collected data (Welman, 2005). When measuring or studying data which has been collected, it is essential to know to which extent or how accurate a finding is in a situation. If a research method is measuring what the authors claims, then is it considered valid. On the other hand, a reliable finding is determined as reliable when able to be repeated by anyone (Welman, 2005).
2.6.1 Validity
Patel and Davidson (2015) explains that a study is recognized as valid if the study gives what it is intended to (Patel et al., 2015). In order to make this study valid, same techniques from current literature and previous studies was used to collect primary and secondary data. This study increases its validity if it manages to measure or answer the research questions and purpose as intended.
2.6.2 Reliability
For a study to be valid, it must also be reliable. Previous literature proposes that a study is reliable if other researchers manages to achieve same result by replicating the same steps (Welman, 2005. Patel et al., 2015). According to Shenton (2004), a study also needs dependability. It implies that if same study was to be repeated within same field with same techniques and same respondents, it would produce same results (Shenton, 2004). The reliability and dependability of this study is mostly based on the primary and secondary data which has been collected by interview and data analysis of company data. The interview questions have been detailed and data analysis of company data has been presented in the later chapters. That should present a high reliability of this study.
9
3 Theoretical Framework
The theoretical framework has been divided into three parts: Efficient Inventory Management Goals, Inventory Control and Action Plan. Each part has relevant theories and concept which will be used in this study.
3.1 Connection between research questions and framework
During the whole process of the study, the authors essentially reviewed existing literatures and previous studies to understand the study field and theories that are relevant for the research questions.
RQ1: “How does the company’s inventory management currently work?”
· Part 1: Efficient Inventory Management Goals
The theoretical background for the first research question mainly involves the understanding of inventory management is and how it impacts the effectiveness of SMEs’. This enables critical thinking of authors by understanding how it benefit companies with consistent minimum stocks and investments in inventory items and how the current literature will help the focus company (Singh, Verma, 2018., Nagle, Fisher, Frazier, McComb, 2018).
RQ2: “Which are the item groups based on ABC-classification and howcan the different item groups efficiently improve the inventory management?”
· Part 2: Inventory Control
Existing literature is essential for RQ2 as the authors need to understand how previous studies applies inventory control techniques and how it helps improving inventory management. The theory will contribute to RQ2 by introducing the technique and how it will impact the company’s performance.
RQ3: “Which are the actions in the PDCA-cycle to efficiently improve inventory management?”
· Part 3: Action Plan
Previous studies suggest sequences of activities to improve inventory management. Thus PDCA-cycle has been used as it in general works with continuous improvement of management. The theory will explain why the technique is used on management, hence detailing sequences to improve inventory management in the SME.
3.2 Part 1: Efficient Inventory Management Goals
According to Chan et al. (2017) there are several factors that impacts efficient inventory management but there are currently also lack of research related to the subject in regard to SME. When SME formulate their strategy mostly SMEs does not treat Inventory Management as a strategic activity (N.Rajeev, 2008). The goals of efficient inventory management goal are minimizing the inventory level and reduce the total costs and capital tied up. Therefore, Part 1 consist of SME, Inventory Management and anything that is related to it.
3.2.1 Small medium Enterprise
Characteristics of Small Medium Enterprise is explained to understand the characteristics of it. SME is a common term to use worldwide and there is no clear definition. Although EU has defined SME as an entity of less than 250 employees with no more than 50 million euros as an annual turnover and the net has to be less than 45 million euros (Law, 2o16).
10
3.2.2 Inventory Management
Current literature of Inventory Management within SME is inevitable limited; however, the topic of inventory management gained its spotlight as the first decision model to support decisions in regard to inventory replenishment and aims to create a long-term benefit (Ye, Ge, 2018). Rajeev (2008) details the use of inventory management in regard to small medium enterprises as a practice to support them by minimizing inventory costs, keeping low inventory spacing, low inventory which results in lower capital tied up on products and ensure right quantity are available at right time. Recent case studies have been carried out on inventory management, although not in SME-sector specifically. Nevertheless, several of these case studies have identified ABC-classification as key practice of improving inventory management. More of the practice will be explained later (Chu, Liang, Liao., 2008., Plinere, Borisov, 2015., Sohail, 2018., Onwubolu, Dube, 2006).
The literature review of previous studies identified crucial objectives with a good inventory management (Singh, Verma, 2018., Nagle et al., 2018., Nemtajela, Mbohwa, 2017., Chan et al., 2017):
•! Low inventory level.
•! Reduce holding cost by avoiding overstock but maintain right stock at same time for important items.
•! Low capital tied up on stock. •! Ensure minimized overall costs.
A company that manages to put effort on inventory management is essentially able to compete with existing competitors and also grow in the long-term (Nemtajela et al., 2017., Singh et al., 2018).
Effective inventory management decrease overall costs by reducing inventory level, which decreases holding costs, reduces chances of overstock and capital tied up on stock. But in real-world context, low level of inventory is not always ideal. Due to complexity of inventory management, it might end up with lost sales due to low inventory volume as production rate is not corresponding to market demand. Therefore, it is important to know which products should focus on smaller amount of volume while keeping right inventory volume for prioritized products (Shen et al., 2017., Chan et al., 2017., Erlandsson, Duhan., 2008).
The inventory consists of three important aspects according to Bowersox (2013): “The inventory policy drives inventory performance. The two key indicators of inventory performance service level and average inventory. “
Inventory Policy
Inventory policy is defined as means of guideline to what to purchase or manufacture. These guidelines are used also includes concert of geographical positioning of inventory positioning. The guidelines also elaborate whether companies should use a centralized inventory, which means one inventory to cover up a larger area (Bowersox et al. 2013).
Service level
Management need to set a performance target, thus service level. The purpose of service level is to provide high quality to customers by increased inventory or as in Axelent’s case, a fast and reliable transportation of shipment (Bowersox et al., 2013).
•! The performance cycle defines as the time between placing an order and the receipt of shipment.
•! A case fill rate means in percent how many cases did successfully shipped in request. For example, if the case fill rate is 98 percent it means that on average 98 cases out of 100 are shipped as requested.
•! The line fill rate is the percent rate of orders lines completed. •! Order fill defines in percent of completing the customer orders. Average inventory
An inventory is where the materials, components and finish product are stocked. The work processes occur in inventory and the average inventory means the mean of the certain time of period (Bowersox et al., 2013).
11
3.2.3 Total cost
Total cost defines as ordering cost, transportation and inventory carrying cost. The total cost (logistic costs) has directly an impact on the company’s profit (Jonsson & Mattsson, 2005).
Ordering cost
Order cost includes four different components (Jonsson & Mattsson, 2005):
· Changing/ adapting cost refer to the time when the machines adjust to a new manufacturing order. · Order handling cost includes in the purchasing process which refer to handling of order such as planning and economy.
· Material handling cost refer to the goods reception, arrival reception, loading goods in the inventory and material movement in inventory.
· Cost of losing the capacity means the cost of wastage and the time of starting a new batch. Internal transportation cost
The internal transportation cost is mostly included in the inventory carrying cost and could be for example assembling packaging and transporting products internally (Lumbseden, 2006).
Inventory Holding Cost
Holding costs is purely based on inventory factors such as space rent costs, decision making, damages and theft (Nemtajela et al., 2017) The expense is calculated by multiplying annual inventory carrying cost in percent with average value. For example, if the inventory carrying cost percentage is 20 percent and the average value is 1,000,000 SEK the total inventory cost will be 200,000 (0,2* 1,000,000 SEK). Calculating the inventory carrying cost is basic but what represent the percentage is less obvious. The carrying cost percentage will be presented in different cost sections: capital, taxes, insurance, obsolescence and storage. The cost of capital is usually based on the managerial policy while taxes, insurance, obsolescence and storage are commonly based on the specific attribute of the individual products (Bowersox et al., 2013).
Capital
The capital cost percent is determined by the higher management. The capital cost might look different depending on the industry and firm. Firms which mostly use cash will usually hire employees in higher cost of capital percentage. Industry with short life cycle or very high value will probably do the same because hire high cost of capital will give lower inventory (Bowersox et al., 2013).
Taxes
The tax rate various depending on the location. Usually the tax expense is based on inventory value of a specific day or over a period of time. Tax free such as free port status might occur in many local and state authorities (Bowersox et al., 2013).
Insurance
The expense is based on expected risk or loss over time. For example, a very high valued products or hazardous products needs higher protection which gives higher insurance cost. The facility characteristics have also an impact in the insurance cost such as tools for reducing risks (Bowersox et al., 2013).
Obsolescence
The deterioration of a production during a time in the inventory is gives obsolescence cost, for example, obsolescence of a product can be food or pharmaceuticals which expired. The obsolescence cost defines also as financial loss such as a product that is no longer demand or is out of trend (Bowersox et al., 2013).
Storage
Storage cost is related to the product holding cost more than the product handling. The storage cost is indirectly related to the inventory value and more based on the requirements of the specific products. The charge of public or contract warehouses is based on the individual basis (Bowersox et al., 2013).
12
3.2.3 Capital tied up
Capital tied up in stock is essentially money invested in inventory stocks. This will affect the company’s cash flow and payment ability. The material flow in the system has an impact on the profit and affect the company’s capital tied up and it has an indirect and direct impact of such as the delivery service. Calculation of the capital tied up needs to understand and analyze the logistics performance. The average capital tied up represent the total capital in the material flow or is divided into storage, transportation, product-in-process (PA) etc. The capital tied up can also be expressed as absolute numbers, turnover or the average time of slow-moving inventory (Johnsson & Mattson, 2005).
Absolute numbers
The definition of the capital tied up express in absolute numbers is the same as the inventory value. If the company does not have previous data of the capital tied up, the capital tied up can be calculated. The formula is multiplying the average inventory (in quantity per article) with product value per article (Johnsson & Mattson, 2o05).
Turnover
Absolute numbers cannot be used if the company wants to compare the capital tied up with different inventories or departments. Instead calculating the turnover could be another option. The turnover mean as how many times per year the average inventory sold and been replaced. It expressed as the value of the of the total material flow under a certain period, mostly per year (Johnsson & Mattson, 2o05).
The formula for the turnover:
The turnover= annual sales/ average inventory Slow moving inventory
The moving inventory is another expression of the turnover. If the turnover increases the slow-moving inventory decrease and vice versa (Johnsson & Mattson, 2o05).
Slow moving inventory= ((average capital tied up in the flow) * 52)/ delivery value per year= (1 * 52) /turnover
Multiplying 52 is because the formulate wants to be express in weeks.
3.3 Part 2: Inventory Control technique
3.3.1. ABC-Classification
Chu et al. (2008) explained the purpose of inventory management is to make the best decisions in regard to inventory level. In practice, not all inventories can be controlled with equal focus, therefore ABC-classification is used as management practice. Several studies pointed it out as the fundamental inventory control technique that contributes to maximum profit and benefit by classing the products into three classes, A, B and C (Chen, 2011., Plinere et al., 2015, Ravinder, Millstein, Yang, Li, 2014., Sohail, 2018., Chu et al., 2008., Torabi, Hatefi, Saleck Pay., 2012). Identifying the highlights of these studies shows that the inventory classification contributes to a better inventory management by:
•! Implying which products generates most profits. •! Indicates products that generates most costs. •! Classify products and prioritize them accordingly.
•! Keep lower level of inventory if necessary, thus decreasing capital tied up on stock and holding costs.
•! Decrease lead time.
Literature review of ABC-classification is essential as it enables the authors to understand why the technique helps inventory control. The technique essentially follows the 80/20 rules to identify a company inventory. In the current literature, some parameters were identified for the inventory classification (Millstein et al., 2014., Onwubolu et al., 2006., Sohail, 2018):
13
•! A-class are top items with critical priority and constitutes between 10-20% of all items and is responsible for 80% of the total product costs. High costs indicate high generating of capital tied up on stock.
•! B-class are middle class with medium priority and constitutes 20-30% of all items and is responsible for 15% of total product costs.
•! C-class is explained as low priority and constitutes the remaining 50-70% of all items and 5% of the remaining total product cost.
Ravinder and Misra (2014) further explains that ABC-classification have always had the criteria of only looking at the profitability of the products, but later points out there are more criteria to look at such as lead time, inventory holding cost and batch quantities. The benefit of ABC technique applies in many areas for example, material purchasing parts, component parts or product depending on what the company wants to categories. Depending on the company, some might classify their inventory more than three groups. Every company should adapt their inventory system to its own distinctive feature. But all have same principles; highest cost categories in A and require most attention, and C class requires low attention (Tanwari et al., 2000., Ravinder, Misra, 2014).
3.3.2 Planning Inventory
Aside from classifying the different products, an inventory planning is needed. Inventory planning includes the determination of when and how much to order. The factors of when to order is based on demand, uncertainty and the average of the replenishment lead time. Lead time is the time required for a product from an order to be placed and consumed. The lead time could be time required to procure the necessary materials, manufacturing the products, moving products, inspecting time etc. This also means that if a supplier has a lead time of 7 days to prepare raw materials, it also means that the main manufacturer also needs 7 days of supplier ready in order to produce the products as soon as the raw materials reaches the manufacturer. To calculate the best order point, it should be based on the economic order quantity, which will be explained soon (Bowersox et al., 2013).
When to order:
The reorder point explains when it is time to place a new order in terms of units’/ days’ supply. The reorder point is based on the demand and the performance cycle (Bowersox et al., 2013).
The basic formula is (Bowersox et al., 2013): R = D × T
R= Reorder point in units; D= Average daily demand in units
T= Average performance cycle length in days
Another formula with the same outcome if the safety stock is known (Bowersox et al., 2013): R = D × T + SS
R = Reorder point in units; D = Average daily demand in units
T = Average performance cycle length in days SS = Safety stock in units
Economic Order Quantity
Economic order quantity (EOQ) tells how much the company should purchase for its inventory depending on the cost of the, the demand rate and other variables. EOQ is used for minimizing the inventory holding costs and the order costs (Bowersox et al., 2013).
14
The formula of EOQ considers the inventory holding cost including storage, ordering and shortage costs is seen in the figure 3. When using the formula, the demand, ordering and holding costs are assumed as constant (Bowersox et al., 2013).
The EOQ Formula:
Figure 3. The EOQ Formula (Own elaboration). Q= EOQ units
D= demand in units
S= order cost (per purchase order) H= Holding cost (per unit, per year)
The EOQ represent the order quantity that minimizes its total costs related to the holding and ordering cost. The benefit of determining of how much to order the company avoids out of stuck in the inventory and can fulfill all the customer order. The limitation of using EOQ is that ordering and holding costs are constant, which make the formula impossible to use when it comes to seasonal changes, changing customer demand and other changing factors (Bowersox et al., 2013).
Safety stock
A safety stock is necessary to prevent items or products to be out of stock. A safety stock is a buffer that will be used if the demand is higher than expected. Usually the purchase manager calculates how much needs as safety stock. What type of transportation mode might have a factor for example because of the delays and risks of weather change (Storhagen, 2011).
The formula for safety stock is as following:
Safety stock= (delivery time * Annual consumption/ (number of working weeks))
3.4 Part 3: Action Plan
Jagusiak-Kocik (2017) explains that companies within SME should develop action plans or use action plans such as Plan-Do-Check-Act-cycle (PDCA). Thus, a management technique for continuous improvement is needed. Previous study from Prashar (2017) used action plan to detail systematic steps with activities in an SME. Hence, strengthening the authors’ choice of using the practice on the selected company as it is an SME.
3.4.1 PDCA (DEMING CYCLE)
Previous study from from Rikio (2012) explains that PDCA-cycle is often applied in industries when companies are aiming to create a cycle of improvement. In addition, the technique has often been used primarily in quality management, but the use of the practice can be applied when trying to improve management (Qing-ling, Lian-ling, Jun-mo, 2008., Zhao, Pablos, Qi, 2012., Terziovski, Howell, Sohal, Morrisson, 2000., Prashar, 2017). Additionally, the authors identified beneficial traits and when to use the improvement technique accordingly to existing literatures (Singh, Singh, 2015., Zhao et al., 2012, Jagusiak-Kocik, 2017):
•! Align management by introducing clear objectives, thus creating transparency.
•! Create plans or actions to eliminate causes of problems. It leads to a better structure and better training of management.
•! Used when introducing new solution. •! Used when implementing new change.
15
PDCA was first introduced by William Edward Deming by using consistent sequences of actions that aims for better quality and improvement. The technique further divides into four steps which is used to help organizations to plan different activities to reach better improvement. The technique will help the authors to introduce a structural plan of improving the company’s inventory management by using four consistent sequences (Jagusiak-Kocik, 2017., Johnson, 2002). The four steps to continuous improvement is visualized with figure 4. and a general explanation will follow up.
Figure 4. The Deming cycle or PDCA-cycle structure (Johnsson, 2002).
Plan -Identify and analyze the problem or improvements. Understanding the core of the problem, origin of causes is essential as it sets objectives and further designs a plan to reach improvement (Jagusiak-Kocik, 2017).
Do - This step is to develop a plan to make the changes. In this phase, tools and methods can be used such as checklist, benchmarking and flow diagram to eliminate the problem. Support and understanding from the management are necessary to fulfill the “Do”-phase (Jagusiak-Kocik, 2017, Qing-ling et al., 2008).
Check - Testing and checking results of the introduced plan or solution is helping to understand what went wrong or what was correct. Evaluate the results, if proven to be efficient, proceed to step four. If not, one should consider starting from step 1 “Plan” as understanding the main issue and setting objectives are critical to proceed the latter steps (Johnson, 2002, Qing-ling et al., 2008).
Act - After a plan or solution has been approved by previous step, the activities of the them should be standardized and monitored over time. The knowledge gained from this last step will be the foundation for next PDCA-cycle, thus a continuous improvement (Johnson, 2002, Qing-ling et al., 2008).
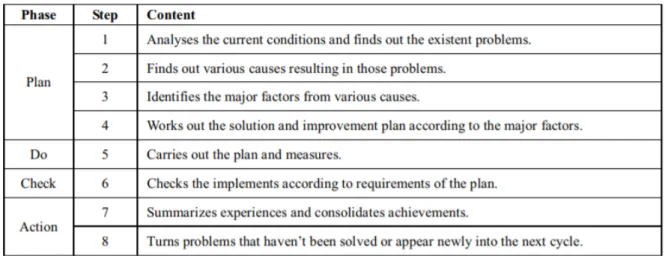
To further understand what activities to proceed in each PDCA step, figure 5. was used to represent the detailed procedures and will act as a guideline for this study to develop a procedure plan.
16
4 Findings and analysis
In this study chapter empirical findings will be presented as they are the keystones to this study. Furthermore, this chapter will answer the research questions of this study by studying and analyzing the collected data and using theories from literature review to connect the data to the research questions.
4.1 Situation Assessment
The authors conducted a semi-structured interview with the selected company’s purchase manager to get an understanding of the current situation. Furthermore, the purchase manager gave essential information which was required to answer the first research question:
•! How does the company’s inventory management currently work?
4.1.1. Suppliers
Currently Axelent AB has 25 A-suppliers which means they has a quality impact on the company. The company produce net sections, cable trays and pole which correspond to 30% of the inventory level and 70% are purchased. The purchase products are for example the pipe, cartoons, wrappings and sheets also buying transportation service. Axelent AB has local suppliers. The suppliers’ delivery reliability is 96-97% and the purchase manager is satisfied. The relationships between the suppliers and Axelent AB is good. Axelent AB has high requirements on the suppliers which put pressure on the suppliers to reduce the lead time, since Axelent wants to be fastest in the market.
4.1.2 The current state of inventory management
In the current situation, the focus company does not have any proper tools or methods to analyze their inventory on detailed level. The company does not have any properly ABC-Classification. The company only assumed which products were classified as A, B or C, which is an informal and unstructured way of working. The purchase manager is responsible for this role and the manager classified the products based on experience. At the current state the company does not work with strategy and it strengthens the need of an ABC-classifications to discover which products needs to be prioritized to efficiently improve the inventory management.
The company works closely with their suppliers regarding lead time and how they should perform. Further on, the company uses their ERP system to calculate reorder point and economic order quantity based on previous statistics in months. The system’s sole purpose is to calculate how much the company should order but does not consider what is happening inside the inventory and what is causing the problems with high capital tied up.
4.1.3 Sample of the products
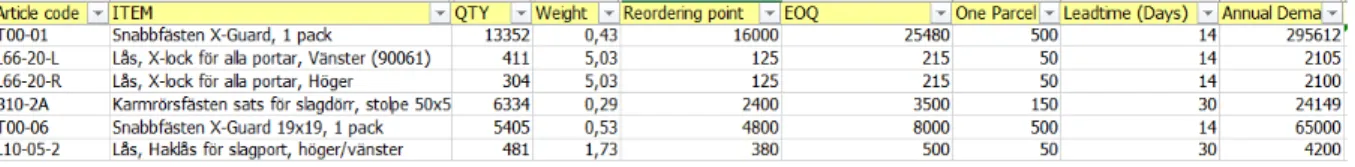
As earlier mentioned in the first section of the work, an agreement has been made with the company and certain information of the products such as pricing cannot be presented on the report as it is confidential. What can be presented is that the company has information of 436 products with respectively article number, balance, price per quantity, weight, reorder point, EOQ, quantity per pallet, lead time and annual demand. Following figure 6. is an example of how the company is currently working with their inventory management with no regards of what class respectively product is or how each individual class is affecting their costs and capital tied up on inventory.
17 Figure 6. Product information (Axelent AB, 2019).
4.2
Lead time
Lead time is previously defined in the theoretical framework as a time span for placing an order until it is ready to be shipped or delivered. Lead time on each product has a variation between 5 to 30 days. The lead time of the products is delegated in a variation of days between 5, 7,14, 21, 28 and 30 as shown in Figure 2. It describes the percentage of how many products has a certain lead time. 60% of the products has 30 days of lead time, 1% has 28 days, 3 % has 21 days, 16 % has 14 days, 3% has 7 days and 17 % has 5 days of lead time. This information is useful for the company as it can impact the capital tied up on stocks, transportation costs, stock level, which will be discussed later in discussions of findings. Table 2. Lead time
Days Percent (%) 5 17 7 3 14 16 21 3 28 1 30 60 (Own elaboration)
4.3
Findings and analysis of ABC- classification
In previous section, ABC – Classification was presented as a technique to identify which products requires more attention based on their annual total cost. In this study, a total inventory of 436 products with a total inventory cost of 51 963 061 SEK have been analyzed. These numbers were based on the secondary data given from the company.
The ABC technique which was based on the original 80/20 principle has been proved and is shown in figure 7. X-axis is constituting total number of products (436). Y-axis represents total cost in percentage. By using analyzing the secondary data, the authors could identify 13,3% of inventory as A-class due to the characteristic of constituting approximately 80% of the total inventory cost. The B-class was responsible for 24,5% of inventory and was responsible for 15% of total inventory cost. The remaining 69,93% was identified as C-class and constituted 5% of total inventory cost.
18
Figure 7. Cumulative costs (%) and cumulative inventory class (%) (Own elaboration). Due to limitation, the authors cannot show annual cost of respectively product in detail.
A-class represents the items with highest annual cost with an interval between 156 195 – 8 million SEK. This essentially implies the company has a total capital tied up on stock of A-products with worth of approximately 41,6 million SEK.
Secondly, the B-products are consisting of items with annual cost interval between 34 650 – 156 000 SEK. The inventory cost of B-products is amounted up to 7,8 million SEK.
Lastly, the C-products are generating the remaining costs for the products, which consists of 2,6 million SEK. The annual cost of procurement for the C-products are varying between 23 – 34 362 SEK. In addition, the authors believe that the results of the secondary data are mostly interested by the focus company. See table 3. to understand the correlation between classification and costs.
Table 3. A table of each class and its coverage on inventory in percentage (own elaboration). ITEM
CLASS # Product groups Product group % Total Inventory Cost % Capital tied up on stock (SEK)
A 58 13,5% 80.36% 41 600 000
B 107 24,5% 14,68% 7 800 000
C 270 62,0% 4,96% 2 612 967
19
The findings of the secondary data are presenting the current inventory in regards of costs and capital tied up on stock. As specified in the current literature, there are difficulties on equal inventory focus, therefore the ABC technique is used quite often to mitigate the problem. Previous literatures used the percentages based on costs as parameter to classify inventories (Millstein et al., 2014, Sohail, 2018). In this case, the A-class represents roughly 14% of the products but constitutes 80% of total cost, thus needing a tight control check. The inventory contains approximately 25% B products and amounts to roughly 15% of total product costs. The C-class essentially requires less focus and constitutes 5% of the total inventory costs. These results will contribute to a better inventory control as the company have not previously worked with this technique. The purchase manager can use the technique and improve their inventory management by seeing what exact products need more focus.
Additionally, the company requested another subclassification with different parameter to be performed on the 436 products:
·Number of products that are below or above the average annual quantity of each class.
In regard to previous literature, the technique can also be based on different criteria. In this study, each class was compared in regard to how large quantity or volume the inventory of that specific class has. The authors also set average annual quantity as a parameter to this subclassification.
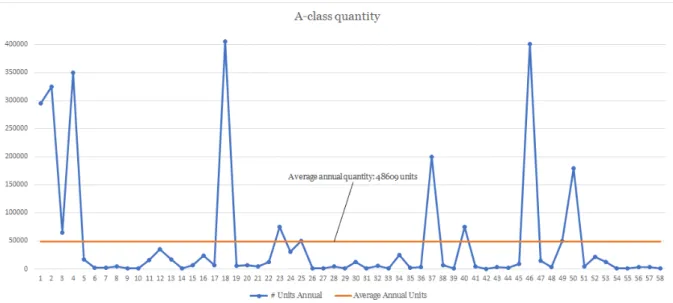
There are in total 58 A-products and they have an average annual quantity of 48 609 units. If these 58 products have an annual quantity below 48 609 units, it essentially means the capital tied up on stock is acceptable as the volume is low. Should it be above the average annual quantity, the focus company should control these extra carefully. Annual quantity above average implies that these products has way more quantity than average and leads to large holding cost and large capital tied up on stock. To see the number of products below and above average annual quantity, figure 8 was used to visualize it. Additionally, the figure indicates 9 out of 58, approximately 15,5% A-products has higher quantity than average. The points above the average unit need tight control, while the points below is adequate.
Figure 8. A-Class quantity (Own elaboration).
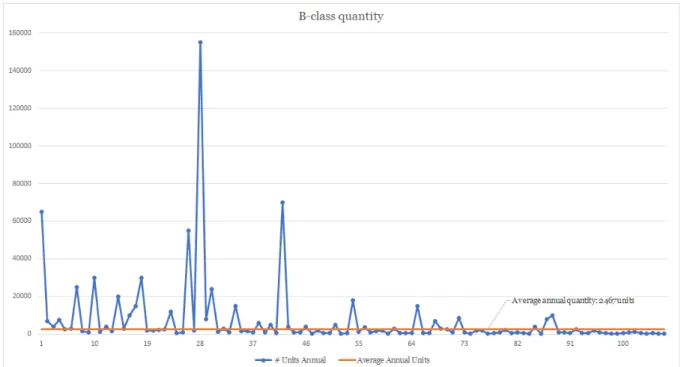
B-class contains 107 different products. The average annual quantity of the B-products are 2467 units. Should the products above the average annual quantity, it indicates a large capital tied up as well. The results of B-subclassification is shown in figure 9. It is indicating that 31 out of 107 products or 29% of the total B class has annual quantity above average.
20 Figure 9. B-class quantity (Own elaboration).
The remaining 270 products are C-class products with an average annual quantity of 703 units. Figure 10 is the implication of subclassification on C products. 20,3% or 55 out of 270 products have a quantity larger than average.
Figure 10. C-class quantity (Own elaboration).
The conclusion of the subclassification is indicated on table 4. A portion of A products (15.5%) needs a tighter inventory check as they are the potential main factors of A-products having a large capital tied up on stocks. Similar conclusion can be drawn on subclassification of B and C products. The fact that all these subclassified products constitute a larger volume than their average annual quantity implies that the company need to consider them as the major factors contributing to their inventory holding cost and capital tied up.
21 Table 4. Subclassification results.
Product
type Number above average Number below average or equal average Items above average in specific class (%) Total number of products A 9 49 15.5 % 58 B 31 76 29 % 107 C 55 215 20.3 % 270 (Own elaboration)
The focus company has similarities with inventory control in comparison to previous studies. Some of the traits identified from existing literatures was “indication of high cost products”, “prioritize correct items”, “keep low level of inventory” and “decrease lead time” and most of them are identified in this case study as well. The focus company can now in the future use the classical technique to identify costly products, keep better track on priority products and reduce inventory level when necessary. Based on the authors’ understanding, the company will most likely use the inventory classification as a standard technique in the future to gain more competitive edge. The goal of efficient inventory management is to keep low inventory level, reduce holding costs and capital tied up on stock, therefore the ABC-classification and the additional subABC-classification are critical to use for inventory management improvement.
4.4 Findings and analysis of PDCA-cycle
By utilizing previous studies, results of understanding the current inventory management and inventory classification, the authors could create a procedure for the company based on PDCA technique to improve their inventory management.
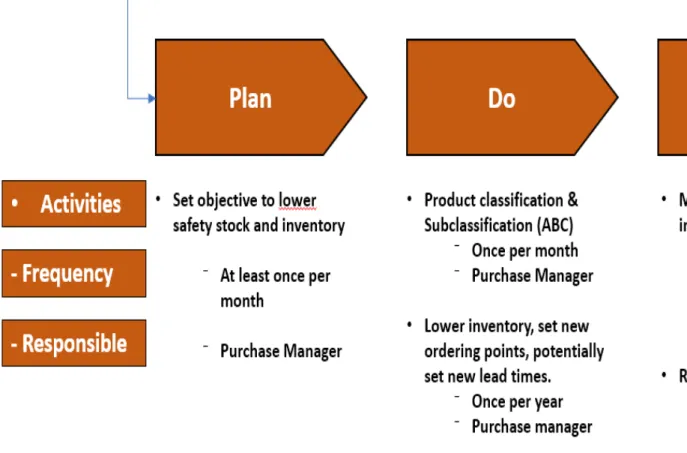
Once the inventory management has been examined and inventory has been classified according to the ABC technique, the study proposed procedures that the company should follow as seen in figure 11. A follow up analysis of the figure’s procedures is detailed. In the procedure plan, the main activities essentially contain what the management should do to accomplish the objectives set in the first step. Frequency of the procedure is crucial as it indicates how often these actions must occur and who should be held responsible for the activities. An analysis of each step will reflect what the authors believe the selected company should consider if the commitment towards improving inventory management is strong.
22
23
Plan - First step is to identify the core problem. The authors identified that the company was lacking a proper inventory control technique. The company cannot afford to lose transparency and awareness of what products should be prioritized. Each individual product is contributing to overall costs and raising their capital tied up, which they are trying to reduce. What the case company should do this case is to have a good understanding of the core issue, identify how the current situation looks like if needed again, how they are working with their inventory management and then set objectives to have continuous improvement. Aligning the management creates clear transparency. “Plan”-step contributes to the third research question by identifying the problem and a suitable approach consisting to improve inventory management which in this case is the use of ABC technique. This step should be performed at least once year to keep everyone on same level of consensus. The purchase manager is the main responsible for initiating this step.
Do - Once a plan has been decided, it is necessary to carry it out. In “Do”-step, the authors introduced two activities: Classify the products and sub classify them accordingly to the used parameters. As explained earlier, the purpose of using the inventory control technique is to eliminate causes of problem by implementing new changes. After classifying the products, it is crucial to set new inventory level and potentially lead times. The purchase manager should also be held account for this step.
Check - This step is used to monitor the results and the inventory after implementing the changes from previous step. Should the results be adequate, the responsible should proceed with the next step and standardize the solution. On the contrary, if not accepted, the responsible should analyze what went wrong, start over from step 1 and then change the activities accordingly until it reaches the expected outcome as mentioned in previous studies (Qing-ling et al., 2008).
Act- If the previous step accepted the solution, the company should standardize the activities and monitor them over time. By introducing the inventory management practice to the case company, they can potentially reduce overall cost and accomplish the company problem. In addition, should some of the problems persist, they will be included in the next PDCA-cycle. Thus, the management can adjust the problems. This last step is critical as it standardizes practices and creates a continuous cycle of actions to improve the inventory management or other areas.
Furthermore, table 5 was made to make it easier and more efficient for the case company to follow the potential activities. The table 4. is basically the suggestions of actions from the authors that needs to be considered in order to improve the inventory management. The objectives are named as actions and the activities means what needs to be done. The responsible will mainly be the purchase manager, check should be either accepted or not accepted follow by frequency. Finally act the company shall take notes of the company did successfully standardize the changes or what adjustments the action needs to do in next PDCA-cycle
24 Table 5. PDCA-Plan
Actions Activities Responsible Frequency Check
(accepted/not accepted) Act Perform an ABC- classification based on the 436 products •! Understand usage of ABC-classification. •! Meeting with the
purchase manager to know how divide the products into ABC- classification •! Conduct the
ABC-classification on the excel-file provided by the purchase manager Emelie, Anton and the purchase Manager One time is enough Accepted Subclassify the ABC-classification based on the volume (order quantity) •! Calculate the average of the volume of each product •! Make a table of each A, B and C category and divide the products into two categories: high respektive low volume Emelie, Anton and the purchase manager One time is enough Accepted Analyse the ABC-classification •! Basically, analyze the ABC-classification and to see if there is improvements of lead time / reorder point / EOQ Purchase manager
New lead time / reorder point/ EOQ to reduce the total cost •! Look on the inventory turnover rate from the ERP-system to identify if the product has high inventory turnover rate or low. •! Suggest or calculate new lead time / reorder point / EOQ to be more effective in the inventory. Purchase Manager Contact the
supplier •! Contact the supplier by phone
or email and
Purchase manager