Wireless Electrocardiogram
Emiliano Elías Mediavilla Pons
Thesis for BSc 2008
Wireless Electrocardiogram
Trådlös EKG-Registrering
Emiliano Elías Mediavilla Pons
This thesis is written at the Department of embedded systems at the School of Engineering, Jönköping University. The thesis is the final part of the engineering education. The authors themselves are individually responsible for presented opinions, conclusions and results.
Supervisor at ING: Anna-Karin Carstensen Examinator: Anna-Karin Carstensen
Level: 15 p (Bachelors degree) Date: 2009-04-03
Postadress: Besöksadress: Telefon: Telefax: Box 1026 Högskoleområdet 036-15 77 00 (vx) 036-12 00 65 551 11 Jönköping Gjuterigatan 5
Abstract
This document contains the development of an amplifier for an ECG-signal and interfacing it to wireless communication.
The purpose of this project is to get a clear ECG-signal without any noise, save it and send it through wireless communication.
A challenge of the wireless communication unit is to send as little information as possible to make the communication faster, without loss of information in the ECG-signal.
The context for this project is the integration of wireless communication in medical applications for home healthcare. This means that, patients are no longer bound to a specific healthcare location where they are monitored by medical instruments. Wireless communication will not only provide them with safe and accurate monitoring, but also the freedom of movement.
Summary
This document contains five main chapters: the introduction, the theoretical background, method, results and conclusion.
The introduction contains a description of the ECG-wave, with the necessary information about times and voltage levels of the different waves in the ECG-signal. The reader can also find some information on how to apply the electrodes onto the body and ECG-history. At the beginning of the theoretical background the reader can find information about amplification of the ECG-signal, the circuit and the description of any block in it. This part is very important because the ECG-signal is very weak and to be able to show the signal on a screen or grid paper it is necessary to amplify it to an acceptable voltage level.
In the second part of the theoretical background the reader can find the description and characteristics of the products used for the wireless communication, including the wireless sensor nodes and the programs used to program that nodes. And in the appendices the reader can find the description of the program used to make the wireless communication.
The method chapter contains the description of how to make the board for the ECG-signal amplification, explaining the programs and the instruments used in this project.
The results chapter contains all the results of the tests that were made to the amplifier circuit and a comparison between the theoretical values and the real ones.
In the conclusion chapter the reader can find the calculations of the errors in the instrumentation amplifier and the operational amplifier. The reader can also find the description of interference and noise affecting the circuit.
Table of contents
3
Table of contents
1 Table of figures ...5
2 Introduction ...7
2.1 Description of the project...7
2.2 ECG Amplifier ...7
2.3 Introduction to the ECG ...8
2.3.1 History...8
2.3.2 What to expect from the ECG...9
2.3.3 What makes the heart beat? ...9
2.3.4 From electrode to paper...9
2.3.5 The leads & Einthoven's triangle ...9
2.4 Waves and intervals ...10
2.4.1 Times and speeds...10
2.4.2 P-wave:...11
2.4.3 QRS-complex:...11
2.4.4 ST-segment:...11
2.4.5 T-wave:...12
3 Theoretical background...13
3.1 Amplifier Equipment description...13
3.2 Description of the different blocks in the circuit...15
3.2.1 Blue block - Reference circuit ...16
3.2.2 Green block - Connector circuit...17
3.2.3 Red block - Amplifier circuit ...17
3.2.4 Light blue block - Instrumentation amplifier reference circuit...19
3.2.5 Orange block - Filters ...20
3.2.6 Brown block - DC/DC-converter – Voltage supply circuit ...23
3.3 Study of errors...25
3.4 Wireless communication ...27
3.4.1 Wireless sensor networks ...27
4 Method...28
4.1 Manufacturing the board ...28
4.2 Description of the circuits used in the project for the wireless communication ...32
4.3 Calculations for the data transmission ...36
5 Results ...37
5.1 Results in the amplifier circuit. ...37
5.2 Calculations of errors ...39
5.2.1 Instrumentation amplifier...39
5.2.2 Reference circuit for the ECG-signal...42
6 Conclusions ...44
6.1 Interference sources: ...44
7 References ...46
Table of figures 5
1 Table of figures
Figure 1. The leads & Einthoven's triangle. Information provided by the internet page http://nobelprize.org/educational_games/medicine/ecg/ecgreadmore.html. September 14th, 2008. _______10 Figure 2. Waves and intervals. Figure provided by Wikipedia. September 15th, 2008.__________________________11 Figure 3. Amplifier and filtering circuit ___________________________________________________________________________13 Figure 4. Circuit with the different blocks _________________________________________________________________________15 Figure 5. Reference circuit._________________________________________________________________________________________16 Figure 6. Connections block ________________________________________________________________________________________17 Figure 7. Amplifier circuit__________________________________________________________________________________________17 Figure 8. Description of the INA128. Figure provided by the datasheet _________________________________________18 Figure 9. Reference circuit for the instrumentation amplifier ___________________________________________________19 Figure 10. Filters____________________________________________________________________________________________________20 Figure 11. Active electronic filter __________________________________________________________________________________21 Figure 12. Passive electronic filter_________________________________________________________________________________22 Figure 13. Plot of the gain of Butterworth lowpass filters of orders 1 through 5. Note that the slope is 20n dB/decade, where n is the filter order. Figure provided by Wikipedia, Filters section. October 5th, 2008. _____22 Figure 14. Bode plot of a third order Butterworth lowpass filter, with a cutofffrequency of 33,86 Hz. ______23 Figure 15. Negative source circuit _________________________________________________________________________________23 Figure 16. Functional block diagram. Figure provided by the datasheet________________________________________24 Figure 17. Typical window of the subprogram Capture Cis ______________________________________________________28 Figure 18. Window of the program Orcad Layout ________________________________________________________________29 Figure 19. Example of the autoroute of the leads _________________________________________________________________29 Figure 20. UV etching machine ____________________________________________________________________________________30 Figure 21. TYP2014 (image provided by Solectro’s internet page). November 9th 2008. ______________________31 Figure 22. Drilling machine used in the project___________________________________________________________________31 Figure 23. MICAZ wireless transmitter. [8]________________________________________________________________________32 Figure 24. 51pin expansion connector. (Ibid) ____________________________________________________________________33 Figure 25. Top view of an MDA300CA. (Ibid) _____________________________________________________________________33 Figure 26. MDA300CA pindistribution. (Ibid) ____________________________________________________________________34Figure 27. Table of description of the pins. (Ibid)_________________________________________________________________34 Figure 28. MIB520 board. (Ibid) ___________________________________________________________________________________35 Figure 31. Signal before the filters_________________________________________________________________________________38 Figure 32. Signal after the third order filter ______________________________________________________________________38 Figure 29. Amplifier circuit with the instrumentation amplifier INA128________________________________________39 Figure 30. Reference ECG lead circuit _____________________________________________________________________________42
Introduction
7
2 Introduction
2.1 Description of the project
The purpose of this project is to create a portable Electrocardiogram (ECG) to monitor patients who are in their houses or employees with risk of heart attack.
The context for this project is the integration of wireless communication in medical applications for home healthcare. This means that, patients are no longer bound to a specific healthcare location where they are monitored by medical instruments. Wireless communication will not only provide them with safe and accurate monitoring, but also the freedom of movement.
This portable ECG will monitor the patients with 3 electrodes that will measure the body information. Then an electronic circuit will amplify this data and filter it to enhance the signal/noise ratio. After that the information will be saved in a database and the data is then sent through wireless communication to a monitoring system, where the data is analyzed, and if it is out of health limits a message is sent to notify the doctor.
2.2 ECG Amplifier
Cardiac signals from the heart are extremely weak (in the range of 0.025-4mV with frequencies between 0,05 and 100 Hz) and are often very noisy, since it is hard to get a good contact between an electrode and the skin. For that reason, an ECG amplifier circuit is needed to amplify the signal and reduce the present noise.
2.3 Introduction to the ECG
2.3.1 History
In the 19th century it was evident that the heart generated electricity. Kolliker and Mueller discovered this bioelectric activity in 1856.
“The most important contribution to the development of the medical instrumentation in the 20th century was electronics. Starting in 1903 with the invention of the electrocardiograph (ECG) by the Danish Willem Einthoven, who worked in Leiden (Netherlands), and continuing to our days with the most complex equipments. A lot of Einthoven's terminology is still being used and his original research remains fundamental to electrocardiography today”.1
“Making the electrodes sensitive enough was a challenge in the early days of the ECG. In the late 1800's early attempts to measure the electric activity in a frog's heart was successful only when the heart was exposed directly to the measuring equipment. The measuring conditions were indeed difficult; the scientists wanted to be able to measure the electric signals without having to enter inside the body. The problem was that the electric wave got weaker since it had to travel through bone and body tissue before reaching an electrode applied on the skin. This problem was solved a couple of decades later by Willem Einthoven”.2
When Einthoven did the first ECG doesn’t use any electronic help, this experiment consist in three buckets with salt water, a wire and two magnet poles. To measure the heart signal the patient inserted both hands and the left foot into the buckets, then a wire connected the right and left hand and goes between two magnet poles. When the wire received a signal from the body, it moved due to the current flowing through it and the magnetic field influence.
This movement was registered by light reflexes coming from a lot of small mirrors put on the wire.
“Einthoven assigned the letters P, Q, R, S, T to the different deflections and wrote the electrocardiographic characteristics of a lot of cardiovascular diseases”3.
With the electronic amplifier development, the movement amplifier was eliminated, and the signal became much easier to measure and display on a screen or grid paper.
In 1940 the scientists incorporated the paper recorder that is still used today and its dimensions and speed are standard around the world.
1Wikipedia provides the information. September 12th, 2008. Electrocardiogram section.
2This information is provided by: http://nobelprize.org/educational_games/medicine/ecg/ecg-readmore.html. September 12th,
2008.
Wireless Electrocardiogram
9
2.3.2 What to expect from the ECG
The ECG can provide evidence to support a diagnosis, and in some cases it is crucial for patient’s treatment.
The ECG is essential for the diagnosis of abnormal cardiac rhythms. This physical-exam helps with the diagnosis of the cause of chest pain, and the proper use of thrombolysis when treating myocardial infarction.
2.3.3 What makes the heart beat?
The reason why the heart beats is because the heart-muscles receive a very small electrical shock, and this results in a contraction of the heart.
“If the whole heart muscles contracted at the same time, there would be no pumping effect. Therefore the electric activity starts at the top of the heart and spreads down, and then up again, causing the heart muscle to contract in an optimal way for pumping blood”.4
2.3.4 From electrode to paper
The electric waves in the electrocardiogram are recorded in millivolts by the electrocardiograph. Electrodes placed on different parts of the body register the waves. Each electrode controls an ink needle that writes on a grid paper or the image in a screen that shows the ECG-signal. The paper moves at a certain speed, 25 mm/s, under the needle, resulting in an ink curves.
2.3.5 The leads & Einthoven's triangle
The electrodes are typically twelve in electrocardiographic machines. “The stretch between two limbs (arm or leg) electrodes is called a lead”5. Einthoven named the leads between the three limb electrodes, see figure 1, "standard lead I, II and III" referring to the two arm electrodes and the left leg electrode, that is the reference in the circuit. “He studied the relationship between these electrodes, forming a triangle where the heart electrically constitutes the null point”6. The relationship between the three leads is called Einthoven's triangle and it is shown in figure 1.
4 Information provided by the internet page
http://nobelprize.org/educational_games/medicine/ecg/ecg-readmore.html. September 14th, 2008.
5 6 Information provided by the internet page
Figure 1. The leads & Einthoven's triangle. Information provided by the internet page
http://nobelprize.org/educational_games/medicine/ecg/ecg-readmore.html. September 14th, 2008.
“When the heart muscle is at rest, the pacemaker cells are negatively charged and when the heart contracts they are positively charged. When a positive electrode records a positive wave, the ECG curve will be pointing upwards and vice versa”7.
2.4 Waves and intervals
2.4.1 Times and speeds
The most common ECG-recorder is the one with an ink needle doing a trace in a grid paper. This recorder runs at a standard speed of 25 mm/s and this speed is standard around the world. Each large square (5 mm), in the grid paper, represents 0,2 seconds in the ECG-signal.
In the grid paper 5 squares represent one second in the ECG-signal, that’s means 300 squares in a minute. For that reason the grid paper rate is 300 square/min.
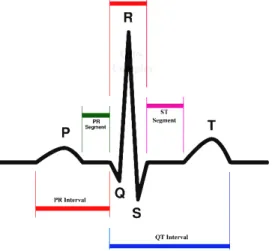
“A typical ECG tracing of a normal heartbeat (or cardiac cycle) consists of a P wave, a QRS complex and a T wave. A small U wave is normally visible in 50 to 75% of ECGs. The baseline voltage of the electrocardiogram is known as the isoelectric line. Typically the
7 Information provided by the internet page
Wireless Electrocardiogram
11
isoelectric line is measured as the portion of the tracing following the T wave and preceding the next P wave”8. Figure 2 shows the different waves in the ECG-signal.
Figure 2. Waves and intervals. Figure provided by Wikipedia. September 15th, 2008.
2.4.2 P-wave:
The P-wave shows the electrical signal necessary for the atrial contraction.
If both atrial (the left and the right one) contract at the same time, that could indicate arrhythmia.
2.4.3 QRS-complex:
The QRS-complex represents the electrical signal necessary to contract the left and right ventricles in the heart. This is much more powerful than the other contractions and involves more muscle mass, which result in the most significant ECG-deflection.
The internal time between the P-wave and the QRS-complex is approximately 120 to 200 ms.
2.4.4 ST-segment:
“The ST-segment connects the QRS-complex and the T-wave and has a duration of 0.08 to 0.12 sec (80 to 120 ms). The typical ST-segment duration is usually around 0.08 sec (80 ms). It should be essentially level with the PR and TP-segment”9.
8 Information provided by Wikipedia - Electrocardiogram section. September 15th, 2008. 9 Information provided by Wikipedia - Electrocardiogram section. September 15th, 2008.
2.4.5 T-wave:
“The T-wave represents the repolarisation (or recovery) of the ventricles. The interval from the beginning of the QRS-complex to the apex of the T-wave is referred to as the absolute refractory period. The last half of the T-wave is referred to as the relative refractory period (or vulnerable period)”10.
Theoretical background
13
3 Theoretical background
3.1 Amplifier Equipment description
The ECG signal is very weak. For that reason it is necessary to amplify the signal to perceive it in another equipment and analyze it.
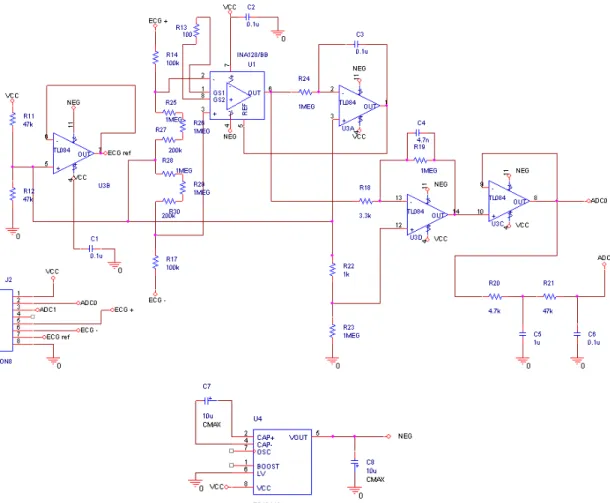
In figure 3 the most significant part of the circuit is the instrumentation amplifier INA128, the circuit that amplifies the ECG-signal. It is possible to choose the gain in that circuit, depending on the resistance the user puts between the pins 1 and 8 (R13). When the signal is amplified, it is sent to the low-pass filters, which will be described in the block descriptions and in the calculations section. The filters are used to enhance the signal/noise ratio.
Figure 3. Amplifier and filtering circuit
Some ideas for the amplification of the signal are taken from a paper about ECG-amplification (Victor Shnayder, Bor-rong Chen, Konrad Lorincz, Matt Welsh, CodeBlue - A
Wireless Sensor Network Infrastructure for Medical Applications, Harvard University), but the circuit has been reworked during this project. Especially the amplifier and reference circuit have been fully reworked.
There is another part in this circuit that is also very important, the reference signal. This part of the circuit is used to give a reference to the instrumentation amplifier INA128 and enhance de common mode rejection ratio.
The operational amplifier TL084 is used in the reference part of the circuit and the filters. But there is another filter at the end of the circuit (before ADC1) that is not an active electronic filter. It is made with resistances and capacitors (it is a passive electronic filter).
The power used for the operational amplifiers is ±3V and for that reason the final output signal cannot exceed 2,8V. If the signal is larger, the operational amplifier will be saturated and the output signal will not be the correct one.
Wireless Electrocardiogram
15
3.2 Description of the different blocks in the circuit
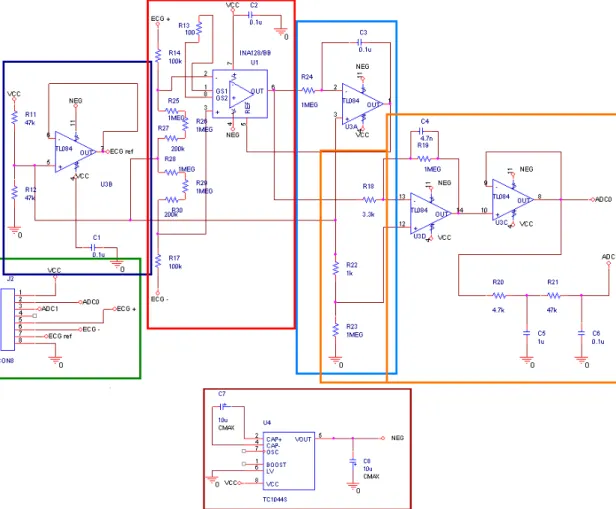
Figure 4. Circuit with the different blocks
In figure 4 there is a description of the different blocks in the circuit: Blue block: Reference circuit.
Green block: Connections to introduce and obtain data from the circuit and Vcc and ground connections.
Light blue block: Reference circuit for the amplifier block. Orange block: Filter block.
Brown block: Voltage supply circuit.
3.2.1 Blue block - Reference circuit
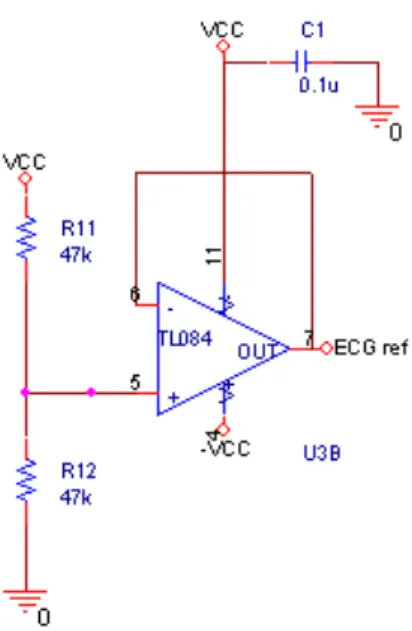
Figure 5. Reference circuit.
Figure 5 shows the reference circuit separated from the rest of the circuit.
This circuit is the one that provides the reference for the other electrodes. The reference electrode is connected to the left leg and to the other two electrodes forming the Einthoven's triangle.
Wireless Electrocardiogram
17
3.2.2 Green block - Connector circuit
Figure 6. Connections block
The connection block connects the circuit board to the ECG-electrodes and also to the wireless communication board. Figure 6 shows the connection block.
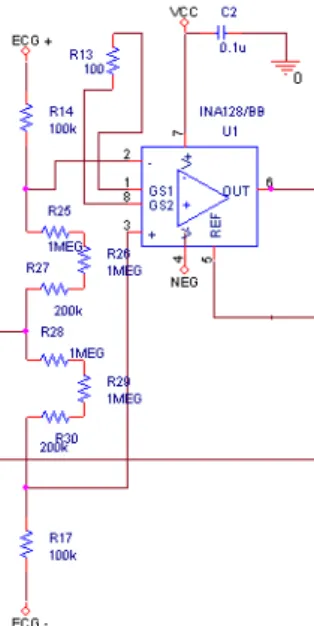
3.2.3 Red block - Amplifier circuit
The circuit shown in figure 7 is one of the most important parts on the amplification board. It is amplifying the ECG-signal and sends the signal to the filters. The heart of this circuit is the instrumentation amplifier INA128.
Figure 7 shows that the circuit works as a differential amplifier because it multiplies the difference between two inputs (ECG + and ECG -).
“An instrumentation amplifier is a type of differential amplifier that has been outfitted with input buffers, which eliminate the need for input impedance matching and thus make the amplifier particularly suitable for use in measurement and test equipment. Additional characteristics include very low DC offset, low drift, low noise, very high open-loop gain and very high common-mode rejection ratio. Instrumentation amplifiers are used where great accuracy and stability of the circuit for both short- and long-term are required”.11
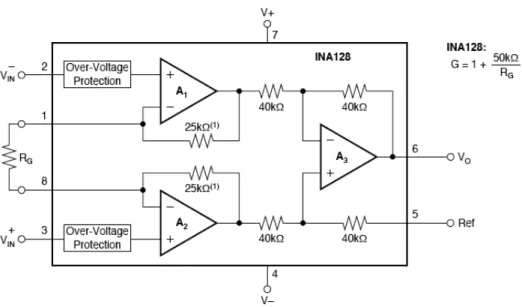
Figure 8. Description of the INA128. Figure provided by the datasheet
Figure 8 shows the description of the internal circuit of the instrumentation amplifier INA128. The gain of this circuit depends on the resistance that the user puts in the Rg position between pins 1 and 8. In the ECG-project-circuit the chosen resistance is 100Ω, so the gain, following the equation shown in figure 8, is 501. Thus the input 4 mV (the maximal ECG-signal level) gives an output of 2 V, having the reference voltage in 0V.
Wireless Electrocardiogram
19
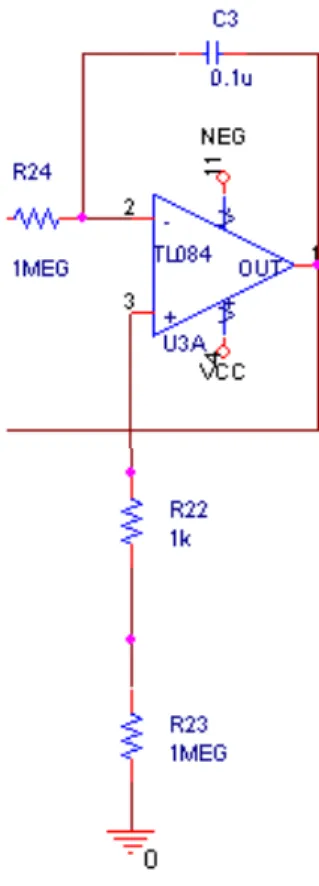
3.2.4 Light blue block - Instrumentation amplifier reference circuit
Figure 9. Reference circuit for the instrumentation amplifier
The circuit shown in figure 9 is the circuit to give a reference to the instrumentation amplifier. In some circuits the reference is the ground, but in this circuit it is possible to give a reference to the instrumentation amplifier.
The reference circuit gives a 600 mV reference to the INA128 and that’s helps to enhance the common mode rejection ratio in the instrumentation amplifier, for that reason is better than the reference voltage in 0V.
This circuit is an integrator and its behaviour is:
€ Voutput = −Vin RCdt + Vinitial 0 t
∫
3.2.5 Orange block - Filters
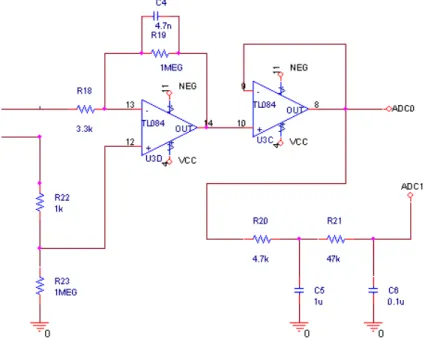
Figure 10 shows a very important part of the circuit, the filters. This part enhanced the signal/noise ratio.
Figure 10. Filters
A low-pass filter is a filter that passes low-frequency signals but attenuates signals with frequencies higher than the cutoff frequency. The attenuation varies depending on the order of the filter.
There are two kinds of filters in the circuit, the active electronic filter shown in figure 11, and the passive electronic filter shown in figure 12. Both of them are low-pass filters, and the reason of that is because the ECG-signal is only in the range between 0,05 Hz and 150 Hz.
Wireless Electrocardiogram
21
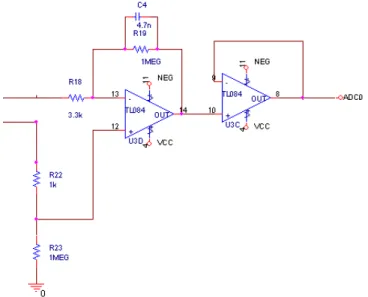
Figure 11. Active electronic filter
The active filter in this project is a first order one and the passive filter is a second order one, for that reason at the end of the amplification circuit there is a third order filter.
There are two equations to know the cutoff frequency in the active filter:
€ fc = 1 2 ×π× R19× C4 Or € wc= 1 R19× C4
The cutoff frequency of the active filter included in the project is 33,86 Hz. The other operational amplifier is a voltage follower and is used to invert and buffers the signal.
The filter shown in figure 12 is a passive electronic filter, which one of the outputs of the circuit (ADC1) passes. When this output is used, the signal has passed a third order filter, and if the user use the other output (ADC0), the signal has only passed a first order filter (only the active one).
The ADC0 output is used when the circuit is in an environment without so much noises and interferences or when the user uses good and clean ECG-electrodes that make good contact with the skin.
The ADC1 is an output with a third order filter, and is used by the user when the signal from the electrodes is not so clear like in the first case (ADC0). This may be caused by poor contact between electrodes and the skin or when the user is in a noise environment.
Figure 12. Passive electronic filter
The passive electronic filter has an estipulate cutoff frequency, and is easy to calculate with the equation: € fc= 1 2 ×π× T = 1 2 ×π× RC
For both of the passive filters, the cutoff-frequency is 33,86 Hz, and the roll-off approaches 40 db/decade.
Together with the active filter, which has the same cutoff-frequency, it becomes a third order filter with a roll-off of 60 db/decade. (See figure 13)
Figure 13. Plot of the gain of Butterworth low-pass filters of orders 1 through 5. Note that the slope is 20n dB/decade, where n is the filter order. Figure provided by Wikipedia, Filters
section. October 5th, 2008.
Figure 14 shows a Bode plot of a third order filter and the image clearly shows a -60 dB per decade slope.
Wireless Electrocardiogram
23
Figure 14. Bode plot of a third order Butterworth low-pass filter, with a cutoff-frequency of 33,86 Hz.
In the case of high frequency, there is low impedance in the capacitors, and in the case of low frequency, there is high impedance in the capacitors. And for that reason the capacitor shorts high frequencies to the ground so that the filter attenuates it.
3.2.6 Brown block - DC/DC-converter – Voltage supply circuit
Figure 15. Negative source circuit
Figure 15 shows the circuit necessary to give -3 V as negative voltage source for the operational amplifiers and the instrumentation amplifier.
The most important component in this circuit is the DC/DC converter TC1044S. It is able to convert from +1.5V to +12V input and give a corresponding –1.5V to –12V output, using only two capacitors
The most important features of the TC1044S are: Wide Input Voltage Range (1.5V to 12V) and Low Power Consumption (80µA @ VIN = 5V). The last feature is the most important one and the reason why that converter was chosen. It is very important to consider that the power source for the circuit is two batteries of 1,5 V in series, which make it necessary to keep the power consumption of the component as low as possible. Figure 16 shows the internal structure of the Dc/Dc converter.
Figure 16. Functional block diagram. Figure provided by the datasheet
The main reason for this DC-To-DC voltage converter is that the wireless sensor node board can only provide +3 V, and the amplifiers (operational and instrumentation) need ±3 V. With this dual voltage supply the swing of the instrumentation amplifier output becomes at most 2,8V.
Wireless Electrocardiogram
25
3.3 Study of errors
The purpose of the amplifier is to obtain an increase of the signal and enhance the signal/noise ratio. The input voltage always has an “Offset voltage”. This voltage appears more or less significantly in the output signal depending on the gain of that device.
The offset voltage (Vio) can introduce a considerable error, and consequently has to be studied very carefully. This value is in the datasheet of the Operational Amplifier.
To this error it is important to add the effect of the bias current (Ibias). It can be found in the datasheet. This error comes from the input transistors inequality, and for that reason Ibias + is different to the Ibias -.
€
Ibias=
Ibias++ Ibias− 2
The manufacturer also gives us the difference between the bias currents with the value Ioffset.
€
Ioffset = Ibias+− Ibias−
The output voltage is not the same as the theoretical. In order to obtain the real output voltage, it is necessary to add the offset voltage (Voffset) to the theoretical voltage (Voutput) (calculated with the information provided by the datasheet).
Vio = Input offset voltage.
Rth+ = Thevenin resistance in (+) pin. Rth- = Thevenin resistance in (-) pin. Ib = Bias current.
Iio = Input offset current.
€
VOffset = Vio+ R
(
th +− Rth−)
× Ib+Rth ++ Rth−
2 × Iio
In this case the theoretical output voltage in the operational amplifier is: Ad = Differential gain.
β = It is provided by the datasheet and depends of the transistor used. Vi = Input voltage. € Voutputtheoretical = Ad 1+β× Ad × Vin
And in the case of the instrumentation amplifier is:
€
Voutputtheoretical = R3
R2 × Ad × V
(
in +− Vin−)
This voltage (Vo) plus the error in the amplification, is the voltage in the output of that stage. And the error percentage in the gain is:
€
εgain =
Vreal− Vtheoretical
Vtheoretical ×100
The output error in the operational or instrumentation amplifier is:
€
εoutput =
Voutputreal − Voutput Voutput ×100
And at last the total error is:
€
εtotal=εoffset+εoutput
Wireless Electrocardiogram
27
3.4 Wireless communication
“Wireless operations permit services, such as long-range communications, that are impossible or impractical to implement with the use of wires. The term is commonly used in the telecommunications industry to refer to telecommunications systems (e.g., radio transmitters and receivers, remote controls, computer networks, network terminals, etc.), which use some form of energy (e.g. radio frequency (RF), infrared light, laser light, visible light, acoustic energy, etc.) to transfer information without the use of wires. Information is transferred in this manner over both short and long distances”.12
Wireless networking is used in many applications. Maybe the most well known application is to connect a computer to the Internet or to connect two laptops. A wireless transmission is one of the best choices when a patient, in the case of this project, frequently changes locations.
3.4.1 Wireless sensor networks
A wireless sensor network consists of a net of autonomous devices with sensors, which together are capable of measuring physical or environmental conditions. These sensors communicate with each other through wireless communication, and this is very useful for the users of that nets because there are no cables in the system. In health care applications this characteristic gives the patient free movement in the environment.
Every sensor node in a wireless sensor network is equipped with a power source, in the case of this project the nodes use two AA batteries in series to provide +3V, a memory to save the information acquired by sensors, a microcontroller that behaves like the brain of the circuit and a wireless transmitter for the communication between nodes.
4 Method
4.1 Manufacturing the board
This chapter describes the manufacturing of the board. The process begins by creating the circuit in a design program where the user can simulate and test the circuit.
The program used in this project was Orcad. At first it is possible to create the circuit schematic diagram in the subprogram Capture Cis, which is shown in figure 17.
Figure 17. Typical window of the subprogram Capture Cis
When the circuit is finished and works without errors, it is time to create a net-list. The net-list is a file created by the program where all the components are described.
From this file the connections and components are imported into the subprogram (part of the program Orcad) called Orcad Layout. In that subprogram the user is able to put the components in any position to create the board.
It is important to place the components carefully since otherwise it may not be possible to draw the connections without crossing them.
Wireless Electrocardiogram
29
Figure 18 shows an example of the circuit without the layout for the copper connectors.
Figure 18. Window of the program Orcad Layout
In this program the user can choose between drawing the tracks manually or to autoroute the leads on the board. The second choice is easier and faster than the first one, but sometimes it is better to lay out some leads manually because the program doesn’t differentiate between power or ground and the others tracks.
Figure 19 shows an example of an autoroute board with all the leads in the bottom layer of the board.
The last step before the creation of the physical board is to print this model on a transparent paper.
This kind of paper (transparent plastic paper) is used to do the photo-mask used in the UV-light treatment. The photo-mask consists of a circuit printed on the transparent plastic paper with black ink.
This type of etching requires a special board called photo-resist copper board.
The photo-mask must be situated and fixed in the correct place before exposing the board to UV-light.
The UV etching machine used in this project is shown in figure 20.
Figure 20. UV etching machine
The time of that process depends on the quality of the board, the UV etching machine and what paper the circuit is printed on.
The next step is to immerse the board in photographic liquid to remove all the light-sensitive film and in that moment the leads will appears on the board.
The last step in the creation of the board is to chemically etch the board in the chemical etching. This process takes place in the tool TYP-2014 that is shown in figure 21.
Wireless Electrocardiogram
31
Figure 21. TYP-2014 (image provided by Solectro’s internet page). November 9th 2008.
This tool contains chemical etching with 50ºC of temperature. The time to remove the copper surplus depends on how old is the chemical etching, but that process can takes between 15 and 30 minutes.
The last step in the creation of the board is to drill the connector holes. The people who will drill the board must be really patient and careful because it is important not to destroy the pads where the components will be soldered.
It is important to use a small drill (in this project was 0,6 mm), and a special drill-tool to do the holes exactly in the correct place. In this project the diameter of the holes was very important due to the limited space on the board, and with a 0,6 mm diameter drill, the final diameter of the holes was 0,7 mm, and this diameter was enough to insert all the components and solder them.
Figure 22 shows the tool used in the project.
4.2 Description of the circuits used in the project for the wireless
communication
For the wireless communication, the wireless sensor node MICAZ was used. This sensor node belongs to the latest generation of Motes from Crossbow Technology. The MPR2400 or MICAZ (2400 MHz to 2483.5 MHz band) uses the Chipcon CC2420, IEEE 802.15.4 compliant, ZigBee radio frequency transceiver, integrated with an Atmega128L micro-controller. Figure 23 shows the MICAZ board.
Figure 23. MICAZ wireless transmitter. [8]
One of these sensor nodes will be placed on the patient. It will be connected to the ECG-amplifier and transmit the information in the ECG-signal to another wireless sensor node which will be connected to a remote station, a computer or a telephone.
In order to connect the amplifier-board to the MICAZ, the expansion board (input/output board) MDA300CA (shown in figure 25) is used. In this way any analog signal can be connected to the MICAZ.
Figure 24 shows the connector used to connect the expansion board MDA300CA and the MICAZ node.
In order to transmit the information from the node to a remote station, the signal has to be digital. The signal provided by the ECG-amplifier is an analog signal. For that reason it is necessary to use an A/D converter, and this module is located on the MICAZ node.
In Figure 24 the reader can see that the pins dedicated to the analog to digital conversion are located between the pins 36 and 43 of the expansion connector.
Wireless Electrocardiogram
33
Figure 24. 51-pin expansion connector. (Ibid)
Figure 25. Top view of an MDA300CA. (Ibid)
In this project it will be appropriate to use 2 outputs (Vcc and GND) and one input (A0) in the MDA300CA. The Vcc output will provide 3,3 V to the amplifier board, GND will provide the ground to the amplifier circuit, and A0 input will receive the data from the ECG-signal amplifier board. The signal connected to A0 comes from the third order filter in the amplifier circuit.
Figure 26 shows the distribution of the pins in the expansion board and figure 27 shows the description of them.
Figure 26. MDA300CA pin-distribution. (Ibid)
Wireless Electrocardiogram
35
For the other sensor node, which will receive the data to transfer it to the computer, the USB adapter MIB520 is used. This board is the interface connection between the MICAZ node and the computer. It is shown in figure 28.
The MIB520 is used to program the nodes with a computer. When the node is connected to the MIB520 board, it doesn’t need the batteries because the USB provide it the power.
Figure 28. MIB520 board. (Ibid)
To program the nodes with the board shown in figure 28, requires having TinyOS installed on the computer.
4.3 Calculations for the data transmission
The ECG-signal is an analog-signal, but to transmit through wireless communication it is necessary to have a digital-signal. The process to convert from analog to digital consists in taking samples from the analog-signal.
The data transmission in wireless communication is done with information packets, each packet has 21 samples of the analog-signal. But in the transmission it is advisable to use one or two of these samples to control if the package arrived to the receiver-node o not. For that reason in this project the packets contains 19 samples from the analog-signal and 2 bytes of control.
The MICAZ node is able to transmit 10 packets per second, but the risk of losing packets increases when it is sending more packets per second. For that reason in this project the wireless sensor node will send 9 or less packets to be sure that all packets arrive to the receiver-node.
If the sensor node transmits 9 packets of 19 samples, the receiver-node will receive 171 samples of the analog-signal per second. This is enough to reproduce the original ECG-signal in the remote station.
The ECG-signal has a period between 0,6 and 1 second. If the wireless sensor node transmits 9 packets per seconds and each packet has 19 samples, the receiver-node will receive 102 samples of the analog-signal per period of the analog signal. Which means that the information of one cycle of the analog ECG-signal will be in 5,37 packets (102 / 19 = 5,37). But in this project the information will be in 5 packets which means that the receiver-node will receive 95 samples (5 x 19 = 95) of the analog-signal in 0,6 seconds.
To calculate the resolution in the analog to digital conversion it is important to know the range of the signal that will be converted, in the case of the ECG-signal this range is 6mV. It is also important to know how many bits each sample has. In this project each signal-sample has 8 bits, that means 256 combinations (28 = 256). With this information it is possible to calculate the resolution. In this project the resolution of the A/D conversion is 23,43 µV (6mV / 256 = 23,43 µV), which means that in the digitalization of the analog-signal it will be possible to detect any change in the ECG-signal greater than or equal to 23,43 µV.
Results
37
5 Results
At the beginning of this report, in the introduction chapter, there is a description of what is expected and the purpose of the project. Based on these goals, results are acceptable, since the amplification is enough to show the ECG-signal on a screen or grid-paper, and the wireless communication is able to send the data to the remote station and save the information in a database without any problem.
One of the points where the user has to be careful, and which it is necessary to improve, is the connection of the sensors onto the body. In this project it was necessary to use a special salty gel to reduce the resistance between the electrodes and the skin because there were a lot of interferences in the signal when the gel was not used.
In the theoretical chapter is mentioned that the instrumentation amplifier would give at most 2.8V swing in the output. After testing it, the results indicated that the amplifier circuit is able to give at most 2,4V swing in the output when the reference voltage is 0V. That is enough for our purpose since the maximum voltage needed in the output is 2V, which occurs when the ECG-signal level is 4mV.
5.1 Results in the amplifier circuit.
In the Theoretical Background chapter the reader can find the theoretical calculation of the gain in the amplifier circuit. In these calculations the gain is 500, and for that reason with an input of 4mV (the highest input coming from an ECG-signal) the output would be 2V. After the tests in the board, it was verified that the output, with 4mV in the input, is 2V.
One of the tests performed on the board was to use a step-signal to see the behaviour of the filters in the board. Figure 31 shows the Step-signal before the filters, on pin 6 of the instrumentation amplifier INA128, and figure 32 shows the signal after the third order filter included on the amplifier board. A function generator that provided a step wave of 50 mV amplitude and 1 Hz frequency was used.
In figure 31, it is possible to see the amplification of the step wave, but the reader can also see that the signal is not very clear and it has deformations in the step wave due to the interferences and noise in the circuit.
Figure 31. Signal before the filters
Figure 32. Signal after the third order filter
In figure 32 the reader can appreciate some noise in the signal. This noise was measured in one of the test and the result was 0,5 mV. With this result is possible to calculate the signal/noise ratio, dividing the noise value per the total signal value. The result of this calculation is 0,025% ((0,5mV / 2V) x 100).
Wireless Electrocardiogram
39
5.2 Calculations of errors
5.2.1 Instrumentation amplifier
In this chapter the reader can find the calculation of the errors in the circuit. This part is very important in the context of the project, because these errors will be reflected in the output of the circuit.
At the beginning the reader will find the calculations of the error in the instrumentation amplifier INA128. This is the main part of the amplification circuit. For that reason is appropriate to choose a good amplifier with good qualities to decrease the errors.
The first step is calculating the errors that appear in the instrumentation amplifier “INA128”. Figure 29 shows this circuit.
Figure 29. Amplifier circuit with the instrumentation amplifier INA128
At the beginning of the calculation it is important to calculate the offset voltage, it is essential to consider that the maximum voltage in the Vin (input voltage) is 4 mV, which happens in the highest part of the QRS-complex wave.
Vio = 50 µV Rth - = 95,652 kΩ Rth + = 95,652 kΩ Ib = 5 nA Iio = 5 nA € VOffset = Vio+ R
(
th +− Rth−)
× Ib + Rth ++ Rth− 2 × Iio VOffset = 50 ×10−6+ (95652 − 95652) × 5nA +95652 + 95652 2 × 5nA VOffset = 50 ×10−4V = 0,53mVThe next step is to calculate the theoretical output with the information provided by the datasheet and the following equations:
€ Voutputtheoretical = R3 R2 × Ad × V
(
in +− Vin−)
Ad = 1+ 2 × R1 RG G = 1+50kΩ RGTo calculate the gain, the reader has to know that the maximum input voltage in the circuit is 4 mV (when appears a QRS-complex wave in the ECG-signal).
In this circuit VCC is ±3V, and for that reason the amplifier can not give an output higher than 2,4V (considering the reference voltage is 0V).
€
Gain = G =Voutput Vinput
G =2,4V
4mV = 600
Wireless Electrocardiogram 41 € RG = 50kΩ G −1 = 50kΩ 600 = 83,3Ω
With this result it is possible to calculate Ad (differential gain), knowing from the datasheet that R1 value is 25 kΩ: € Ad = 1+ 2 × R1 RG = 1+2 × 25000 83,3 = 600
And with that information it is possible to calculate the actual output, knowing from the instrumentation amplifier INA128 datasheet that R3 = R2 = 40 kΩ.
€
Voutput = R3
R2 × Ad × V
(
in +− Vin−)
Voutput = 40000
40000× 600 × 4mV = 2,4V
The only error that appears in the output is the Voffset and the real value will be:
€
Voutput
real = Voutput+ Voffset= 2,4V + 0,53mV = 2,4005V
The error in the output is thus:
€
εoutput =
Voutputreal − Voutput Voutput
×100
εoutput =
0,0005
5.2.2 Reference circuit for the ECG-signal
The calculation of errors in the reference circuit (shown in figure 30) is important because this circuit is the reference for the instrumentation amplifier, and this reference will enhance the common mode rejection ratio in the INA128.
To calculate the errors in the reference circuit, it is important to know that the main component of that circuit is the operational amplifier TL084.
Figure 30. Reference ECG lead circuit
To calculate the error in this circuit it is important to know the offset voltage. Vio = 6 mV
Rth - = 0 Ω Rth + = 2,35 kΩ Ib = 200 pA Iio = 100 pA
Wireless Electrocardiogram 43 € VOffset = Vio+ R
(
th +− Rth−)
× Ib + Rth ++ Rth− 2 × Iio VOffset = 6mV + 2,35kΩ × 200 pA + 2,35kΩ 2 ×100 pA VOffset = 1,2 ×10⁻⁷VWhit the result of the offset voltage, it is possible to calculate the real output: Ad = 200 V/mV
β = 1 (because the gain of this circuit is 1. It is a voltage follower)
€ Voutput real = Ad 1+ β × Ad × Vin Voutput real = 200 V mV 1+ 1× 200 V mV ×1,5V = 1,49V
The only error that appears in the output is the Voffset and the real value will be:
€
Voutput
real = Voutput+ Voffset = 1,49V + 0,12µV = 1,49V
And there is an error in the output of:
€
εoutput =
Voutputreal − Voutput Voutput ×100 εoutput = 1,20 ×10⁻⁷ 1,49 ×100 = 8,065 ×10 −6 %
The error in the reference circuit for the ECG-signal is negligible, for that reason the biggest error in the amplifier circuit is the one that occurs in the instrumentation amplifier INA128. This error (0,02%) is considered the total error in the circuit, and like as reader can appreciate, this error is negligible and does not affect the results in the amplification.
6 Conclusions
The equipment developed in this project meets its requirements. In the different tests we could see that all the information we sent through wireless communication arrived correctly to the computer and we could reproduce the signal without any problem. The speed of the communication was enough to receive all the information, and the noise levels were below the theoretically calculated.
This project achieved its objectives, but there are some points where it is possible to improve some details.
Firstly the board of the amplification circuit is bigger than the MICAZ sensor node. It would be better to have the same size as the wireless sensor network boards to integrate all together. One solution for that problem is to make a double faced board or use SMC components. The cables that connect the ECG-sensor and the amplification circuit are not the appropriate ones. It would be better to use shielded-cables to decrease the interference from electromagnetic waves. The cables have to be flexible to be more comfortable for the patient. The ECG-electrodes used in this project were not the best ones, and for that reason it was necessary to use salty gel between the electrodes and the skin to reduce the resistance between them. With better ECG-electrodes, it would be possible to use less salty gel and the signal would be clearer than the signal obtained in the project.
On the amplification board, the reference circuit has in pin (+) two resistances connected to Vcc to give a reference to the circuit. In this project the reference could be the ground, for that reason if we remove those resistances and put this pin directly to ground, the circuit will continue working without any problem. Anyway if the reference circuit is removed from the amplification circuit board, and the pin 5 of the instrumentation amplifier is connected directly to ground, the amplification circuit will continue working without any problem but the common mode rejection ratio in the instrumentation amplifier would be worse than in the case with the reference circuit.
The total error in the amplification circuit is 0,02%, and as the reader can appreciate, this error is negligible and does not affect the results in the amplification.
6.1 Interference sources:
The electrophysiological signal is the result of the difference between two electrical potentials. In the electrocardiogram those potentials are the signal collected by the electrodes ECG (+) and ECG (-).
The ECG-signal is very susceptible to be affected by different kind of electrical signals, some of them external to the circuit and the others internal to it.
• Interference of magnetic fields: The acquisition cables (cables from the electrodes to the amplification board) and the patient create a close circuit, if this close circuit is crossed by a magnetic field, undesirable electric currents will appear in the cables and these currents produce distortion in the measure signal.
• Contact potential: There is a potential difference between the electrodes and the skin. This one is different when the electrodes are in different positions of the body and if
Wireless Electrocardiogram
45
• Internal capacitive coupling between different components, i.e. components can create a capacitor between them that affects the signal.
• Components noise: Thermal noise introduced by the resistances of the circuit.
The solutions to reduce the different effects of interferences are presented next and in the same order that they were mentioned before:
• It is necessary to use shielded and flexible cables.
• The cable has to be twisted from the patient to the equipment, to reduce the area where the magnetic field can cross and consequently reduce the undesirable electric current in the cables.
• The electrodes must be kept as clean as possible and use conductor substance like salty gel to reduce the resistance between the patient’s skin and the electrode.
To reduce the interference in the circuit it is recommend using an amplifier with the input impedance as large as possible, and this is one of the main characteristics of the instrumentation amplifier. The electrodes must have as low impedance as possible to counteract the high impedance of the skin.
This circuit is very safe because the power source is only two batteries of 1.5 V in series. Since the maximum voltage is 3V the current flowing through the patient can never exceed one milliampere.
7 References
[1] Hampton, Jhon R. The ECG made easy. 7th ed. London, Churchill Livingstone, 2007. 192 pages.
[2] Hampton, Jhon R and Adlam, David. The ECG in practice. 4th ed. London, Churchill Livingstone, 2005. 360 pages.
[3] Herrera Santoro, Juan Pablo. Introducción al electrocardiograma. 1st ed. Madrid, editorial Castalia, 2004. 234 pages.
Internet resources:
[4] (Author not mentioned). The electrocardiogram – looking at the heart of electricity. Consulted September 15th 2008.
http://nobelprize.org/educational_games/medicine/ecg/ecg-readmore.html . [Html]
[5] (Author not mentioned). Electrocardiogram – Wireless – Filters – Instrumentation amplifier – Operational amplifiers. Consulted from September 5th 2008 to December 9th 2008. www.wikipedia.org. [Html]
[6] Tse, David and Viswanath, Pramod. Fundamentals of Wireless Communications. Cambridge, Cambridge University Press, 2005. Consulted November 17th 2008.
http://www.eecs.berkeley.edu/~dtse/book.html . [Html]
[7] Huelsman, L. Active and Passive Analog Filter Design: An Introduction. Columbus, McGraw Hill, 1993. Consulted December 8th 2008.
http://faculty.capitol-college.edu/~andresho/tutor/matlab/TUTsymbolic2.htm . [Html]
[8] (Author not mentioned). MPR-MIB Users Manual.
Revision B.
Crossbow Technology, June 2006. www.xbow.comWireless Electrocardiogram 47
8 Index
A A/D converter...32 Amplifier ...13 B Blocks...15 C Calculations of errors ...40 Cardiac signals ...7 Conclusions ...39 D Data transmission ...36 E ECG...9 Einthoven's triangle...9 Errors...25 F Filters...20 G Grid paper...9 H Heart beats...9 History ... 8 I INA128 ... 17 Interference ... 45 M Manufacture... 28 MDA300CA ... 32 MICAZ ... 32 O Offset voltage... 43 P Purpose ... 7 R Reference ... 16 Results... 37 T TC1044S ... 24 W Waves ... 10 Wireless ... 279 Appendices
Appendix 1 Packet Receiver Program Appendix 2 INA 128 Datasheet Appendix 3 TL084 Datasheet Appendix 4 TC1044 Datasheet