ASSESSMENT OF BIOAEROSOL
DISTRIBUTIONS IN MUNICIPAL SOLID WASTE
TRANSFER STATION
Vytautas Abromaitis
Inga Urniežaitė
Dainius Martuzevicius
Kaunas University of Technology,
Department of Environmental Engineering,
Radvilėnų pl. 19, Kaunas, Lithuania
ABSTRACT
Operations in municipal solid waste (MSW) management chain are known to generate air pollution, especially with particulate matter. A significant portion of such pollution consists of bioaerosol particles, which potentially are harmful to human health. The presented research has aimed at assessing the emissions and seasonal fluctuations of total particulate matter and bioaerosol generated in MSW transfer facility. Aerosol samples have been collected every two weeks during the warm period of July and September. The samples have been collected by Button sampler on MCE filters. The concentration of total viable microorganisms has been determined by cultivation on Plate Count Agar. It was found that in the immediate vicinity of waste loading operations, the concentration of colony-forming microorganisms has reached 10 5 CFU/m3, while outside the building, the concentration has decreased by a factor of ~10. Both particle and microorganisms concentration indoor/outdoor ratio has revealed high relationship indicating similar transfer mechanisms of particles to the outdoor environment.
KEYWORDS
Municipal Waste Management; Air pollution; Particulate Matter; Bioaerosol.
INTRODUCTION
Municipal solid waste (MSW) operations are usually associated with an excessive emission of particulate matter (PM) into ambient air. A biodegradable fraction of MSW constitutes up to 60% of total mass and serves as a favourable medium for the growth of various microorganisms. These biological particles are also released into ambient air during mechanical impact. The MSW-generated bioaerosol usually contains fungal spores and fragments, cells of bacteria, viruses, protozoa, secretion and fragments of insects etc. The bioaerosol particle size ranges from 1 to 100 m [1].
Recent studies have shown that workers at waste handling plants may have more gastrointestinal symptoms, irritation of the skin, eyes and throat, respiratory disorders including organic dust toxic syndrome (ODTS; toxic pneumonitis) than workers of the other occupations [2]. The knowledge of the cause of these health problems among workers is however limited. The occurrence of these symptoms is also known to be high in other work environments where the workers are exposed to high levels of bioaerosols, containing mould
spores, bacteria and endotoxins. The intensity of exposure largely depends on the bioaerosol origin and composition, time of year, and the duration of waste storage and transfer [3].
In 1996, Niels O. Breum investigated the exposure to bioaerosols in waste collection. A comparative study on the significance of collection equipment, type of waste and seasonal variation was conducted. Generally the median exposure levels ranged from 105 to 106 cells/m3 (total microorganisms), 104 to 105 CFU/m3 (culturable fungi) and l03 to 104 CFU/m3 (culturable bacteria). The type of waste was a governing factor for exposure [3]. The assessment of airborne microorganisms in different types of waste handling has been done in 1999, in Finland. H. Kiviranta estimated that the concentrations of viable fungi were maximally 105 CFU/m3, and the concentrations of both total culturable bacteria and Gram-negative bacteria exceeded the proposed occupational exposure limit values (OELV), being 104 and 103 CFU/m3, respectively [4]. In 1995, E. Moller assessed the exposure of bioaerosols during collection of mixed household waste. On average, the exposure to total microorganisms during the working day was 5 × 10⁵ CFU/m3 of air for the worker mainly loading the waste into the compactor truck, while the truck driver was exposed to 105 CFU/m3. Concentrations of dust and endotoxins in the air were low [5].
This study has aimed at determining levels of PM and viable microorganism concentrations in the MSW transfer station were an excessive aerolization occur due to inertial impact of falling waste. The temporal and spatial distributions of PM and microorganisms inside and near the transfer facility have been assessed.
METHODS
2.1 Site description
The MSW transfer station transfers approx. 150000 tons MSW per year. The working area is 850 m2. The station is of a “direct waste transfer” type, that is, the waste from smaller collection vehicles is transferred directly to a large container without storing it. Once the container is full, wastes are compressed and transferred to a landfill for a final deposition. The waste from collection vehicles is dumped into a shaft and freely falls 10 m to a large container. At this point, a significant amount of dust is released into the air.
2.2 Sampling and analysis
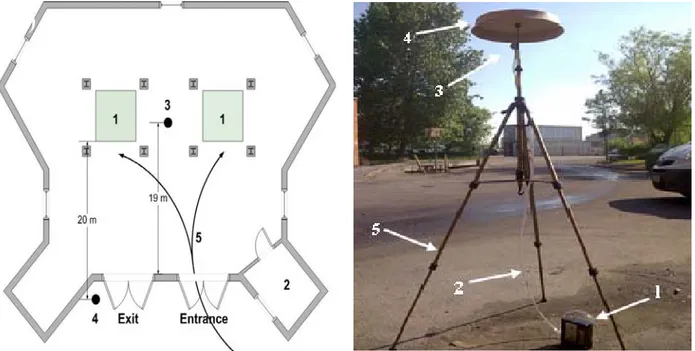
The PM was sampled in two locations. One was situated inside of the station, with a distance of 1 m from the waste dumping shafts. Another location was situated outside of the building at a distance of 2 m from the vehicle entrance gate. Both sampling places were situated on a concrete floor surface. The scheme of sampling locations is presented in Fig. 1. Such sampling setup was selected in order to determine the dispersion of particulate matter and biological particles from the place of generation to the outside environment. All sampling procedures have been carried out during normal plant operations. The sampling campaign started in July and ended in September. The samples were taken in by-weekly intervals.
The PM samples were collected by Button sampler (SKC Inc., PA, USA) on a mixed cellulose ester (MCE) filters of 25 mm diameter and a pore size of 0.8 m. The sampler was mounted on a supportive system consisting of a tripod and a rain-protective shield (Fig. 2).
Figure 1. Scheme of MSW transfer station and sampler location: 1 – MSW dumping shaft; 2 – control room; 3 – indoors sampling site; 4 – outdoors sampling site; 5 – transport moving route.
Figure 2. Particulate matter sampling equipment: 1 – personal pump; 2 – polypropylene tube; 3 – “Button” sampler; 4 – rain shield; 5 – tripod.
The sampler‘s height was adjusted to 1.5 m from the floor level or ground surface, which approximately represents the breathing zone of a worker exposed to the dusts [6]. The sample air was drawn through the filter by personal sampling pumps (PCXR4, SKC Inc, PA, USA). The pumps were placed on a ground and connected with the sampler by 2 m long propylene tubes. The samples were taken with a flow rate of 4 lpm for 30 min period. Three subsequent samples were taken in each location, with the aim to quantify short-term temporal variation of PM and bioaerosol. After each run, the samplers have been thoroughly cleaned by a lint-free wipe soaked in a 96% ethyl alcohol solution. After a 2-hour sampling campaign, the filters have been immediately brought to the laboratory for the analysis.
The collected PM samples were analysed gravimetrically and microbiologically. During the gravimetrical phase, the filters were kept at a constant temperature of 20 oC for 1 hour in order to stabilize their mass. The filters were weighed before and after each sampling with a microbalance of 1 μg precision (MX5, Radwag, Poland). After the gravimetric analysis, the microorganisms have been extracted from the MCE filters by submerging them into 15 ml of sterile water and shaking them for two minutes.
Afterwards, the samples were ultrasonicated for 10 minutes. The combination of mechanical shaking and ultrasonication allows reaching 90-98% extraction efficiencies [7,8]. Afterwards, the extracts were diluted and plated-out into 90 mm Petri dishes filled with Plate count agar, which is usually used for the total viable counts. The prepared Petri dishes were thermostated for 72 hours in a temperature of 30 oC [9]. After such incubation, only the plates containing 30-300 colony forming units (CFU) were counted. The obtained results were re-calculated to CFU per 1 m3 of air [6].
In addition to the field samples, 10% of field an laboratory blank samples were processed and analysed in parallel by the above-described techniques, in order to control the quality of analyses.
The obtained data was analyzed for temporal variation (both short-term and long-term) and spatial variation (inside/outside of the station).
RESULTS AND DISCUSSION
3.1 Temporal variations of particulate matter concentrations
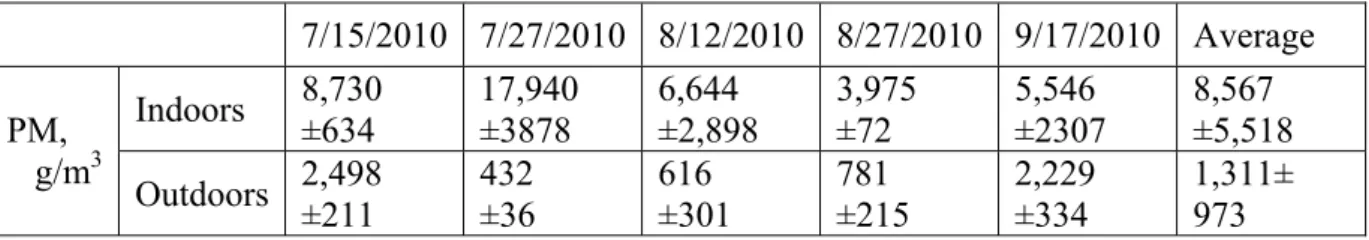
The observed mass concentrations of PM are presented in Table 1. As expected, the PM concentrations observed inside of the transfer station were significantly higher than those observed outdoors (Wilcoxon matched pair test yielded a value of p<0.05). A substantial temporal variation has been noticed both for indoor and outdoor sampling locations. The concentration ranged from 3,975±72 to 17,940±3,878 g/m3 inside of the station, and from 432 to 2,498 g/m3 outside. The short term variation, expressed by the coefficient of variation (CV) ranged from 1.8 to 43.6 % inside of the station, 8.3 to 48.9 % outside of the station. This relatively high variation may be easily explained, since during three subsequent 30 min samples, the emission of particles varies substantially due to ongoing waste transfer operations. The long term variation was also rather high, reaching 64.4% inside of the station and 74.2% outside of the station. Similar levels of long-term temporal variation indicated possible dependences of outdoor to indoor concentrations, although no clear relationship has been registered (as discussed in 3.3 sub-section).
The comparison of data obtained in this study to earlier studies has revealed that in our case observed PM concentrations reached up to 12-fold higher levels. The maximum reported concentration reached 1500 g/m3 [3,10], while we have registered maximum concentration of 17940 g/m3. This might have been caused by an event of transfer of dusty waste, such as a presence of construction/demolition waste in the load.
The long-term threshold limit value of the exposure to PM in workplace environment in Lithuania is 5000 g/m3, thus inside of the station it is exceeded by an average of 1.7 times. At the same time, concentrations of PM outside of the station were 3.8 times lower.
Table 1. PM concentrations registered inside and outside of transfer station (mean±standard deviation) 7/15/2010 7/27/2010 8/12/2010 8/27/2010 9/17/2010 Average Indoors 8,730 ±634 17,940 ±3878 6,644 ±2,898 3,975 ±72 5,546 ±2307 8,567 ±5,518 PM, g/m3 Outdoors 2,498 ±211 432 ±36 616 ±301 781 ±215 2,229 ±334 1,311± 973
3.2 Temporal variations of bioaerosol concentrations
The measured concentration of bioaerosols, expressed as viable counts, similarly to PM concentrations, was also significantly higher indoors (p<0.05). Inside of the station the concentration ranged from 248,413±139,531 to 619,048±78,680 CFU/m3, and outside from
from 12.7 to 56.2 %, and 9.2 to 42.4%, respectively. The long-term CV for inside and outside was rather similar: 43.4 and 42.1%, respectively. These findings correspond rather well with the results of PM measurements. On the other hand, the long-term variation was somewhat lower than that of PM.
The measured concentrations of airborne viable microorganisms were of the comparable level to the studies in similar environments. The concentrations inside of the transfer station were of 105 CFU/m3, while outside of the building they varied around 104 CFU/m3. Heldal et al. (1997) have determined the concentrations of 104 – 106 CFU/m3 in the source-separated waste sorting facility [10].
Table 2. Biological particle concentrations registered inside and outside of transfer station (mean±standard deviation) 7/15/2010 7/27/2010 8/12/2010 8/27/2010 9/17/2010 Average Indoors 293,651 ±97,192 619,048 ±78,680 256,349 ±52,669 475,397 ±85,601 248,413 ±139,531 378,572 ±163,015 Total viable counts, CFU/m3 Outdoors 20,952 ±2,704 22,937 ±5,545 23,095 ±2,520 51,587 ±4,764 38,810 ±7,190 31,476 ±13,343 There are no internationally accepted threshold limit values (TLVs) or occupational exposure limits (OELs) for microorganisms [2]. It has been proposed that fungal and bacterial concentrations, which are higher than 104 CFU/m3 should be considered as a threat to worker‘s health [11]. Moreover, it was shown that symptoms in the eyes and nose increased after exposure to fungal spores at the level 2 × 10⁴ to 5 × 10⁵/m3 and cough symptoms after exposure to concentrations of 5 × 10⁵ to 17 × 105 fungal spores/m3 [12]. In our study, the observed levels inside the municipal solid waste transfer station reached up to 105 CFU/m3, while in near vicinity of the station, the concentrations have decreased to the level of 104 CFU/m3. This indicates that working conditions inside of the transfer station are of elevated
hazard.
3.3 Indoor to outdoor distributions of particulate matter and bioaerosol
The obtained data of PM and microorganisms concentrations inside and outside of waste transfer station building have been analyzed with respect to relationships between indoor and outdoor concentrations as well as relationships between PM and microorganism concentrations. It was hypothesized that due to strong emission source, the relationships should exist between indoor and outdoor particle concentration, and between PM and bioaerosol concentrations.
Figure 3 shows relationships of indoor and outdoor concentrations of PM and viable microorganisms. It is evident that based on the collected data, a clear and significant relationship in both cases cannot be established (Spearman r equalled -0.14 for PM and -0.09 for microorganisms, p<0,05). It must be admitted that the amount of collected data is rather low to establish statistically significant relationships. We expect to continue the collection of data to obtain larger data sets for more representative conclusions.
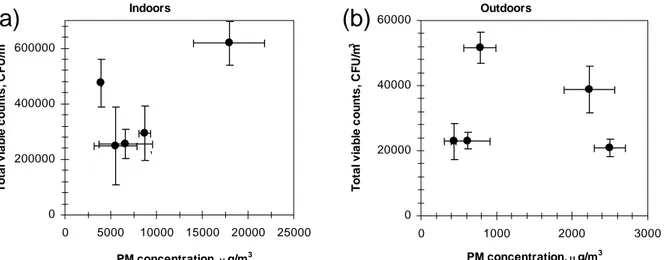
The next step of the data analysis led to the establishment of relationships between two types of measured particles indoors and outdoors (Figure 4). Rather strong relationship has been
established between PM concentration and microorganisms concentration inside of the building (R2 = 0.45). There was a single occasion of high microorganism concentration; having removed this point from the analysis, the value of R2 of 0.95 was reached. Thus, the data indicates that it is possible to build a forecast model of rather high accuracy for predicting emission of microorganisms based on only PM mass measurements near a source. On the other hand, further from the source (outside), no relationship between concentrations of PM and microorganisms could be established (Spearman r =-0.02).
PM concentration, μg/m3 0 1000 2000 3000 0 5000 10000 15000 20000 25000 Indoors O utdoo rs
Total viable counts, CFU/m3
0 20000 40000 60000 0 200000 400000 600000 Indoors O u tdoor s
Figure 3. Indoor/outdoor relations of particulate matter concentration (a) and total viable counts (b) Indoors 0 200000 400000 600000 0 5000 10000 15000 20000 25000 PM concentration, μg/m3 T o ta l vi ab le co u n ts , CF U/ m 3 , Outdoors 0 20000 40000 60000 0 1000 2000 3000 PM concentration, μg/m3 T o ta l vi ab le co u n ts , CF U/ m 3
Figure 4. The relationship between total viable counts (CFU/m3) and particulate matter concentrations ( g/m3) at the indoors (a) and outdoors (b) of MSW transfer station
(a) (b)
(a) (b)
y = 0.4565x + 7.7563 R2 = 0.8782 0 10 20 30 40 50 0 10 20 30 40 50 PM (Indoor/Outdoor ratio) T o ta l v ia b le c o u n ts (I ndoo r/ O u td o o r r a ti o)
Figure 5. The relationship between total viable counts and PM indoor/outdoor ratios
The above described distributions indicated that although there is no clear relationship between PM and microorganism indoor/outdoor concentration, indoor/outdoor ratios may actually be associated. Figure 5 shows such relationship with a relatively high R2 value. It maybe concluded that both physical and biological particles are dispersed by the same mechanism (such as ventilation, movement of vehicles etc.).
CONCLUSIONS
The experimental investigation of distributions of airborne particulate matter and viable microorganisms in the municipal waste transfer station has revealed both high temporal and spatial variability of the two types of particles. High temporal variability was associated with rapidly fluctuating operations within the facility, as well as properties of waste that was transferred. At the same time, it was noticed that the generation of viable microorganisms is associated with generation of particulate matter close to the waste transfer shafts. The indoor/outdoor distribution analysis has revealed that both mechanical and biological particles are being transported to the outdoor environment by the same mechanisms, although no clear relationship between outdoor and indoor concentrations of PM and bioaerosol has been established. The measured indoor concentration of PM was up to 40 times, and of bioaerosol up to 25 times higher than outdoors.
REFERENCES
[1] Vincent J. H. Aerosol sampling: science, standards, instrumentation and applications. (2007). John Wiley & Sons, 473.
[2] Madsen A. M. (2006). Exposure to Airborne Microbial Components in Autumn and
Spring During Work at Danish Biofuel Plants. Annals of Occupational Hygiene, 8, 821
– 831.
[3] Nielsen E. M., Breum N. O., Nielsen B. H., Würtz H., Poulsen O. M., Midtgaard U. (1996). Bioaerosol exposure in waste collection: a comparative study on the
significance of collection equipment, type of waste and seasonal variation. Annals of
Occupational Hygiene, 3, 325-344.
[4] Kiviranta H., Tuomainen A., Reiman M., Laitinen S., Nevalainen A., Liesivuori J. (1999). Exposure to airborne microorganisms and volatile organic compouonds in
different types of waste handling. Annals of Agricultural and Environmental Medicine,
6, 39-44.
[5] Moller E., Nielsen B. H., Breum N. O. (1995). Occupational bioaerosol exposure during
collection of household waste. Annals of Agricultural and Environmental Medicine, 2,
p. 53-59.
[6] ASTM, (2001). Standard practice for sampling airborne microorganisms at MSW
processing facilities.
[7] Lee T., Grisphun A. S., Martuzevičius D., et. al. (2006). Culturability and concentration
of indoor and outdoor airborne fungi in six single-family homes. Atmospheric
environment, 40, 2902 – 2910.
[8] Lee T., Grisphun A. S., Martuzevičius D., et. al. (2006). Relationship between indoor and
outdoor bioaerosols collected with a button inhalable aerosol sampler in urban homes.
Indoor air, 16, 37 - 47.
[9] Jensen A. P., Schafer P. M. (1994). Sampling and characterization of bioaerosols. New York, 84 – 112;
[10] Heldal K., Eduard. W, Bergum M. (1997). Bioaerosol exposure during handling of
source separated household waste. Annals of Agricultural and Environmental Medicine,
4, 45-51.
[11] Heida H., Bartman F., Van der Zee S. (1995). Occupational exposure and indoor air
quality monitoring in a composting facility. American Industrial Hygiene Association,
56, 39 – 43.
[12] Eduard W., Douwes J., Mehl R., et. al. (2001). Short term exposure to airborne
microbial agents during farm work: exposure-response relations with eye and respiratory symptoms. Occupational and Environmental Medicine, 58, 113-8.