Biomedical Laboratory Science and Technology Faculty of Health and Society
Malmö University SE-205 06 Malmö Sweden
Master programme in Biomedical Methods and Technology www.edu.mah.se/VABME
2012-05-31
Master degree thesis, 30 ECTS Examensarbete, 30 hp
Adsorption of cytochrome c onto mesoporous silica
Adsorption av cytokrom c i mesoporös kiseldioxidTannaz Horrieh
SUPERVISOR: Vitaly Kocherbitov
2
AUTHOR: Tannaz Horrieh
ABSTRACT
The adsorption of cytochrome c onto mesoporous silica (MCM-41) was investigated in this study. MCM-41 was synthesized and characterized by different methods. The pore size of MCM-41 was calculated from each method an all were in agreement with each other. Result from SAXS method showed a well ordered 2D hexagonal structure of MCM-41. To investigate the effect of pH on adsorption process, different buffers were used with various pH in the range from 3.8 to 10.7. It was observed that the maximum adsorption occurs at pH near the isoelectric point of cytochrome c. The surface charges of
cytochrome c and MCM-41 play an essential role for the process of adsorption. Desorption of cytochrome c from MCM-41 was investigated as well. Pure water and buffers with pH 7.1 and 10.7 were used to study desorption. The result shows that
desorption of cytochrome c from MCM-41 takes place at a pH above its isoelectric point.
Keywords: protein adsorption, MCM-41, cytochrome c, mesoporous materials, desorption.
This master thesis has been defended on May 31, 2012 at the Faculty of Health and Society, Malmö University. PDF file of the thesis is deposited at Malmö University Electronic Publishing database: http://www.mah.se/MUEP
Opponent: Dr. Javier Sotres
Examiner: Prof. Thomas Arnebrant
Biomedical Laboratory Science and Technology Faculty of Health and Society
3
TABLE OF CONTENT
ABSTRACT ... ... ... 2
INTRODUCTION ... ... ... 4
Protein adsorption into mesoporous materials ... ... 4
Ordered mesoporous materials: structures and synthesis... 6
MATERIALS AND METODS ... ... ... 7
Materials ... ... ... 7
Methods ... ... ... 8
RESULTS ... ... ... 12
Characterization of MCM-41 ... ... ... 12
Adsorption isotherm of cytochrome c ... ... 14
Desorption of cytochrome c ... ... ... 16 DISCUSSION ... ... ... 19 Characterization of MCM-41 ... ... ... 19 Adsorption of cytochrome c ... ... ... 22 Desorption ... ... ... 26 CONCLUSIONS... ... ... 27 Acknowledgements ... ... ... 28 REFERENCES ... ... ... 29
4
INTRODUCTION
Protein adsorption into mesoporous materials
The interaction between proteins and different interfaces has attracted attention among various areas of science like pharmaceutical science, surface engineering and food industry. Protein adsorption is involved in early stage of biofouling in biomedical and biotechnological systems e.g. biofouling of cardiovascular implants, teeth and dental restorative materials, artificial kidney membranes and so on1. In food industry the similar process leads to adverse consequences of deposited proteins at heat exchangers in food processing equipments2. Protein adsorption is involved in blood clotting and heart disease as well3. But in many applications it occurs on purpose, for examples: biosensors are made of surface-bound proteins on biotechnological devices4-6.In the pharmaceutical field the prominence of proteins as therapeutic agents has increased the interest of protein
adsorption in relation to drug delivery system, drug targeting and controlled release systems7, 8,9. Moreover, adsorbed proteins are basically responsible for biocompatibility of medical devices10. Therefore it is essential to understand the protein adsorption
mechanism for developing efficient analytical methods and advanced drug delivery systems7.
The major forces, which are involved in the adsorption, are electrostatic and hydrophobic interactions. Proteins are in general large and amphipathic molecules and can be adsorbed onto almost all surfaces11. Surface properties of the adsorbent have influence on this process e.g. hydrophobicity and electrical charge, which has been the main subject of many investigations and studies12, 13.
Another matter of interest is the adsorption of proteins onto mesoporous materials, which has attracted grate attention after its first description by Yanagisava et al14 and Beck et al 15, 16 in 1990 and 1992. However the immobilization of biomolecules in the porous materials turns to 1970s, which was pioneered by Weetall17. In 2001 a new property of MCM-41 was investigated as a drug delivery system18. Ordered mesoporous materials include four important features, which make them good candidates for drug delivery system: high ordered and homogenous pores, high pore volume, high surface area and silanol-groups at the surface, which can be modified in order to control the drug loading or
5
releasing19-21. They are great carriers for delivery of small molecular weight drugs as well as macromolecules like proteins and peptides. Their low toxicity and good
biocompatibility are other important qualities of these materials22,23.
Many investigations have been done to study the adsorption isotherms of biomolecules onto mesoporous materials with various approaches. Balkus et al23,24 have studied adsorption of cytochrome c, papain and trypsin onto MCM-41, SBA-15 and layered niobium oxide NB-TMS4. They have shown that the adsorption of proteins is dependent on pore sizes of the materials. Takahashi et al26 have investigated the adsorption of horse radish peroxidase and subtilisin on to FSM-16, MCM-41 and SBA-15. They did not observe any significant amount of adsorbed protein in case of SBA-15, despite its large pore size. The main factor that steered the adsorption was negatively charged group of the surfaces, which interacted with positively charged residues on the proteins.
However an explanation of adsorption process based on a spherical protein shape with an evenly charge distribution is not satisfying. The main problem is that the distribution of charges on proteins is asymmetric. Hence that group of amino acids, which is in contact with the surface, can bear another charge than the overall net charge of the protein7. Solving the Poisson- Boltzmann equation at charged interfaces shows a varying
distribution of ions near the interface27, results in a pH at interface, which differs, from the bulk pH. Thus proteins may rearrange and have another charge at interface than that expected charge in the bulk.
Cytochrome c (figure 1) is a heme-protein with a diameter of about 31 Å and a molecular weight of 12384 D. It contains hydrophilic groups on its surface, which makes it water-soluble. Cytochrome c is basic and positively charged under a pH near 10, which is its isoelectric point28. It shows high affinity to mesoporous materials29 and there is a vast data about its structure and spectroscopic properties30, 31. Therefore it is a great candidate for study of interactions between mesoporous materials and proteins.
Figure 1: Cytochrome c
6
Ordered mesoporous materials: structures and synthesis
Ordered mesoporous materials have pores, which are uniform in size and shape. Their pore diameter range is between 2 to 50 nm and has a large pore volume and surface area (>700 m2/g). These materials are synthesized by using self-assembled surfactants as a template and a sol-gel condensation of oxides around them. MCM-41 is one of those first synthesized ordered mesoporous materials possessing hexagonally ordered pores with a pore size of 1.5 – 10 nm. MCM-41 is synthesized by using a surfactant with a specific length (hydrophobic tail). It is dissolved in a polar solvent and with a concentration above the critical micellar concentration (CMC) and at which micelles form a hexagonal
arrangement. At the same time a precursor of oxide e.g. silica and catalyst are dissolved in the same solvent. Several processes occur simultaneously. As the surfactants form the micelles, the oxide precursors condense around the micelles32. Figure 2 presents this process schematically:
Figure 2: A schematic formation of MCM-41: first cylindrical micelles are generated. The micelles are
covered by silicates and undergo hydrolysis and form the hexagonal arrays. (The original picture is from: http://www.grin.com/object/external_document.244115/d79b7e7616824f3c403a90ede523246e_large.png)
In this paper load and release of cytochrome c on MCM-41 has been studied. It has been tried to understand the adsorption behaviour of cytochrome c onto MCM-41 by studying the effect of pH, isoelectric point and ionic strength. Release of cytochrome c was studied in pure water and buffers with various pH.
7
MATERIALS and METHODS
Materials
Synthesis of MCM-41
Hexadecyltrimethylammonium bromide (CTAB) from Sigma-Aldrich was used as cationic surfactant, ammonia solution (25%) obtained from Merck was the catalyst and tetraethyl orthosilicate (TEOS) from Fluka was served as the silica source.
Buffers
The buffers with a molarity of 50 mM were prepared by using following formula and the pH was adjusted afterword by adding HCL or NaOH if needed:
(1)
Where is desired concentration of the buffer in Molar, is the molecular weight of the salt, is total volume of the buffer in litre and is mass of needed salt in grams. Buffer used for pH 9.6 was sodium bicarbonate buffer including sodium carbonate from Merck and sodium hydrogen carbonate from Scharlau.
Potassium phosphate buffer (pH 7.0) was made of potassium phosphate dibasic and potassium phosphate monobasic from Sigma-Aldrich.
To make citric acid buffer with pH 3.8 following salts were used: citric acid monohydrate obtained from Sigma-Aldrich and sodium citrate from Merck.
Salt solutions
Two different salt solutions were used with a molarity of 25 mM, to study the effect of ionic strength on the adsorption. The salts were: sodium chloride (Merck) and magnesium chloride-6-hydrate (Riedel-de Haen). Different valences of salt give different ionic
8 Protein adsorption
Cytochrome c from equine heart, ≥ 95% pure, was obtained from Sigma-Aldrich with product number: C2506. It was used without further purification.
Methods
Synthesis of MCM-41
The procedure used to synthesize MCM-41 is based on a previous published paper32. 0.6 g hexadecyltrimethylammonium bromide was dissolved in 30 ml Millipore water. 2.45 ml ammonia solution (25%) was added. The solution was under stirring and heated to 30 ºC. After reaching 30 ºC, 2.68 ml tetraethyl orthosilicate was added to the solution and left under these conditions for 24 h. Thereafter it was heated up to 90 ºC for another 24h. After which it was filtered and washed a couple of time with Millipore water. The powder was calcined, performing following procedure: particles were heated up to 550 ºC, 1 ºC/min, stayed at that temperature for 300 min then cooled down to room temperature 5 ºC/min.
Characterization of MCM-41
Three different methods were used to characterize the mesoporous material: SAXS (Small Angle X-ray Scattering), water sorption isotherms and DSC (Differential Scanning
Calorimetry).
I. SAXS
To investigate the structure of the MCM-41, calcined samples were analysed by a Kratky compact system equipped with a position sensitive detector containing 1024 channels of width 54.4 µm (Hecus X-ray systems Gmbh, Graz, Austria). Cu Kα nickel-filtered radiation of wavelength 1.542 Å was provided by a PW 1830 X-ray generator (Philips Analytical X-ray B.V.). Diffractograms were recorded at 25 ºC temperature under high vacuum. Recorded diffraction patterns were evaluated using 3D-view software (MBraun, Graz, Austria). These data were imported in an Excel program to calculate and was obtained by using equation (2).
9
In general SAXS is used to characterize nanostructured materials. This method is based on diffracting of x-rays by a specimen according to Bragg’s law33:
(2)
Where is the x-ray wavelength, is spacing between atomic planes or repeat distance and is the incident angle (the angle between incident beam and the normal reflecting plane).
A collimated beam of x-rays is incident on a powdered sample and diffracted by particles. The particles are randomly oriented in respect to incident beams, and can reflect the beams by a specific plane. For example we can assume that some particles are oriented in that way which can reflect the beams by their (100) plane, other particle by their (110) and so on. Thus each plane in the sample has own reflections. In other words shape and size of the unit cell determines directions of diffractions. The intensity of diffracted beams is measured as a function of (diffraction angle) and results in a diffraction pattern which is used to define the structural properties of the specimen32.
II. Water sorption isotherm
Prior to water sorption isotherms measurement two different samples of calcined MCM-41 were dried in vacuum for two hours. Dried MCM-41 samples were weighed (0.0239 and 0.0222 g) in glass bottles using a Mettler Toledo balance. The samples were put in two desiccators (sodium chloride and magnesium chloride) at room temperature to uptake water. The samples were reweighed after one week (reaching equilibrium). Mass of water was calculated (0.0158, 0.0007g) and the mass ratio of water to silica was obtained. The results are plotted on a reference diagram from a previous study32.
III. Differential Scanning Calorimetry
DSC measurements were made by calorimeter DSC 1 from Mettler Toledo in a temperature range of – 70 + 80 ºC. DSC measurements were run on four different samples: three samples of MCM-41 which had adsorbed water (in desiccators including saturated salt solution: NaCl and KNO3) and one with adsorbed cytochrome c. Three samples were weighed in aluminium pans then sealed and run in DSC. One sample was
10
first weighed in the pan and then 1.79 mg water was added. Thereafter the pan was sealed and reweighed. All measurements were performed at a heating rate of 5 ºC/min.
Adsorption isotherms of cytochrome c
A series of cytochrome c solutions were prepared in concentration ranging of 0.025 – 0.4 wt% by dissolving the protein in buffer solutions of 50 mM and different pH, salt
solutions and pure water. For each protein adsorption, about 50 mg mesoporous materials were suspended in 5 g of each solution in a closed tube. The mixtures were shaken at room temperature, 350 rpm between 72 to 96 hours to ensure equilibration of adsorption. Prior to measurements of optical absorbance of protein, the mixtures were centrifuged at 14000 rpm for 20 min in order to avoid the scattering from silica particles.
Desorption of cytochrome c
In order to perform a desorption experiment first adsorption of cytochrome c was done. Four different cytochrome c solutions were prepared with concentrations: 0.025 and 0.2 wt% by dissolving the cytochrome c in potassium phosphate buffer (pH 7.1) and sodium bicarbonate buffer (pH 9.6). Two different types of potassium phosphate buffer (50 mM) were used. One included magnesium chloride and the other one sodium chloride (25 mM). Adsorption experiments were performed as described in previous section (Adsorption). After equilibrium of adsorption the mixtures were centrifuged and supernatants were separated from MCM-41. After which 5 g pure water was added to samples that had adsorbed cytochrome c from buffers with pH 7.1 and pH 9.6. One sample including adsorbed cytochrome c from buffer with pH 9.6 was suspended in sodium bicarbonate buffer pH 10.7. All mixtures were shaken at room temperature for four days to ensure equilibrium. The mixtures were centrifuged prior to absorbance measurements. Optical absorbance of supernatants was measured by UV-vis spectrophotometer after one hour and 120 hours.
Spectrophotometry
Nano Drop®, ND 1000, UV-vis spectrophotometer was used to determine optical
absorbance of cytochrome c. The volume used for performing the measurements was 2.5 µl. Supernatant of each mixture were separated after centrifuging (14000 rpm, 20 min). Absorbance of each solution was measured before and after equilibrium at λ = 409 nm
11
(407 nm for pH 10.7). A calibration curve was plotted for cytochrome c in each solvent based on the absorbance before adsorption. Adsorbed amount of cytochrome c per gram of silica was calculated by mass balance before and after equilibrium.
12
RESULTS
CHARACTERIZATION OF MCM-41
SAXS
MCM-41 was synthesized in different batches and all of them were analysed by X-ray after calcination. The diffractogram of the materials from SAXS is shown in figure 3. It exhibited four clear Bragg peaks.
Figure 3: Small angle diffraction pattern of MCM-41
The repeat distance was obtained for all samples by using equation (2). The results are shown in table 1. A mean value of d was calculated: 41.46 ± 0.55 Å.
Batch nu. I II III IV V
d(100) (Å) 41.28 41.06 41.50 42.39 41.06
Table 1: Repeat distance (d100) of synthesized MCM-41 from five different batches.
Water adsorption
The mass ratio of water to silica for each sample was calculated and the results are plotted on a water sorption isotherm diagram from another study32 to compare (figure 4). The
13
diagram shows relative humidity as a function of water to silica mass ratio. Three different regimes are observed in the diagram that follows type V of IUPAC classifications35, 36. Different IUPAC calcifications are presented in Discussion section.
Figure 4: Water sorption isotherms of MCM-41.
Result from this study Results from reference study
The diagram from figure 4 has been used as reference for calculations of pore size in this study.
Differential Scanning Calorimetry
Melting of water in different samples of MCM-41 was studied by differential scanning calorimetry. Two different groups of peaks for melting of water are observed in the DSC scan: low temperature peaks and high temperature peaks. The low temperature peaks has much smaller area than high temperature peaks. DSC diagram is presented in figure 5:
14
Figure 5: DSC peaks of melting water in MCM-41 and the bulk.
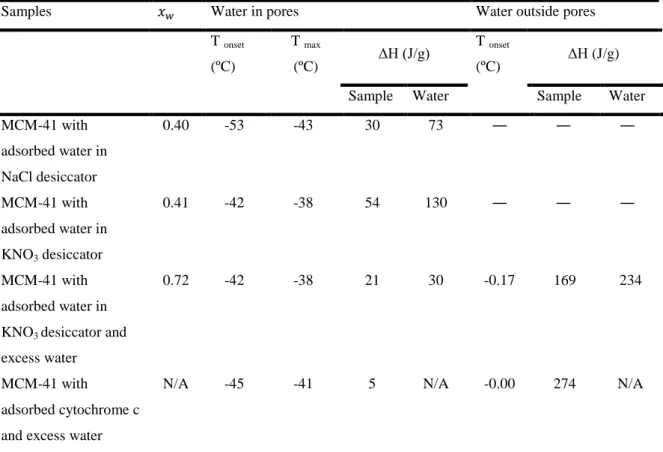
The onset temperature, max temperature for low temperature peak and enthalpy of melting of water for each sample are presented in table 2. Mass fraction of water has been
calculated using data from figure 4. First mass of water in the pores was calculated from water to silica mass ratio (figure 4).
Table 2: Mass fraction of water in the samples, melting temperature (onset and max) and enthalpy (J/g) of
samples, obtained from DSC.
Adsorption isotherms of cytochrome c
Calibration curves
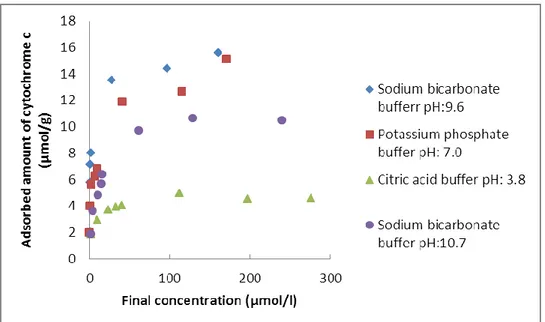
Prior to calculations of adsorbed amount of cytochrome c a calibration curve was plotted for cytochrome c in different buffers and solutions. In all cases linear graphs were obtained which are shown in figures 6 and 7:
Samples Water in pores Water outside pores
T onset (ºC) T max (ºC) ΔH (J/g) T onset (ºC) ΔH (J/g)
Sample Water Sample Water
MCM-41 with adsorbed water in NaCl desiccator 0.40 -53 -43 30 73 ― ― ― MCM-41 with adsorbed water in KNO3 desiccator 0.41 -42 -38 54 130 ― ― ― MCM-41 with adsorbed water in KNO3 desiccator and
excess water
0.72 -42 -38 21 30 -0.17 169 234
MCM-41 with
adsorbed cytochrome c and excess water
15
Figure 6: Calibration curve for cytochrome c in sodium bicarbonate buffer pH: 9.6, potassium phosphate
buffer pH: 7.0 and citric acid buffer pH: 3.8.
Figure 7: Calibration curve for cytochrome c in water and 25mM salt solutions (NaCl and MgCl2).
Cytochrome c adsorption experiments were performed in various pH, pure water and different salt solutions. Amount adsorbed of cytochrome c per gram silica as a function of equilibrium concentration is represented in following diagrams:
16
Figure 8: Adsorbed amount of cytochrome C onto MCM-41 at various pH: 10.7, 9.6, 7.0 and 3.8.
Figure 9 shows the adsorbed amount of cytochrome c on to MCM-41 from water, NaCl and MgCl2 solutions:
Figure 9: Adsorbed amount of cytochrome C onto MCM-41 from pure water, NaCl and MgCl2 Solutions.
Desorption of cytochrome c
Desorption of cytochrome c was examined in water and sodium bicarbonate buffer (pH: 10.7). Absorbance of cytochrome c in each solution was measured at λ = 407 nm. Figure
17
10 shows the results of optical absorbance measurements after 120 h. One maximum peak (red one) at λ = 407 nm is observed for cytochrome c in buffer solution with pH 10.7.
Figure 10: Plot of optical absorbance of cytochrome c after releasing in water (black, blue and orange) and
buffer with pH 10.7(red) .
Amount desorbed of cytochrome c in to different milieus (water and buffer of pH: 10.7) are presented in table 3. This table shows conditions of adsorption of cytochrome c for each sample before desorption.
18
Adsorption condition of cytochrome c
Amount of desorbed cyt c into water (µM)
Amount of desorbed cyt c into buffer pH: 10.7 (µM) 1h 120h 1h 120h 20.19 µM in buffer pH:7.1 + salt solution (MgCl2) 0.11 0.21 ― ― 20.19 µM in buffer pH:7.1 + salt solution (NaCl)
0.10 0.41 ― ― 161.50 µM in sodium bicarbonate buffer, pH: 9.6 0.31 0.62 ― ― 161.50 µM in sodium bicarbonate buffer, pH: 9.6 ― ― 28.34 43.28
19
DISCUSSION
CHARACTERIZATION OF MCM-41
SAXS
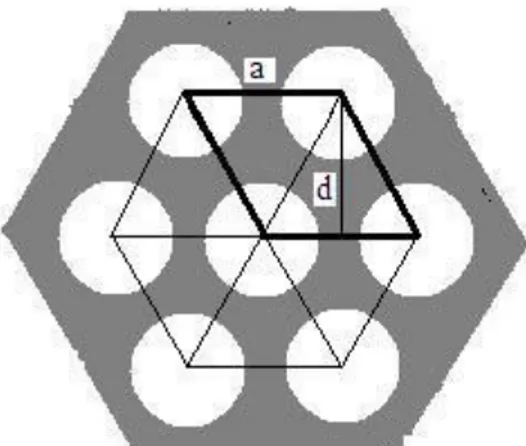
The diffractogram of calcined MCM-41 (figure 3) shows one strong peak at (100) and three weaker peaks at (110), (200), and (210), which is characteristic for a long range order of 2D hexagonal MCM-41. The space between centres of two pores is calculated by this equation:
(3)
Where hkl are Miller indices, a and c are lattice parameters of the unit cell and is repeat distance. Equation (3) at (100) is modified to:
(4)
By using the mean value of = 41.5 Å, in the last equation, a is calculated: 47.9Å. With an approximate wall thickness of 10 Å according to previous studies37, 38 a pore diameter of 37.9 Å is obtained.
Figure 11: A schematic picture of hexagonal MCM-41. Bold lines show a unit cell and d(100) is repeat
20 Sorption of water
A confined fluid in a pore condenses in a pressure lower than its saturation pressure in the bulk. This effect is called capillary condensation and depends on shape and size of the pores39. The sorption isotherm of water (figure 4) shows a long capillary condensation regime, which has been used to evaluate the structure of MCM-41. It represents relative humidity as a function of mass ratio of water to silica (g/g).
By combination of results from water adsorption and data from SAXS, the size of the pores is defined. Radius of the pores can be calculated from area of unit cell Auc and volume fraction of pores :
(5)
Where d (100) is the repeat distance (41.5 Å) calculated from SAXS measurements. The volume fraction of the pores can be obtained from water to silica mass ratio
at the end of the capillary condensation regime in figure 4:
(6)
Parameters and are the densities of water and silica which are assumed to be equal to 0.877 g/cm3 and 2.2 g/cm3 respectively (data from reference 32).
The radius of the pores calculated by eq. (5) and (6) is 19.9 Å, which gives a pore diameter of 39.8 Å.
Differential Scanning Calorimetry measurements
Another way to characterize MCM-41, which has been used in this study, is DSC by studying melting of water in the samples. Figure 5 presents the results of DSC
measurements. Two groups of peaks are observed in figure 5. One group of DSC peaks appears at very low temperature and the other group at relatively high temperature.
21
As it is observed in figure 5 areas of low temperature peaks are significantly reduced. This area shows the melting enthalpy of water in the pores (table 2) and indicates that entire amount of water in the pores has not participated in melting process. Findenegg et al40 have studied melting enthalpy of water in a series of MCM-41 with different pore sizes. It has shown that the melting enthalpy of water in the pores linearly depends on where
Figure 5 shows that Tonset of the peaks of the high temperature group is close to zero, which is the melting point of water in the bulk. Low temperature peaks show much lower Tonset than the other group. A thermodynamic approach of solid/liquid phase transition indicates a shift in melting point (ΔTm) in confined systems41,42
to a much lower
temperature than in the bulk. This point can be related to the radius of the pores by Gibbs– Thomson equation 40:
with (7)
Here T0 is the melting temperature in the bulk, is the interfacial tension between solid and liquid interfaces, is molar volume of the liquid and is the melting enthalpy in the bulk. The radius of the pores can be calculated by using a modified Gibbs-Thomson relation:
(8)
(9)
The parameter is thickness of a thin contact layer of water, which is expected at a temperature below bulk melting temperature according to classical wetting theories43. is defined by:
22
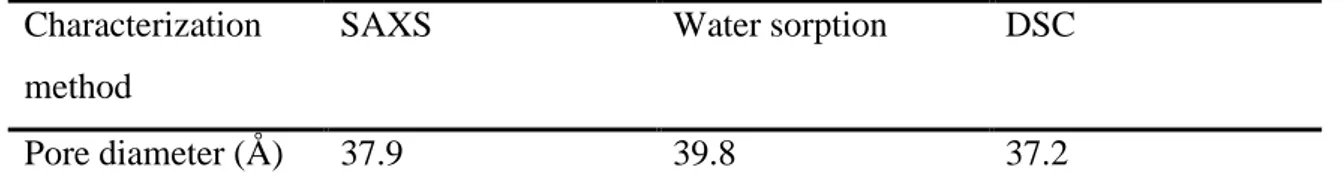
With C = 524 K Å and t = 6.0 Å (data from reference 38) and , r is calculated: 18.6 Å. Table 4 represents pore diameter of MCM-41 calculated by different methods:
Characterization method
SAXS Water sorption DSC
Pore diameter (Å) 37.9 39.8 37.2
Table 4: Pore size of MCM-41 calculated by different methods.
The pore diameter of MCM-41 in present study has a mean value of 38.3 ± 1.1 Å.
ADSORPTION OF CYTOCHROME C
Isoelectric point and pH
Adsorption of cytochrome c on MCM-41 was studied in different pH: lower, near and higher than its isoelectric point (Ip = 10) and the results are shown in figures 8 and 9. Isoelectric point is a pH in which net charge of a protein is zero. Cytochrome c is a relatively small protein with a size of ca. 26 × 32 × 33 Å and a molecular weight about 12.4 KD29. Surface charge and charge density of both protein molecules and mesoporous silicais defined by the pH of the solution44. Cytochrome c is positively charged at pH below its isoelectric point and MCM-41 is negatively charged at pH above 2, which is its Ip45.
The main forces, which are involved in protein adsorption, are hydrophobic interactions, electrostatic repulsion and attraction between amino acid residues on the protein and silanol groups on the silica surface. Also intramolecular attractions and repulsions, which cause changes in diameter of protein molecules and its conformation, affect the adsorption process46.
Adsorption isotherms in figure 8 are type I of IUPAC classifications of adsorption isotherms47. In figure 8 a sharp loading of cytochrome c is observed in low concentration
23
range which indicates a high affinity between cytochrome c and silica. Finally it reaches saturation at concentration above 0.025 wt%.
Figure 12: IUPAC classifications of adsorption isotherms
(http//:www.nippon-bel.co.jp/tech/img/semi_fig02.gif)
Results in figure 8 show an increasing of amount of adsorbed cytochrome c by increasing the pH. Minimum adsorption is observed at pH 3.8 and a maximum adsorption at pH 9.6. pH 9.6 is near the Ip of cytochrome c and the net charge of cytochrome c is very low (about zero) at this pH. The repulsive forces between protein molecules and
intramolecular repulsions are reduced. Thus it allows close packing of molecules in the pores and also a smaller surface area is needed to each adsorbed protein. This leads to high amount of adsorbed cytochrome c (15.56 µmol/g). At this point hydrophobic interactions are dominating the adsorption process.
As it is observed in figure 8, adsorbed amount has been decreased at lower pH.
Cytochrome c becomes more positively charged at pH below its Ip. This rise of positive charge results in an increase in repulsive interactions between the cytochrome c molecules as well as intramolecular repulsions. Growth of repulsive interactions negatively affects the adsorption process. Moreover when pH reduces, it closes to the isoelectric point of silica (Ip=2). As a result the negative charge of silica reduces at lower pH, which dampens
24
electrostatic attractions between cytochrome c and silica, results in decrease of adsorbed amount of cytochrome c.
At pH 10.7 lower amount adsorbed of cytochrome c is observed in figure (8) in compare to pH 9.6. At this pH (above the Ip) cytochrome c bears a negative net charge. Also silica has a negatively charge at its surface. Thus repulsion between negatively charged amino acid residues and negatively charged silanol groups of the silica negatively affect the adsorption of cytochrome c. Moreover repulsive interactions between cytochrome c molecules have been increased too.
From electrostatic point of view any adsorption of cytochrome c should be observed at this pH on the basis of similar charges on both silica surface and cytochrome c.
Cytochrome c has positive and negative amino acids and hydrophobic residues on its surface. They may take over and build some bonds to their complementary groups on silica surface. As a result it is not always possible to explain the adsorption of proteins by overall net charge and electrostatic interactions. Though they are important to adsorption to occur but not necessarily dominate it. Structural rearrangement in the cytochrome c molecules which results in changes in its surface polarity and redistribution of surface charge may cause interactions between positively charged groups with negatively charged silanol groups on silica surface.
Figure 8 is an evidence for dependence of adsorbed amount on pH and maximum adsorption occurs at a pH equal to isoelectric point of the protein. Maximum amount of adsorbed cytochrome c in this study is 15.56 µmol per gram of MCM-41(figure 8). Hartmann et al29 have investigated adsorption of cytochrome c in different carbon molecular sieves with a pore size range of 33 to 54 Å. Their adsorption isotherms follow type I Langmuir adsorption isotherm and they have maximum adsorbed amount of 18.5 µmol/g cytochrome c on mesoporous carbon. In another study by Hartmann et al48 they have used MCM-41 with a pore diameter of 41.0 Å, have a maximum adsorbed amount at pH 9.6 and reduced protein loading by decreasing the pH, which is in line with this study. Their maximum amount of adsorbed cytochrome c is 26.6 µmol/g which is more than maximum loading in this study (15.56 µmol/g). The initial concentration of cytochrome c and pH is the same in all three studies. The differences are in buffer concentration (25 mM
25
in Hartmann et al29, 48 study and 50 mM in this study) and surface properties of mesoporous materials (table 5). They have used mesoporous carbon in the first case, which is hydrophobic at its surface42 and increases hydrophobic interaction.
Mesoporous material Maximum amount of adsorbed cyt c (µmol/g) Surface properties Pore diameter (Å) Concentration of buffer (mM) Mesoporous carbon27 18.5 Hydrophobic 43 25 MCM-41 (Present study) 15.56 Negative charge 39 50 MCM-4146 26.6 Negative charge 41 25
Table 5: In this table maximum amount of adsorbed cyt c (µM/g) are compared in three
different studies in relation to surface properties of mesoporous materials and concentration of buffer. In all cases pH is 9.6 and equilibrium concentration is about 200 µM for maximum adsorption.
Results from carbon29 and MCM-4148 are obtained from same conditions (even almost same pore size), but maximum adsorbed amount of protein onto MCM-4148 is higher than mesoporous carbon29. In case of MCM-41 (39 Å) concentration of buffer is doubled (50 mM) in compare to MCM-41 (41 Å) but amount of adsorbed cytochrome c is almost the half. As a result it is concluded that surface property of the adsorbent and strength of pH solution (ionic strength) are affecting the process of adsorption.
Ionic strength
In order to study the effect of screening of ions or ionic strength on adsorption of protein other series of adsorption isotherms were performed using pure water, 25 mM salt solutions (NaCl and MgCl2) and buffer solutions (50mM, pH: 7.1) with added NaCl and MgCl2 salts (25mM), results are presented in figure 9.
The results show a decrease of the amount of adsorbed of cytochrome c with increase of the ionic strength at a pH 7. This happens because of screening of electrostatic attraction between positively charged protein and negatively charged silica.
26
The curves in figure 9 shows two different regimes: low concentration regime and high concentration regime. In low concentration regime higher decrease of adsorbed amount of proteins is observed while at high concentration range it shows lower decrease of amount of adsorbed cytochrome c. In the first regime the protein molecules are relatively far from each other and screening between them has no effect on adsorption while ions screen the surface and reduce adsorbed amount. In high concentration regime the ions screen not only attractive protein - silica interactions but also repulsive protein - protein interactions. As a result at high concentration regime, decrease of adsorbed amount is lower.
Influence of ionic strength in this study is in line with a previous study by Deere et al17 who studied the low range of protein concentrations.
Desorption
Desorption of cytochrome c has been studied in different milieus, pure water and buffer with pH: 7.1 and 10.7. Figure 10 shows optical absorbance of cytochrome c after desorption. No peaks are observed for cytochrome c in water or buffer with pH: 7.1. Present peak belongs to cytochrome c released into buffer with pH: 10.7. At this pH cytochrome c becomes more negatively charged and MCM-41 has already negatively charged groups on its surface, resulting in increased repulsive forces between protein and silica. Repulsion interactions force the cytochrome c molecules out of the pores. This shows that molecules of cytochrome c can be desorbed if their charge is reversed. To the best of our knowledge release of cytochrome c molecules from mesoporous silica caused by pH change was not observed before.
This release method based on the change in the charge of molecules can be used to control drug release from porous materials in drug delivery system. However in practice it may eliminated to compound with isoelectric point close to physiological conditions.
27
CONCLUSIONS
Synthesized MCM-41 has an ordered 2D hexagonal structure.
Porosity of MCM-41 was studied by different methods; their results are in agreement with each other.
Cytochrome c has high affinity for MCM-41.
Isoelectric point of cytochrome c is a turning point in adsorption process and maximum loading occur in this point.
Electrostatic interactions, global net charge of cytochrome c and surface properties of mesoporous material are crucial for adsorption to take place and for the amount of adsorbed protein.
Electrostatic interactions based on net surface charge of protein are important but not enough to explain the adsorption process for example when both adsorbate and adsorbent have same charge sign and despite that adsorption occurs (in this study at pH 10.7).
That region of protein which is in contact with silica surface can have another charge sign than the overall net charge. Thus other important factors take part in adsorption for example hydrophobic interactions, conformational changes of the protein.
Amount of adsorbed cytochrome c reduces by increasing the ionic strength. It is caused by the screening of attractive interactions between adsorbate and adsorbent. Release of cytochrome c occurs only at a pH above its isoelectric point.
28
Acknowledgements
I wish to thank, first and foremost, my supervisor Vitaly Kocherbitov for his patience and encouragements which made it possible to me to manage this thesis.
I thank Zoltan Blum for help with synthesis of MCM-41 and Justas Barauskas and Peter Falkman for their help with SAXS experiments.
29
REFERENCES
1. Norde W.: Colloids and interfaces in life science. Marcel Dekker, Inc., New York, USA 2003.
2. Joseph M., Irudayaraj and Soojin Jun: Food processing operations Modeling. Design and Analysis, second edition, CRC Press 2008, 235-262.
3. Feng M., Morales A.B., Beugeling T., Bantjes A., Vanderwerf K., Gosselink G., De Grooth B., Greve J.: Adsorption of high density lipoproteins (HDL) on solid surfaces. Journal of
colloid and interface science 1996, 177: 364-371.
4. Nyquist R. M., Eberhardt A. S., Silks L. A., Li Z., Yang X., Swanson B. I.: Characterization of self-assembled monolayers for biosensor applications. Langmuir 2000, 16:1793-1800. 5. Slomkowski S., Kovalczyk M., Trznadel M., Kryszewski M.: Two-dimensional latex
assemblies for biosensors. Hydrogels biodegradble polymers for bioapplications 1996, 627:172-186.
6. Sukhishvili S. A., Granick S.: Adsorption of human serum albumin: dependence on molecular architecture of the oppositly charged surface. Journal of chemical physics
1999, 110:10153-10161.
7. Hartvig R. A., van de Weert M., Ostergaard J. Jorgensen L. Jensen H.: Protein adsorption at charged Surfaces: The Role of Electrostatic Interactions and Interfacial Charge Regulation. Langmuir 2001, 27:2634-2643.
8. Vinus A., Murugesa V.. Hartmann M.: Adsorption of lyzozyme over Mesoporous Molecular Sieves MCM-41 and SBA-15: Influence of pH and aluminum Incorporation.
Phys. Chem. B 2004, 108:7323-7330.
9. Thomas B. R., van Deynze A., Bradford K. J.: Production of Therapeutic Proteins in Plants. ANR publications 8078.
10. Andrade J. D., Hlady V.: Protein adsorption and biocompatibility: A tutorial review and syggested hypotheses. Advances in polymer science 1986, 79:1-63.
11. Brash J. L., Horbett T. A.: Proteins at Interfaces II: An Overview. ACS Symposium Series; American Chemical Society: Washington, DC, 1995.
12. Al-Bataineh S. A., Hamilton-Brown P., Meagher L., Bremmel K. E., Jasieniak M., Griesser H. J.: Relationships between surface properties and protein adsorption. European Cells
and Materials 2005, 10:21.
13. Gessner A., Lieske A., Paulke B. R., Mϋhler R. H.: Influence of surface charge density on protein adsorption on polymeric nanoparticles: analysis by two-dimensional
electrophoresis. European Jornal of Pharmaceutics and Biopharmaceutics 2002, 54:165-170.
30 14. Yanagisawa T., Shimizu T., Kuroda K., Kato C., Bulletin of the Chemical Society of Japan
1990, 63:1535.
15. Kresge C. T., Leonowicz M.E., Roth W. J., Vartuli J. C., Beck J. S., Nature 1992, 359:710.
16. Beck J. S., Vartuli J. C., Roth W. J., Leonowicz M. E., Kresge C. T., Schmidt K. D., Chu C. T. W., Olson D. H., Sheppard E. W., McCullen S. B., Higgins J. B., Schlenker J. L., J. Am. Chem.
Soc. 1992, 114:10834.
17, Deere J., Magner E., Wall J. G., Hodnet B. K.: Mechanistic and Structural features of protein adsorption onto mesoporous silicates. J. Phys. Chem. B 2002, 106:7340-7347. 18. Vallet-Regí M., Rámila A., del Real R. P., Pérez-Pariante J.: A new property of MCM-41:
Drug delivery system. Chem. Mater. 2001, 13:308-311.
19. Vallet-Regí M., Balas F., Arcos D.: Mesoporous materials for drug delivery. Angew. Chem.
Int. Ed. 2007, 46:7548-7558.
20. Rámila A., Muñoz B., Pérez-Pariante J., Vallet-Regí M.: Mesoporous MCM-41 as drug hodt system. J. Sol-Gel Sci. Tech. 2003, 26:1199-1202.
21. Vinogradov S. V., Bronich T. K., Kabanov A. V.: Nanosized cationic hydrogels for drug delivery: preparation, properties and interactions with cells. Advanced drug delivery
reviews 2002, 54:135-147.
22. Qu F., Zhu G., Huang Sh., Li Sh., Sun J., Zhang D., Qiu Sh.: Controlled release of Captopril by regulating the pore size and morphology of ordered mesoporous silica. Microporous
and Mesoporous Materials 2006, 92:1-9.
23. Popovici R.F., Alexa I.F., Novac O., Vrinceanu N., Popovici E., Lupusoru C.E., Voicu V.A.: Pharmacokinetics study on mesoporous silica-captopril controlled release system.
Digest journal of Nanomaterials and Biostructures 2001, 6:1619-1630.
24. Washmon-Kriel L., Jimenez V. L., Balkus Jr. K. J.: Cytochrome c immobilization into mesoporous molecular sieves. J. Mol. Catal. B: Enz. 2000, 10:453-469.
25. Díaz J. F., Balkus K. J. Jr., Enzyme immobilization in MCM-4 1 molecular sieve, J.Mol.
Catal. B: Enz. 1996, 2:115-126.
26. Takahashi H.,Li B., Sasaki T., Miazaki C., Kajino T., Inagaki S.: Immobilized enzymes in ordered mesoporous silica materials and improvement of their stability and catalic activity in an organic solvent. Micro. Meso. Mat. 2001, 44-45:755-762.
27. Bisheuvel P. M., van der neen M., Norde W.: A modified Poisson-Boltzmann model including charge regulation for the adsorption of ionizable polyelectrolytes to charged interfaces, applied to lysozyme adsorption on silica. J. Phys. Chem. B 2005, 109:4172-4180.
28. Qi Z., Matsuda N., Takatsu A:, Kato K.: A kinetic study of cytochrome c adsorption to hydrophilic glass by broad-band, time-resolved optical waveguide spectroscopy. J. Phys.
31 29. Vinu A., Streb C., Murugesan V., Hartmann M.: Adsorption of cytochrome c on new
mesoporous carbon molecular sieves. J. Phys. Chem. B 2003, 107:8297-8299.
30. Scott R. A., Mauk A. G.: Cytochrome c, A Multidisciplinary Approach. University Science Books: Sausalito, California, 1996.
31. Moor G.R., Pettigrew G. W.: Cytochrome c: Evolutionary, structural and physicochemical aspects. Springer-Verlag, Berlin and New York 1990.
32. Kocherbitov V., Alfredsson V.: Hydration of MCM-41 studied by sorption calorimetry. J.
Phys. Chem. C 2007, 111:12906-12913.
33. Gao G.: Nanostructures & nanomaterials: synthesis, properties and applications.
Imperial college press, London 2007.
34. Cullity B. D., Stock S. R., Elements of x-ray diffraction, 3rd edition. Prentice Hall, Upper
Saddle River, NJ, 2001.
35. Donohue M. D., Aranovich G.L.: Adsorption hysteresis in porous solids. Journal of Colloid
and Interface Science 1998, 205:121-130.
36. Schneider P.: Adsorption isotherms of microporous-mesoporous solids revisited.
Applied catalysis A:General 1995, 129:157-165.
37. Chen C. Y., Li H. X., Davis M. E.: Studies on mesoporous materials I. Synthesis and characterization of MCM-41. Microporous Materials 1993, 2:17-26.
38. Chen C. Y., Burkett S. L., Li H. X., Davis M. E.: Studies on mesoporous materials II. Synthesis mechanism of MCM-41. Microporous Materials 1993, 2:27-34.
39. Neimark A. V., Ravikovitch P. I.: Capillary condensation in MMS and pore structure characterization. Microporous and Mesoporous Materials 2001, 44-45: 697-707.
40. Jähnert S., Vaca Chávez F., Schaumann G. E., Schreiber A., Schönhoff M., Findenegg G. H.: Melting and freezing of water in sylindrical silica nanopores. Physical Chemistry
Chemical physics 2008, 10:6039-6051
41. Evans R., Fluids adsorbed in narrow pores: phase equilibria and structure. Journal of
Physics: Condenc. Matter 1990, 2:8989.
42. Hummer G., Rasaiah J. C., Noworyta J. P.,: Water conduction through the hydrophobic channel of a carbon nanotube. Nature 2001, 414:188-190.
43. Löwen H.: Melting, freezing and colloidal suspensions. Physics Reports 1994, 237: 249-324.
44. Miyahara M., Vinu A., Hossain K. Z., Nakanishi T., Ariga K.: Adsorption study of heme proteins on SBA-15 mesoporous silica with pore-filling models. Thin solid films 2006, 499:13-18.
32 45. ller R. K.: The chemistry of silica. John Wiley & Sons: New York 1979.
46. Matsui M., Kiyozumi Y., Yamamoto T., Mizushina Y., Mizukami F., Sakaguci K.: Selective adsorption of biopolymers on zeolites. Chemistry- A European Journal 2001, 7:1555-1560.
47. Sing K. S. W., Everet D. H., Haul R. A. W., Moscou L., Pierotti R. A., Rouqyerol J., Siemieniewska T.:Reporting Physisorption data for gas/solid systems with special reference to the determination of surface area and porosity. Pure Appl. Chem. 1985, 57:603-619.
48. Vinu A., Murugesan V., Tangermann O., Hartmann M.: Adsorption of cytochrome c on mesoporous molecular sieves: Influence of pH, pore diameter and aluminum