Does openness affect economic growth?
A panel data on developing and developed countries
By: Awa Aagah, Sibel Baydono
Supervisor: Stig Blomskog
Södertörn University| institution of social science
Bachelor thesis 15hp
Economics | Spring term 2018
Abstract
This paper investigates the impact of trade openness on economic growth through a panel analysis containing a set of 61 countries over 15 years. The method we use is the fixed effect regression model in Stata, to see whether openness to trade has explanatory power over GDP per capita growth. We use secondary data taken from World bank and Worldwide
Governance Indicators. The data used is a panel data containing 61 countries and the period we are studying starts at 2002 and ends in 2016, a 15 years' time interval. Our empirical results suggest that openness during these years have had a small negative impact on growth, but although this, the variable does not seem to have a statistical significance upon per capita growth within this period of time. Therefore, with reference to this study we cannot see any significance of openness upon growth.
1. Introduction
It is not a secret that the existing level of development of the economies we live in have a great impact on the quality of our lives, in forms of health, lifestyle or literacy level among others. It is anchored to our lives from many sides. Very common topics that are discussed today are why are some countries more developed than others, how can it be explained? How can it be measured? We have many theories explaining differences across countries, as big of a question it is as much answers there are.
The world of economics is an interesting but complex field, there exists different schools of economic thoughts and it have been a major question in the field of development economis, whether openness to trade can be treated as an economic growth factor. Many economists argue that openness is an important growth factor for countries, since they can expand the market they compete on. It leads to not only increased revenues but also an improved production because of a better skilled and structured factories and companies, that occurs from the higher competition level that exists through this expansion on the world market. These, among others are the reasons for achievement of greater economic growth, compared to if the countries would be closed economies and only restricted themselves to the home market. Therefore, argued by many economists, openness is an effective tool for achieving long run growth for developing economies in their development stage.
In this thesis we are interested in investigating whether openness has an explanatory power over economic growth or not. The link that exists among the two variables, is investigated using an OLS and fixed effect regression model with robust standard errors. The countries chosen are a mixture of both developing and developed, since it reflects the real world and the economic heterogeneity that exists among the countries. The time interval that is chosen is 15 years, from 2002-2016 that gives us a more up-to-dated statistics and reflects the economic situation after the establishment economic globalization.
1.2 Study objective
We are interested in investigating the relationship among countries openness and their
economic growth, to see whether they have a positive link and thus lead to a higher and faster growth or not. We will do it by using a set of 61 countries and a time period of 15 years. With the help of the literature, we will present some academic theories that exists in the field of growth and trade so that we can further on continue to the empirical analysis. What this study aims to answer, with the help of previous studies, theories on growth and trade and the empirical data is whether openness has statistical explanatory power over GDP per capita for the specific chosen countries and time.
1.3 Problem statement
Does openness lead to economic growth?
1.4 Scope of the study
When we first planned this thesis, we were merely interested in looking at developing countries since they face more obstacles in achieving economic growth than the developed ones and seemed therefore of more interest. Further on we decided that we wanted a data sample that is world representative, a reflection of the real world, therefore we have chosen a mixture of developed and developing countries for our study.
This study differs from the others and perhaps have a different approach than the more
homogenous one, whom only focus on developing or developed alone. It aims to examine the effect of economic growth that is generated through openness. Worth to point out is that these various countries are being analysed in a period of 15 years, starting from 2002 and ending in 2016 which makes it a more up to date study and is thus an outcome of the macroeconomic situation of the 21st century.
1.5 Structure of the thesis
This thesis begins with an introduction part where we discuss why we chose to study this field of international economics. In the second part we present previous studies which are studies conducted by other authors in the same field, that functions as reference points and will thus strengthen our analysis. In the third part, we will present the literature review and discuss the theoretical part of this thesis, in which we will discuss growth and trade theories to give a clearer picture on how openness can contribute to economic growth. Followed by the empirical analysis, where we present data in forms of numbers and values from different sources like the World bank, to run regressions and further analyse the link between openness and economic growth. In the end of this thesis you can find the discussion part where we have linked theory and empirical analysis together to present an answer to the problem statement.
2. Earlier studies
In this section we will present some of the previous researches done by other authors in relation to the elected research problem, that will serve as reference points to our own research. It contains researches on how economic growth is generated, through various components that stimulates real growth in GDP per capita in a country.
Determinants of economic growth in a panel of countries
Barro (2003) made a cross country analysis basing his research on a set of 113 countries, in different stages of development from the period of 1965 to 1995. The study aims to
investigate if the variables such as rule of law, population, investments, terms of trade and international openness among others, has an impact on economic growth.
The numerous data shows that there is only a weak positive statistical evidence that openness, which he defined as the ratio of export to imports on GDP, stimulates economic growth. Interestingly, the study suggests that movements in terms of trade is highly significant and the estimated coefficient is positive. Both effects do matter for growth, but over a period of 10 years. Population is an interesting additional explanatory variable that is being studied by Barro. There is a general belief that higher population and bigger country size matters for economic growth, but the data has shown that the estimated coefficient is insignificant. Worth to mention is the variable investment ratio, that is defined as the ratio of real gross
domestic investment (both private and public) that had an estimated coefficient that was positive and thus statistically significant, for a period of 10 years.
He also used the rule of law, which turned out to have a positive coefficient which in turn explains that a good rule of law equals a well governed country, where investors are happy to invest, and people would like to move to. This leads to an increase in income and money flows into the economy, raising the per capita GDP growth.
In his study he included independent variables such as, initial GDP per capita showed that the effect of conditional convergence is very large compared to the other variables studies within this study. With this, Barro highlights the important influence that it has on economic growth. The focus of this study and the result is mainly on the general notion of the conditional convergence and the strong impact of the initial GDP per capita, the other variables have their role in the progress of development but not in the same secure way.
Determinants of economic growth: a cross-country empirical study
Barro (1996), made a cross sectional analysis of the determinants of economic growth and found that his research strongly supports the neoclassical's model of the central idea of the general notion of conditional convergence. By studying his numerical data, we can see a strong support for the so called conditional convergence, in which the poorer country tends to have a higher per capita growth rate once the variables such measures of government policy, initial levels of human capital, and so on is held constant.
He studied 100 countries from the year 1960 to 1990 and received the result that for a given starting level of real per capita GDP, the growth rate is enhanced by for example
improvements in terms of trade, better maintenance of the rule of law and other variables. The variable terms of trade-measured as (exports + imports/ GDP), seems to have a weak statistically significant but is not the key element for growth in the weak growth performance economies. To experience movement in real GDP, the correlation between improvements in the terms of trade and domestic output and employment must be respected. If the physical quantities domestically do not change, an improvement in the terms of trade only increases the domestic income and perhaps consumption, without affecting the real GDP. Movements in real GDP is experienced through a shift in the terms of trade that stimulates changes in the internal domestic employment and output.
Interestingly, the rule of law showed a priori to be the most relevant for investment and growth. Greater maintenance of the rule of law is favourable to growth since an improvement
by one rank in the underlying index (corresponding to a rise by 0.167 in the rule–of-law variable) is estimated to increase the growth rate on impact by 0,5 percentage points. This study shows us that the variables mentioned above has a positive relation to economic growth. What makes this study further interesting is his research on the impact of the political situation of the country on economic growth. At low levels of political rights, an increase of these rights to a moderate democracy will stimulate economic growth, while a further democratization will reduce growth. Possible reasons for this reduction are said to be heightened concern about social programs or income redistributions.
Openness to international trade and economic growth; a cross-country empirical investigation
Bűlent (2012) have made a research on the effect of openness on economic growth using several openness indicators including the trade to GDP ratio. The study is based on a longer time span, starting from 1960 to 2000 that helps us see the variables effect on economic growth under a longer period, by a set of OECD and non-OECD countries.
What differs this study except the longer time span, is his detailed research in various openness measures and each of their significance. The author argues that all these openness measurements overall shown positive and significance with economic growth in the long-run but in some cases, this result is driven by the presence of a few outlying countries.
Surprisingly, the positive significance disappears once other variables that contributes to growth such as population heterogeneity, economic institution, geography, or
macroeconomic stability are included.
This study has broadened our perspective in the field of development economics, since it contrasts with the other cross-country growth studies mentioned and discussed above. This research does not support the proposition that openness has a direct robust relationship with economic growth in the long run. By only studying the numerical data, which is the data evidence, openness is not a contributor to economic growth. Interestingly, a more reasonable and broader view of this research tells us that without other fundamental prerequisites such as developed institutions, internal ethnolinguistic management, and stable fiscal policy the trade variable is not in itself a guarantee for economic growth. Therefore, economic reforms should be a priority, followed by policies enhancing openness.
Trade openness and economic growth: a cross-country empirical investigation Yanikkaya (2003) conducted a study to investigate the relationship between openness and economic growth for a sample covering both developed and developing countries. The study investigates 80 countries from 1970-1997. In his research he uses different measures of openness and one of the measures he uses is the same as in this thesis, ((export + import)/ GDP). The other measure is trade restrictions, to see whether these prevent economic growth or not. The first variable, trade volume is positively linked with economic growth while in contrast to what the general belief is the trade restriction or barriers variable also shows a positive significance. Worth to note is that these results are essentially driven by developing countries.
This research has different and perhaps a total different contribution to the field of
development economics since this study highlights the fact that trade barriers in developing countries has shown to be positive and most specifically significant with growth, especially for developing countries. The result is supported by theoretical growth and development literature. He argues that trade liberalization is highly and merely oversold in the literature and from the financial institutions like World Bank and IMF. The reason said to be failed import-substitution policies, especially in the 1980s. This study has beside of its theoretical framework or the empirical evidence a political undertone which has raised our interest. Contrary to the political framework of liberalism, that is in favour of trade liberalization, this study, by Yannikaya shows with evident data that the promotion of such political framework within the international era is maybe after all not preferable or in favour of the developing economies.
2.1 Concluding earlier studies
All the four researches have similar starting point in which their aim is to investigate if openness contributes to growth but have various independent variables, time interval and countries. What has been interesting is their differences in outcome of this relationship, their discussions and point of view of the reasons for this relationship.
Barro (2003) highlights the notion of conditional convergence, while in his study in year 1996 he merely discusses the impact of the political situation on the economic growth. Bűlent (2012) have found that the variable openness itself is not a contributor to economic growth
and that the priority for development in a country should be on economic reforms. Yanikkaya (2003) has in this research besides the numerical study, has gone in to a more broader
discussion in international political economy and has with evident data showed us that trade barriers in developing countries, can contribute to economic growth.
3. Theory
This section aims to provide a literature review, to capture the essential theories related to economic growth. To get a broader perspective on growth we have chosen to focus on both the older and the more up to date theories. Further on we will discuss different channels within trade that can contribute to economic growth.
3.1 Theoretical discussion related to growth
The Exogenous growth theoryWithin the school of the neoclassical economists the exogenous growth theory of Solow model is one of the most highlighted and widely used in all of macroeconomics. In this model, the growth factors are exogenous which means that factors such as labour, capital and technology are contributors to economic growth. The Solow growth model was developed in the mid-1950s by Robert Solow and was awarded a Nobel Prize in 1978. The Solow growth model helped us understand why different countries have had different growth rates with introducing the transition dynamics, in which it captured the impact of capital accumulation but merely highlighted the impact of technology for the long-term economic growth.
The formula underneath explains that when investments increase within a country, the capital stock will also increase. While an increase in the deprecation rate will cause a decrease in the capital stock. Thus, we only experience rise in net investment when gross investment exceeds the amount of capital that depreciates (Jones, 2017 p. 109).
Relationship between change in capital stock and the net investment:∆𝐾𝑡+1 = 𝑠̅ 𝑌𝑡 - 𝑑̅𝐾𝑡
According to the Solow model the contributor to growth in this context is the amount of saving, since the total savings is then invested in capital which will lead to a higher output. Unfortunately, the capital accumulation is not a contributor to the long term economic growth since the economy reaches a steady state equilibrium, in which there is no growth in the
capital stock. We assume that population remains constant. In the long-run the economy settles down to a constant level of production and capital and thus there is no driving force that can encourage long term growth (Jones, 2017 p. 116).
So, if capital accumulation is not the engine for long term growth, then what is? Solow extended the model with technology as an exogenous variable and argued that technological progress will lead to a higher productivity level in per capita output of labour, which leads to increased output per capita which in turn leads to long term growth in per capita income within a country (Jones, 2006 p. 36-38).
The Endogenous growth theory
Romer (1990) developed an endogenous growth model in which economic growth is a result of internal forces and not external. The Romer model is the theoretical framework that makes a distinction between ideas and objects. In this model, economic growth is gained by the accumulation of knowledge or also called innovations, which is non-rival. In comparison to objects, ideas are nonrival. What does that mean? Ideas are nonrival in the sense that my use of an idea does not reduce the idea available for you. It means that it can be used by any number of people without the usefulness to degrade (Jones, 2017 p. 140).
We should also mention the importance of excludability in the Romer model. For a good to be produced, there must be an investor who is willing to invest in the idea and transform it to a good through production and further on sell it on the market. If it was not in this way, the investors would not invest their capital on the idea. Therefore, excludability exists in the market and that is through making a legal restriction for the use of the idea and thus give the investor the patent for it. However, this does not change the fact that ideas are nonrival (Jones, 2017 p. 141).
For the theory to be adaptable and to receive increasing return to scale, the market should be regulated and there should be patent and monopoly to derive and encourage the innovation. Romer meant that if it were unregulated, as Adam Smith argues with his theory of the invisible hand, the market will then provide too little innovation and thus not lead to the best possible of the world's (Jones, 2017 p. 148).
in per capita GDP (Jones, 2017 P. 150). How? The concept of non-rivalry explained above leads us to that per capita GDP depends on the total stock of ideas. This means that
researchers within a country produce new ideas, which will lead us to the production of these ideas into goods, which generates an income and sustained growth of income over time since ideas are infinite.
Some positive economic aspects of the spill over effects from Romer model is that when the spirit of innovation is promoted within an economy it leads to more ideas and innovations and when there exists openness among countries, other countries can take part of this international area of ideas and partly trade these new goods that are invented and produced but also themselves be inspired and catch-up to it in order to reach sustained economic growth of per capita GDP. Openness of economies can also lead to a higher amount of researcher within a country, since the researchers, which is a skilled labour force can be a source of income growth, if the countries are able to attract these researchers over the borders.
We chose to write about these theories since they portray the opposite view of growth, the traditional one which is based on the exogenous factor capital accumulation and the more up to date endogenous model that highlights the importance of ideas. Romer model stresses out the distinction between ideas and objects, and it is within the fact that nonrivalry of ideas exist and that ideas are infinite that we can experience sustain growth in a way that the Solow model could not. A mix of these two theories will lead us to a more broader and up to date theory of sustained long-term growth in GDP per capita. We find a positive relevance of the theories written above with the thesis question, since the theories explain how economic growth can be reached and sustained. The positive effect of the growth can be spread to other countries through the spill-over effect and that can only be reached through openness of the countries.
3.2 Theoretical discussion related to trade
Trading has always been a dominant process within economics, the concept of exchanging goods for money is the simplest trade we do on daily basis and have done for the many past centuries. What differ the situation now with the past is the great amount of goods and services that are being exchanged among the countries and the strong interconnectedness that
exists. Which is a result of globalization, that has linked countries with each other through integration in the economic, cultural, and political arena (Baylis, Smith, Owens 2016, p.18).
The New Trade Theory
In contrast to Ricardo and Adam smith, Paul Krugman, added a new view on trade by presenting his theory, the new trade theory in 1979, for which he was awarded the Nobel economic sciences prize in 2008. His theory gives us a clear contradictory picture of the established neoclassical theories.
Krugman writes in his paper 'increasing return, monopolistic competition, and international trade' that countries do specialize their production based on their comparative advantage because they would like to benefit from increased return to scale generated by economies of scale. Which means that a specialized higher production level leads to a lower cost per unit which generates a higher profit for the firm.
He also argues that within the real world, there is plenty of countries that trade in homogeneous goods. Contrary to the comparative and absolute advantage, Krugman
highlights the fact that within the real world there is many countries who trade homogenous goods with each other and the main reason for this type of trading is the demand for various options from the consumers side. Alongside with that it has been proven that countries do gain, even in trading homogenous goods (Krugman, 2012 p.170).
A clear result of this is the trading of automotive between Japan and Germany, in which both countries have highly developed automotive industries, but both countries trade automotive with each other because the citizens in both countries strive for more automotive options.
Hence, Krugman portrays a contrary picture of the trading system and the benefits of it. It is also of great importance to highlight his positive view on economic integration among
countries, which leads to increased competition among the firms within the market. When the economies liberalize their markets and open for trade the competition among the firms will increase, but the competition is not only among the firms domestically, but it is also a competition for survival alongside the international firms. Thus, the market is free for competition and the result of it will let the best performing firms survive and this has a positive impact on the productivity, since the productivity level increases and that in turn generates growth. Besides, when economies are integrated with each other, the market in
which products can be sold will expand and are not restricted to the domestic market, this expansion has proven to generate higher sales opportunities (Krugman, 2012 p. 172).
Technology transfer
Technology transfer is another positive effect of openness. Technology transfer can be described as the act of converting scientific or innovative ideas into technological advances and distribute it to wider geographical places. The distribution mainly covers the share of skills, knowledge, technology and technological equipment, methods of manufacturing and so on. The positive effect of the technology transfer across the borders, with the existence of economic integration as discussed above is that the developing countries can take part of this success and use these tools as a way of reaching economic growth.
The many empirical as well as theoretical studies of economic growth has confirmed that the huge differences in per capita output among countries are greatly about differences in
technology. So how does technology transfer provide economic growth? That is because of the diminishing returns, and that it is the most effective way in which the developing
countries can catch-up with developed countries is through technological process, since that can contribute to convergence in per capita output in the long run perspective (Van den berg, 2001 p. 224).
Why technology transfer is an important tool within the trade pattern is its positive effect on the economic growth. Original research is high-costly, requires specialized inputs that may be limited in less-developed countries. Further on, the production of new products requires highly educated labour force, such as engineers, scientists, or highly innovative people. The high level of human capital that is required for research and development and the complexity of the industries exists in the more developed countries, therefore, the less developed
countries should take advantage of this. Through opening their economies and by developing links between the domestic and the global economy, they can reach economic growth. The focus should not only be on increasing the innovation level itself domestically but more on the impact of transferring it and the concept of openness for a country. For it is through these that we can experience economic growth.
4. Empirical Analysis
In this section we will be discussing our model (of choice) for the regression analysis to begin with. Afterwards we will explain the variables we use in our model and lastly analyze the results from the regression model. We are going to use 61 countries, both developed and developing over a period of 15 years in a panel data analysis of 3 periods each consisting of 5-year average values. We have conducted a panel data and run a Hausman test to see
whether fixed effect is the best model or if both fixed and random are the same. The result we got was a Hausman statistic of 0,015 which tells us that fixed effect will be the best model for our regression data. We will be estimating using the fixed effect model with robust standard errors, we have 5 independent variables and we are going to make 3 regressions, adding the variables in turn to examine their effects on growth.
We have chosen to run a linear regression model for our data, note though that the GDP initial variable is put into the regression as a log variable. The fixed effect model helps us to look at the variables effects on per capita growth holding time constant.
𝐺𝐷𝑃𝐺𝑅𝑂𝑊𝑇𝐻 𝑡 = α + 𝛽1LOG 𝐺𝐷𝑃𝑖𝑛𝑖𝑡𝑖𝑎𝑙 𝑡 + 𝛽2𝑇𝑟𝑎𝑑𝑒𝑡 + 𝛽3𝐹𝐷𝐼𝑡+ 𝛽3POP𝑡 + 𝛽4𝑅𝑢𝑙𝑒𝑡 + ɛ𝑡
Variable Expected sign Source
Real GDP per capita growth
Dependent variable World bank (2017)
Log initial GDP Negative World bank (2017)
Trade (%of GDP) Positive World bank (2017)
FDI Positive World bank (2017)
POP (%) Negative World bank (2017)
Rule (index) Positive Worldwide Governance
4.1 Regression model
GDP per capita growthIndependent variable we have chosen to investigate is the growth rate of GDP per capita, since we are interested in how openness affects the growth of a country. We find GDP per capita to be the most suitable measure since it measures not only the overall GDP of a country but also the living standards, since its GDP per person. The income per person, for each country. Also, looking at earlier studies conducted by as well as Barro (2003) and Yanikkaya (2003) amongst others, theories of growth, Per capita GDP growth is always used as a measure of a countries growth rate.
The GDP per capita, gross domestic product per capita is the total value of all products and services produced in a country in a year divided by the population size.
Independent variables and predicted signs; Log of the initial GDP per capita
For this variable we have taken the GDP per capita for the base year is 2002, 2007 and 2012, and taken the log of those values. This variable should be able to explain the conditional convergence of the neoclassical theory and as Barro (1996) estimates growth he uses this as one of the independent variables, after looking at several papers and theories we realized that GDP is in most cases estimated to be negatively correlated with the growth rate.
This variable controls for the catch-up effect.
Openness
This is the independent variable of interest for this thesis. There are several ways to investigate openness and we have chosen to use one specific definition. In this thesis openness is defined and calculated as the total value of all export plus the total value of all imports divided by the GDP of a country in a year, which gives us the total trade to GDP ratio i.e. the part of a country's GDP that comes from the trade. The question is then, does GDP per capita increase if trade to GDP ratio increases holding all other things constant. As we have seen from other studies, this is the most common openness indicator used by economists. Still, this doesn’t mean that there are no alternative measures, there are several openness and trade related indicators but we found this one of interest to our study. We know
that there is a chance, as for all variables to be a bias estimate. Earlier studies made by many but particularly Yanikkaya (2003) predicted and obtained a positive sign for the coefficient of openness, theories also suggest that trade open new opportunities to trade with countries and take advantage of the countries own resources. Barro (2003) also estimates openness upon growth as to be positive.
FDI net inflows (% of GDP)
Foreign direct investment is the total investments made in a country by investors with a residency in other countries. This variable is one out of probably several investment
measures. It examines whether an increase of foreign investments has an impact on the GDP per capita growth. Also, FDI is a fairly new measure used by economists in studies that conducted newly. We were able to find statistics for it on the world bank data base.
Population growth (%)
The annual growth rate of the population in each country. Population growth has said to be an important factor for the GDP per capita. We can see that in theories of growth as GDP per capita is defined as (GDP/population). Therefore, according to this definition, we believe that population should be negative. Meaning that as population increases holding GDP constant per capita income should decrease since we have the same amount of wealth to be distributed among more people, resulting in less money per person.
Rule of law
This estimates how efficient the government is. Contains four universal principles;
accountability, just law, open government, and accessible and impartial dispute resolution. Barro (2003) used this variable in his analysis of the growth per capita, the result he obtained for this variable was a positive but small value of coefficient for rule of law. The reason behind the use of this variable is since it is a measure of how a country is ruled and governed, which does have an impact on investors and people who consider moving to a country, thus affecting the production and by tern also the growth in GDP per capita. Having an efficient government mostly means that it prioritizes the wellbeing of its citizens and that again should in one-way lead to growth in GDP per capita.
Time
This variable is used only for our later model where we control for the fixed effect. Time used here is from 2002-2016, i.e. 15year interval.
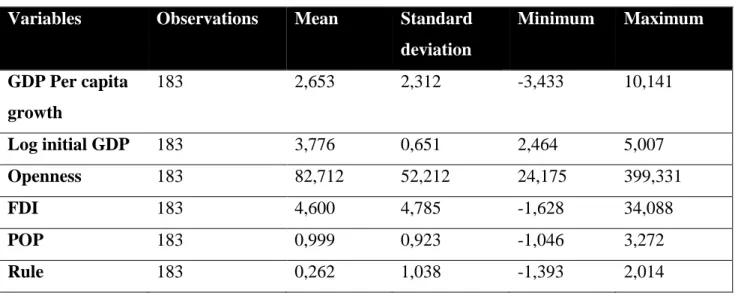
Table 2. Descriptive statistics
Variables Observations Mean Standard
deviation Minimum Maximum GDP Per capita growth 183 2,653 2,312 -3,433 10,141 Log initial GDP 183 3,776 0,651 2,464 5,007 Openness 183 82,712 52,212 24,175 399,331 FDI 183 4,600 4,785 -1,628 34,088 POP 183 0,999 0,923 -1,046 3,272 Rule 183 0,262 1,038 -1,393 2,014
4.2 Econometric result
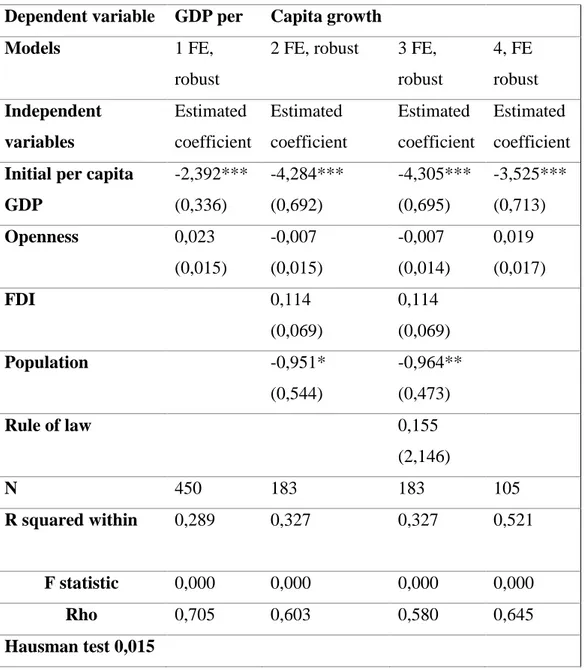
Table 1. Regression resultsDependent variable GDP per Capita growth
Models 1 FE,
robust
2 FE, robust 3 FE, robust 4, FE robust Independent variables Estimated coefficient Estimated coefficient Estimated coefficient Estimated coefficient Initial per capita
GDP -2,392*** (0,336) -4,284*** (0,692) -4,305*** (0,695) -3,525*** (0,713) Openness 0,023 (0,015) -0,007 (0,015) -0,007 (0,014) 0,019 (0,017) FDI 0,114 (0,069) 0,114 (0,069) Population -0,951* (0,544) -0,964** (0,473) Rule of law 0,155 (2,146) N 450 183 183 105 R squared within 0,289 0,327 0,327 0,521 F statistic 0,000 0,000 0,000 0,000 Rho 0,705 0,603 0,580 0,645 Hausman test 0,015
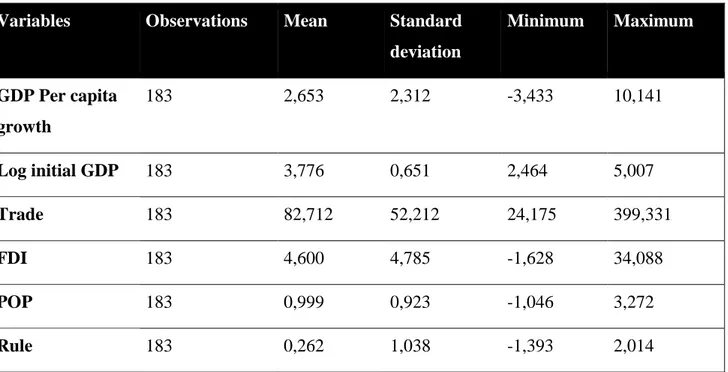
Table 2. Descriptive statistics
Variables Observations Mean Standard
deviation Minimum Maximum GDP Per capita growth 183 2,653 2,312 -3,433 10,141 Log initial GDP 183 3,776 0,651 2,464 5,007 Trade 183 82,712 52,212 24,175 399,331 FDI 183 4,600 4,785 -1,628 34,088 POP 183 0,999 0,923 -1,046 3,272 Rule 183 0,262 1,038 -1,393 2,014
All values rounded to 3 decimal places
We have tested our data to see whether we must worry about multicollinearity and
heteroskedasticity. The VIF test of 2,26 indicates that we do not need to worry about severe multicollinearity. Another test, which is the Breusch pagan test gives a result of 0,000 and that tells us we do have heteroskedasticity and we do correct for it using robust standard errors in all our regression model estimates. The regressions show a low R squared within value 0,289 and 0,327 for the fixed effect models. This indicates a low fit of the model but to get a clearer picture the F statistic is a better estimate for the fit of a model.
The rho value decreases as we add variables into the model predicted. A rho value of 0,580 means that 58% of the variance is due to differences across panels. The forth model
investigates only OECD countries, to see whether the result would be different from that of the regression with both developed and developing countries, but it seems like openness is still insignificant and has no explanatory power upon per capita growth.
Log initial GDP per capita
To be able to see the effect of the “catch up effect” in our model the first independent
(2003) and the neoclassical theory there is a convergence between ln per capita GDP and the per capita growth. Barro (1996) uses this variable and has been discussing that since this variable is constant over time, it cannot be used in fixed effects models. We have tried that and seen that the variable gets omitted, since fixed effects are only for time different
variables which initial GDP in this case is not. Barro (1996) has used panel data with periods of average data, which we also have done in table 1. Initial log per capita growth does show significance at the 1% level in all three models predicted. The coefficients vary between the models but in the third model we have a value of -4,305***. The result strongly fits in with Barro (2003) and (1996) and Yanikkaya (2003) results of a negative and strongly significant impact of log initial GDP and GDP per capita growth.
Openness
This thesis is investigating the relationship between openness and growth; therefore, this is, in this thesis the most important variable to discuss. Barro (2003) and Yanikkaya (2003) found in their studies that openness to trade seemed to have a positive correlation when explaining growth. Table 2 consists of 3 regression outputs all estimated using robust
standard error and fixed effects. The variable of openness seems to have a different output in the 3 models. As we increase the number of variables the coefficient decreases turn from 0,023 to -0,007. It can´t be said that openness has explanatory power over GDP and the reason is that the variable is insignificant, it has a p value too that is too high. Consistent however with the earlier studies mentioned is the fact of insignificance but also the finding of the coefficient to be relatively small compared to other variables explaining for growth. gives a coefficient for openness equal to -0,007 which is compared to the other explanatory
variable coefficient relatively small. The problem that occurs is when we want to estimate openness in the same regression as the initial GDP model, as we have obtained, using the fixed effect and accounting for the catch-up effect we get a negative insignificant coefficient for trade. With this said, although we get different values when estimating, using 61 and 150 countries respectively it matters not much since the estimate is insignificant. Problems occur when estimates are not significant meaning they need not to be discussed and are of no importance but, we must discuss his since it’s the core of this study. Some earlier studies suggest that openness does and some that it does not have significant effect on growth and we see here that it seems to not have. It seems like Yanikkaya suggests that other variables are explanatory such as policies and barriers but not openness itself. We made a forth regression to estimate only OECD and it turned out to be insignificant there as well. Most trade
literature that says there should be significance are old compared to the period this study is using and that can be problematic since things have changed and openness and trade are being used differently now than they were 50 or 100 years from now.
We have looked at the openness variable with a 95% confidence interval and we can see that the variable ranges from -0.0069098 to 0.0526971, which means that 95% of the times we can be confident that openness is between -0,69% and 5,27% of the total GDP per capita growth. Since 0 is within this range its insignificant, also we can see from this that its close to zero. A 10% increase in openness would according to our results in models 2 and 3 (-0,007) lead to (after calculations made) a decrease in growth of 6,5%. The p value however is at a level of 0,13 which indicates non-statistical significance.
confidence interval values of openness, we can see that it is close to zero and that means that 0 is a possible value of openness effect upon growth. This confirms that at the 5% level of significance, since zero is a possible value, openness can not be said to be statistically significant. So, we can say again that there is a change in how trade is being used nowadays compared to earlier and its part in the national economy.
POP
After looking at earlier studies including population as an independent variable to examine growth per capita we have seen that models show a negative effect of population upon growth. In our model, the population coefficient turned out to be -0,951, which was predicted from the beginning. The variable also shows very high significance, which is at the 1% level. The result supports the prediction made by Barro (2003) that a decreasing population growth leads to higher growth per capita, since we divide GDP/population. Decreasing the
denominator, population makes the whole fraction increase. So, GDP per capita increases and so does growth. In the second model population is included and we can see that the variable doesn’t change sign between model 2 and 3 but it becomes greater (-0,964) and its
significance decreases from 10% level in model 2 to the 5% level in model 3 when an additional variable is added.
Additional variables
There are two more variables in the regression models, but these do not show any statistical significance in our models. Rule of law is only in model 3 with a coefficient of 0,155, whilst
FDI is included in models 2 and 3. The coefficient for FDI does not change between the two models 0,114. Barro (1996) also received a positive result from the variable rule of law.
4.3 Econometric discussion
As you have seen in the previous section we have used a panel data analysis in this thesis. We tried out a different approach using panel data for each year, without dividing years into periods. As we made the regression with fixed effect robust standard error, log initial GDP was omitted due to that the variable is indifferent over time. Therefore, we chose to use a panel of 3 periods consisting of 5 years per period, just the same approach as Barro (2003) made in order to keep the log initial GDP per capita. We have seen that the variable of per capita GDP log does have a negative and significant coefficient which is the case in other studies of growth conducted by Barro (2003 and 1996) and Yanikkaya (2003). The variable of interest of the study is the openness measure and it is present in all three models.
The R squared values were quite small, less than 0,5 but that’s not the best measure of fit anyhow. He F statistic for model 3 of 0,000, and that tells us that our model is fine and can be used as a regression result.
We received a surprising result, a negative value of trade to openness coefficient, -0,07 it is a small number and it has a high p value of 0,563 which is too high to be significant. There can be various of reasons to why we received a negative result. Our study is conducted on a different time period than most earlier studies conducted by Barro, yanikkaya and Bülent who all investigated growth in the 20th century whilst our is on data from the 21st century. From the descriptive statistics we can see that there is a country with a large number for openness, at approximately 399%. We did a regression excluding 2 countries, Singapore and Mexico but the results we got were similar, a small coefficient with a negative sign and insignificant due to a high p value.
Another reason for the negative result may be the fact that the financial crisis occured during the years that we have been investigating. The crisis played a fundamental role on economies across the globe and such an event causes great destructions in economies and it takes years to recover from them. Another explanation is the general notion of conditional convergence discussed earlier by Barro (2003). Which tells us that the GDP per capita will tend to grow
faster for the developing countries than the developed, but that all economies will converge in terms of GDP per capita. This can explain for why the result of this essay became negative, since the peak of globalization era is over for the chosen studied years and that the countries that we studied had a reached potential level of openness. After all, according to Bülent (2012) trade itself does not contribute to growth without a specific underlying criteria to be fulfilled. Examples of such criteria he mentions are well structured institutions, well governed fiscal and trade policies.
Foreign direct investment has been used as a measure for the impact of investment upon growth. There are several measures but his one is a rather new measurement, the problem with this variable is that it correlates with trade that is why we did the first regression model excluding FDI. Correlation matrix is found in table A2 in appendix. Robust standard errors are used, and from our mean vif of 2,26 we can say that although some variables seem to be correlated, multicollinearity is not a severe problem since all variables have a vif smaller than 4.
Population seems to be significant and negative in our results. We expected a positive relationship as Barro (1996) found in his study, a positive relationship between population growth and per capita growth. Looking at the definition of per capita growth
(GDP/population = GDP per capita), it seems reasonable that per capita decreases as population increases while holding GDP constant. This can be explained by the fact that population does not only grow by newborns, but also through channels like immigation, in which the income level is increased through the expanded level of labor force. Our model suggests a negative and significant relationship, and that can be explained by events like the financial crisis, when the unemployment rate increased highly, followed by immigration. The outcome of it was that an increasing part of the population lost their jobs, with the inflow of immigrants alongside other factors lead the economy in to a recession that took a long time to recover. The rule of law measure was as mentioned above insignificant with a coefficient of 0,155.
The rule of law was insignificant in our models with a positive estimated coefficient,
consistent with the results of Barro (2003). According to our results the rule of law seems to not be a significant variable o explain changes in GDP per capita growth.
5. Summary
We can now after presenting theories, older studies and examining our own regression model answer the question for this thesis. From our panel data analysis, we have seen that trade openness seemed not to have any significant results, i.e. it has no explanatory power over per capita GDP. This result is consistent with results from earlier investigations carried out in the same field. The previous research discussed in this thesis has also concluded that openness seems not to have a strong significance with economic growth.
In this thesis the empirical tests have shown that there is no statistical significance, and the coefficient is a small negative value of 0,07. In order to capture, why the result became insignificant and negative we should look over the statistical part and see what might be the contributor for this result. One of the contributor to this result is the heterogenity of the mixed sample of developing and developed countries that we have chosen. To choose only
developed or developing could have given a more expected value, rather than an insignificant negative value. The second and most important is the chosen time period which is 21st
century. Many of the researches that we have studied investigates the 20th century and thus is a reflection from the macroeconomic and the political economy from that time, it was a great century with a lot of progress in the production and developing sector within the world of economy. Factors such as industrialization, liberalization of world politics merely in Europe and United states and the great impact of globalization on countries affects the statistics from this period of time. Our study focuses on 21st century statistics, we can see an insignificant result. Why is it so? The economical situation of the world has changed. A strong argument can be that of conditional convergence, in which the countries we have studied have reached their stagnant stage during the peak of globalization and further growth is thus not
contributed by openness alone. Another result we got was when looking at tables 2 and 3 which gave the same value of openness (-0,007) that looking at a 95% confidence level the coefficient is close to zero, the lower boundary is as small as -0, 0069098. Another
interesting thing we looked at is that given a 10% increase in openness leads to a 6,5% decrease in GDP per capita growth.
This result does not fully represent the same effects of trade on growth as with the evidence of the findings of Barro (1996) who found that openness can to some extent explain the growth rate of a country. Barro (1996) however used the variable terms of trade and although
he received a positive and significant result in his study, he argued that trade needs to occur at the same time as the labour force and the domestic production increases.
So, we can conclude that trade itself does not lead to growth, if the domestic production and the labour force level is constant. However, there is also studies that shows the opposite, such as Yanikkaya (2003) that concludes that trade barriers in developing economies actually generates growth.
The literature review has provided us theories such as exogenous growth models, in which the growth is generated by capital accumulation, unfortunately this has in long-term
diminishing returns. The Solow model in turn has theoretically shown us that investments in technology and research and development are contributors to long-term growth. Lastly, the more up to date theory, the Romer model, highlights the importance of the ideas and
innovation as a long-term contributor to economic growth. Studying trade patterns alone also shown us that trade itself has indirectly lead to growth through technology transfer and the spill-over effect.
Lastly, we would like to stress out that the foundation pillar for economic growth is the social and political infrastructure, rules, and regulations but also the institutions that implement the rules since they are the fundamental reasons for how an economy is governed and how attractive it seems for the long-term investors in the world. Since long-term investment in capital or skills and technology are linked with long-term economic growth, it is of great importance that factors such as corruption are excluded from the government and that the country is financial safe and functions as a progressive investment platform (Jones 2002, p.153).
This thesis contributes to the field of development economics, since it studies the impact of openness on per capita GDP growth. What makes it outstanding from the many other studies is that it is a more up to date study, with fresh statistics that investigates the relationship of trade and growth amongst others in the 21st century. It is also more legitimate, since it reflects the heterogeneity of the real world. Lastly, we would like to mention that we are just
beginning to understand theoretically and empirically the mechanisms of economic growth, and much work has yet to be done.
6. References
1. Barro, Robert, 1996. Determinants of economic growth: a cross-country empirical study, NBER working paper 5698.
Available at: http://unpan1.un.org/intradoc/groups/public/documents/apcity/unpan027110.pdf
2. Barro, Robert, 2003. Determinants of economic growth in a panel of countries, Peking university press, annals of economics and finance 4, 231-274.
Available at: http://down.aefweb.net/WorkingPapers/w505.pdf
3. Baylis, J., Smith, D. & Owens, P. (2016). The Globalization of World Politics. 7th. edition. Oxford: Oxford University Press.
4. Jones, C. (2002). Introduction to economic growth. 2th. edition. W. W. Norton & Company, Inc.
5. Jones, C. (2017). Macroeconomics. 4th. edition. W.W. Norton & Company, Inc.
6. Krugman, Paul, 1979. Increasing returns, monopolistic competition, and international
trade, Journal of international economics 469-479. North Holland publishing company.
Available at: http://econ.sciences-po.fr/sites/default/files/file/krugman-79.pdf
7. Krugman, P., Obstfeld, M. & Melitz, M. (2012). International Economics Theory and
Policy. 9th. edition. R.R Donnelley/Willard.
Available at: http://zazzai.my1.ru/_ld/1/103_International_E.pdf
8. Ulaşan, Bülent, 2012. Openness to International Trade and Economic Growth: A
Cross-Country Empirical Investigation, Central Bank of the Republic of Turkey. Discussion
paper no. 2012-25.
Available at: http://www.economics-ejournal.org/economics/discussionpapers/2012-25/file
9. Van den Berg, H. (2001). Economic growth and development: an analysis of our greatest economic achievements and our most exciting challenges. Irwin/McGraw-Hill.
10. Yanikkaya, Halit, 2003. Trade Openness and economic growth: a cross country
empirical investigation, Journal of development economics 72, p.57-89.
Available at: https://www.sciencedirect.com/science/article/pii/S0304387803000683
11. World trade organization (2017). Technology transfer.
Available at: https://www.wto.org/english/tratop_e/trips_e/techtransfer_e.htm (accessed 2017-10-23)
12. World bank (2017). Foreign direct investment (% of GDP).
Available at: https://data.worldbank.org/indicator/BX.KLT.DINV.WD.GD.ZS (accessed 2017-12-10)
13. World Bank Database (2017). Trade (% of GDP).
Available at: https://data.worldbank.org/indicator/NE.TRD.GNFS.ZS (accessed 2017-10-28)
14. World Bank Database (2017). population growth (annual %).
Available at:https://data.worldbank.org/indicator/SP.POP.GROW (accessed 2017-11-02)
15. World Bank Database (2017). GDP per capita (current US$)
Available at: https://data.worldbank.org/indicator/NY.GDP.PCAP.CD (accessed 2017-10-28)
16. World Bank Database (2017). GDP per capita growth (annual %).
Available at: https://data.worldbank.org/indicator/NY.GDP.PCAP.KD.ZG(accessed 2017-10-28)
17. World governance indicators project. Rule of law estimate. Available at: https://govindicators.org/ (accessed 2018-04-27)
7. Appendix
Table 1A, list of countries used in the regression model.
61 countries
measured in 15 years
India
Albania Indonesia Antigua and Barbuda Italy Argentina Japan Australia Kazakhstan
Austria Kenya
Bangladesh Korea republic Belarus Kyrgyz republic
Bolivia Malaysia Brazil Malawi Bulgaria Mexico Canada Moldova Chile Morocco China Netherlands
Cote d´ivore New Zealand Colombia Nicaragua Costa Rica Nigeria Czech Republic Norway Denmark Pakistan Dominican Republic Panama
Ecuador Peru
Egypt, Arab republic Philippines
Estonia Poland
Finland Portugal
France Romani
Germany Russian federation
Ghana Spain
Guyana Singapore
Honduras Sweden
Hungary United states
Table A2. Correlation matrix
Variables GDP per capita Growth initial GDP per capita
Openness FDI POP rule
GDP per capita growth 1,000 Log initial GDP per capita -0,471 1,000 Openness 0,075 0,124 1,000 FDI 0,072 0,128 0,587 1,000 POP -0,070 -0,432 -0,064 -0,142 1,000 Rule -0,398 0,828 0,176 0,161 -0,300 1,000
All values rounded to 3 decimal places
Table A3. Countries used in the first regression model
150 countries Regression 1 Country Name
Angola Macao SAR, China
Albania Morocco
United arab Emirates Moldova
Argentina Madagaskar
Armenia Mexico
Antigua and Barbuda Macedonia, FYR
Australia Mali
Austria Malta
Burundi Mongolia
Belgium Mozambique
Benin Mauritania
Bangladesh Mauritius
Bulgaria Malawi
Bahamas, The Malaysia Bosnia and Herzegovina North America
Belarus Namibia
Bolivia Nicaragua
Brazil Netherlands
Brunei Darussalam Norway
Bhutan Nepal
Botswana New Zealand
Central African Republic Pakistan
Canada Panama
Switzerland Peru
Chile Philippines
China Palau
Cote d'Ivoire Poland
Cameroon Portugal
Congo, Dem. Rep. Paraguay
Congo, Rep. West Bank and Gaza
Colombia Qatar
Comoros Romania
Costa Rica Russian Federation
Cyprus Rwanda
Czech Republic South Asia
Germany Saudi Arabia
Dominica Sudan
Denmark Senegal
Dominican Republic Singapore
Algeria Sierra Leone
Ecuador El Salvador
Egypt, Arab Rep. Serbia
Spain Suriname
Finland Slovak Republic
Fiji Slovenia
France Sweden
Gabon Swaziland
United Kingdom Togo
Georgia Thailand
Ghana Tunisia
Gambia, The Turkey
Guinea-Bissau Tanzania Equatorial Guinea Uganda
Greece Ukraine
Grenada Uruguay
Guatemala United States
Guyana Uzbekistan
Hong Kong SAR, China St. Vincent and the Grenadines
Honduras Vietnam
Croatia Samoa
Haiti Yemen, Rep.
Hungary Zambia Indonesia Zimbabwe India Ireland Iceland Israel Italy Jamaica Japan Kazakhstan Kenya Kyrgyz Republic Cambodia Kiribati
St. Kitts and Nevis Korea, Rep. Lao PDR Lebanon Liberia St. Lucia Sri Lanka Lithuania Luxembourg Latvia
Table A4. Summary statistic for regression model 1
variable Observartions Mean Standard
deviation minimum Maximum GDP per capita growth 450 2,408 2,869 -9,265 17,505 Initial GDP per capita 450 8,330 1,613 4,808 11,578 openness 450 91,044 54,150 21,873 412,233
All values rounded to 3 decimal places
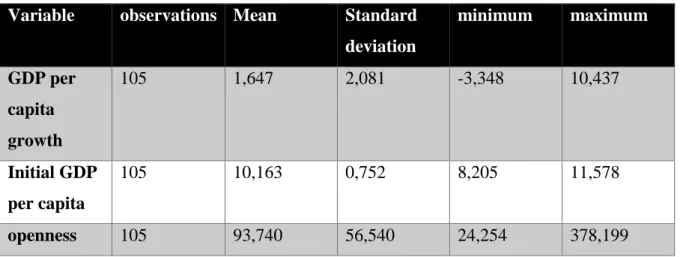
Table A5. Summary statistics for regression model 4
Variable observations Mean Standard
deviation minimum maximum GDP per capita growth 105 1,647 2,081 -3,348 10,437 Initial GDP per capita 105 10,163 0,752 8,205 11,578 openness 105 93,740 56,540 24,254 378,199