ÅKERS SWEDEN AB
OUTBOUND LOGISTICS
Reduction of Environmental Effects
Anders Gustafsson
Carina Larsson
Henric Sundström
BACHELOR THESIS 2009
INDUSTRIAL ENGINEERING AND MANAGEMENT
Logistics and Management
Postadress: Besöksadress: Telefon: Box 1026 Gjuterigatan 5 036-10 10 00 (vx) 551 11 Jönköping
ÅKERS SWEDEN AB
UTGÅENDE DISTRIBUTION
Reducering av miljöpåverkan
Anders Gustafsson
Carina Larsson
Henric Sundström
Detta examensarbete är utfört vid Tekniska Högskolan i Jönköping inom ämnesområdet logistik. Arbetet är ett led i den treåriga
högskoleingenjörsutbildningen. Författarna svarar själva för framförda åsikter, slutsatser och resultat.
Handledare: Karin Havemose
Omfattning: 15 högskolepoäng (C-nivå) Datum: 2009-05-26
Preface
I
Preface
This thesis work was initiated by Åkers Sweden AB in January 2009 and finished in May 2009. The work has been a great experience and has brought us a good view of Åkers Sweden AB’s distribution and their distributors.
We want to send our gratitude to Mikael Andersson, Master Planner, Åkers Sweden AB for his initiative and advices during our work. Also, thanks to Ulrika Scherberg, Logistics Manager, Åkers Sweden AB for initiate guidelines. Furthermore, thanks to Åkers Sweden AB’s distributors represented by: Christel Johansson, Christer Jakobsson, Mats Möllersten, Mats Nilsson, and Thomas Edström.
Special thanks to our opponents, Carolina Lassas and Charlotte Westling, and our supervisor Ph.D. Karin Havemose.
Jönköping, May, 2009
Anders Gustafsson Carina Larsson Henric Sundström
Nomenclature
II
Nomenclature
BPEV Battery powered electric vehicleCH4 Methane
CO Carbon monoxide
CO2 Carbon dioxide
EC European Commission
EEA European Environmental Agency EEC European Economic Community
EU European Union
FCEV Fuel cell electric vehicle GHG Green House Gas HC Hydrocarbon HEV Hybrid electric vehicle
ICEV Internal combustion engine vehicle IMO International Maritime Organisation
IPCC Intergovernmental Panel on Climate Change ITS Intelligent Transportation Systems
NOX Nitrogen oxides
NTM Network for Transport and Environment
PM Particulate matter
SO2 Sulphur dioxide
T&E European Federation for Transport and Environment UNFCCC United Nations Framework Convention on Climate Change
Summary
III
Summary
Environmental issues have become increasingly more important the last decade. It is of great importance to reduce emissions of green house gases (GHG) and the transport sector contributes to a large part of GHG emissions. The transport sector is the only sector that actually has increased the emissions during the last decade. This is a result of a growing economy and an increased demand of both carriages of passengers as well as freight transports. To reduce GHG emissions there is a need of smart, effective logistics solutions and new technologies. This thesis will contain a review of Åkers Sweden AB’s outbound logistics of rolls. The aim of this thesis is to identify environmental improvements without increasing further costs. A questionnaire for environmental evaluation of transport suppliers will also be developed in this thesis. Initial question formulations of this thesis are:
1. What are the environmental effects of the different modes of freight transports that are used in the case of Åkers Sweden AB? Are there any environmental improvements possible to establish without increasing costs?
2. How can distributors be evaluated regarding environmental effects?
Emissions and energy use of Åkers Sweden AB’s transports is calculated with the calculation model NTMcalc version 1.9.9. This model is developed by the Network for Transport and Environment (NTM). Examined modes of transport are road, rail and sea transports. Both theory and result in this thesis demonstrate that rail transports should be preferred to road transports from an environmental point of view. A disadvantage of rail transports is longer transport time in most cases. Longer transport time contribute to higher capital cost of goods during transit. Another disadvantage is that rail transports are limited between terminals or that customers have an industrial railway track. That leads to an increased need of reloading and handling costs.
Potential alternative with less impact on the environment has been developed. This involves less impact than current alternative. The new alternative will decrease freight costs by 37 %. However, an increased capital cost by 84 % has been identified due to additional transportation time that is required for the alternative suggested. Transport costs are poorly connected to the real cost on the society. Governments throughout the world need to encourage transport buyers to choose more environmentally adapted alternatives by using management control measures. Also, a questionnaire for environmental evaluation of transport suppliers has been developed. It contains questions of the environmental organisation of the company, how they work with education of staff and reporting of environmental effects.
Keywords
Environmental effects, environmental evaluation, logistics costs, outbound logistics, transport modes
Sammanfattning
IV
Sammanfattning
Under senare tid har miljöfrågor fått en alltmer framträdande roll i samhällsdebatten. Det är av största vikt att reducera alla utsläpp av växthusgaser och transportsektorn står för en betydande del av dessa. Transportsektorn är den enda samhällssektorn som ökat utsläppen av växthusgaser under senare år. Detta till följd av en växande ekonomi och ett ökat behov av både person- och frakttransporter. För att reducera utsläppen krävs smarta, effektiva lösningar och ny teknologi. Detta examensarbete kommer att innehålla en fördjupning av Åkers Sweden AB:s utgående distribution av valsar. Målet är att försöka hitta en distributionslösning som är mer miljövänlig än nuvarande alternativ, men samtidigt inte dyrare. Även ett förslag till miljöbedömning av transportleverantörer kommer att utvecklas i detta examensarbete. Detta arbete syftar att svara på följande frågeställningar:
1. Vilken miljöpåverkan har de olika typer av frakttransporter som används av Åkers Sweden AB? Kan ett mer miljövänligt alternativ utvecklas utan att kostnaderna ökar?
2. Hur kan transportleverantörer utvärderas ur ett miljöperspektiv?
Utsläpp och energiförbrukning vid Åkers Sweden AB:s transporter beräknades med hjälp av kalkylverktyget NTMcalc version 1.9.9. Denna modell är utvecklad av Nätverket för Transporter och Miljön (NTM). De transportslag som undersöks är väg- sjö- och järnvägstransporter. Både teori och resultat i denna rapport visar att järnvägstransport bör föredras ur ett miljöperspektiv framför vägtransport. Nackdelen med järnvägstransporter är att de oftast har en längre transporttid under framförallt kortare transporter. En längre transporttid ger högre kapitalbindning i produkter under transport. En annan nackdel är att järnvägstransporter är bundna mellan terminaler eller är beroende av att kunden har industrispår. Därmed krävs omlastning vilket leder till att hanteringskostnader ökar.
I detta examensarbete har ett mer miljövänligt alternativ har utvecklats. Detta alternativ har en betydligt mindre miljöpåverkan än i nuvarande situation. Fraktkostnaden minskar med 37 % i det nya alternativet. Eftersom transporttiden ökar, stiger kapitalkostnaden för det nya alternativet med 84 %. Transportkostnader speglar sällan den totala kostnaden de har för samhället. Regeringar runt om i världen behöver med hjälp av ekonomiska styrmedel uppmuntra transportköpare att välja ett miljövänligare alternativ. Ett formulär för miljöbedömning av transportleverantörer har även utvecklats. Detta innehåller frågor kring hur företaget arbetar med miljöorganisation, utbildning av personal och rapportering av miljöpåverkan.
Nyckelord
Table of contents
V
Table of contents
1
Introduction ... 1
1.1 BACKGROUND ... 1
1.2 PURPOSE AND GOAL ... 3
1.3 QUESTION FORMULATIONS ... 3 1.4 DELIMITATIONS ... 4
2
Method ... 5
2.1 SCIENTIFIC APPROACH ... 5 2.1.1 Positivism... 5 2.1.2 Hermeneutics ... 52.1.3 Choice of scientific approach ... 5
2.2 SCIENTIFIC ASSAULT APPROACH ... 6
2.2.1 Deduction... 6
2.2.2 Induction ... 6
2.2.3 Choice of scientific assault approach ... 6
2.3 DATA ACQUISITION ... 7
2.3.1 Research methods - quantitative or qualitative ... 7
2.3.2 Choice of research method ... 7
2.3.3 Data acquisition - primary data and secondary data ... 7
2.3.4 Choice of data acquisition ... 7
2.4 METHOD REVIEW ... 8
2.4.1 Validity and reliability ... 8
2.4.2 Validity and reliability of this thesis ... 8
2.5 WORKING PROCESS ... 8
3
Theoretical background ... 10
3.1 TRANSPORT TRENDS ... 10
3.1.1 Globalisation ... 10
3.1.2 Infrastructure ... 10
3.1.3 Research and Technological Development (RTD) ... 11
3.2 MODES OF TRANSPORTATION ... 11
3.2.1 Rail ... 12
3.2.2 Road ... 12
3.2.3 Sea ... 13
3.2.4 Comparison of different transport modes ... 13
3.2.5 Intermodal transport ... 14
3.3 FUELS AND EMISSIONS ... 15
3.3.1 Fuels ... 15
3.3.2 Emissions ... 18
3.3.3 Environmental impact ... 20
3.3.4 NTMcalc version 1.9.9 ... 21
3.4 TRANSPORT SUPPLIER EVALUATION ... 25
3.5 HOW TO CALCULATE TRANSPORT COSTS ... 27
3.5.1 Transport cost ... 27
3.5.2 How to calculate total logistics costs... 28
3.6 INCOTERMS ... 30
3.6.1 A survey of the four Incoterm groups ... 30
3.6.2 Differences ... 31
3.6.3 Incoterms analysed ... 31
4
Company description ... 33
4.1 ÅKERS GROUP ... 33
Table of contents
VI
4.2 ÅKERS SWEDEN AB ... 34
4.2.1 Products ... 34
4.2.2 Åkers Marketing and Sales ... 35
5
Result and Analyse ... 36
5.1 PRESENT SITUATION ... 36 5.1.1 Rail routes... 38 5.1.2 Road routes ... 39 5.1.3 Sea routes ... 44 5.2 NEW ALTERNATIVE ... 46 5.2.2 Rail routes... 47 5.2.3 Road routes ... 49 5.3 COMPARISON ... 50 5.3.1 Freight cost ... 50
5.3.2 Capital cost of goods during transit ... 51
5.3.3 Environmental effects ... 52
5.4 ENVIRONMENTAL EVALUATION OF TRANSPORT SUPPLIERS ... 54
5.4.1 Suggestion for evaluation form ... 54
6
Discussion ... 57
6.1 CHOICE OF TRANSPORT MODE ... 57
6.2 PRESENT SITUATION ... 57
6.3 NEW ALTERNATIVE ... 58
6.4 CALCULATION MODEL NTMCALC VERSION 1.9.9 ... 60
6.5 EVALUATION OF TRANSPORT SUPPLIERS ... 60
6.6 SUGGESTION FOR FURTHER INVESTIGATION ... 61
6.7 GOAL ACHIEVEMENT ... 61
7
Conclusion ... 63
8
References ... 64
9
Search words ... 69
10
Appendices ... 70
APPENDIX I ... 71 APPENDIX II ... 78 APPENDIX III ... 79 APPENDIX IV ... 84 APPENDIX V ... 86 APPENDIX VI ... 93 APPENDIX VII ... 95 APPENDIX VIII ... 96 APPENDIX IX ... 99 APPENDIX X ... 102 APPENDIX XI ... 105 APPENDIX XII ... 117 APPENDIX XIII ... 126 APPENDIX XIV ... 130 APPENDIX XV... 133 APPENDIX XVI ... 134 APPENDIX XVII ... 143 APPENDIX XVIII ... 145 APPENDIX XIX ... 147 APPENDIX XX... 149 APPENDIX XXI ... 153 APPENDIX XXII ... 155 APPENDIX XXIII ... 156Table of contents
VII
Figures
FIGURE 1 DIFFERENCE IN GLOBAL MEAN TEMPERATURE 1
FIGURE 2 GHG EMISSIONS BY SECTOR – EU-27 2
FIGURE 3 COMPARISON BETWEEN FOUR TRADITIONAL MODES OF TRANSPORT 14
FIGURE 4 POSSIBLE PATHWAYS FOR ENERGY FROM PRIMARY RESOURCE TO FINAL
END USE 16
FIGURE 5 STRUCTURE OF TRANSPORT COSTS 27
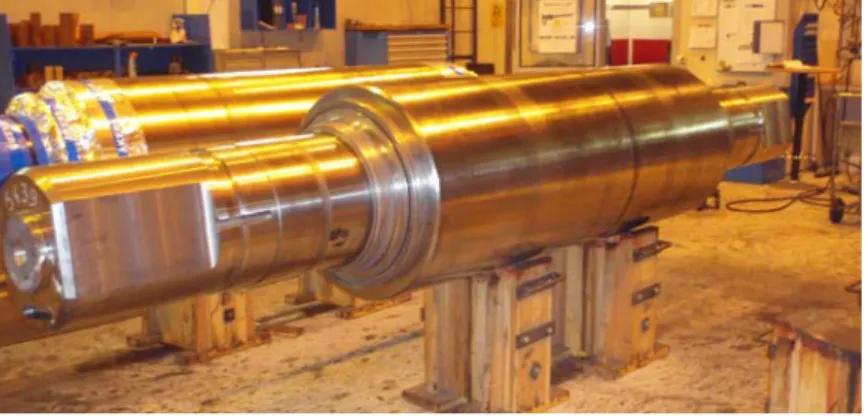
FIGURE 6 MANUFACTURED ROLLS 33
FIGURE 7 PRINCIPLE OF ROLLING 34
FIGURE 8 ROLL MANUFACTURED BY ÅKERS SWEDEN AB 35
FIGURE 9 ENVIRONMENTAL EFFECTS, ÅKERS STYCKEBRUK - BERLAIMONT 38
FIGURE 10 ENVIRONMENTAL EFFECTS, ÅKERS STYCKEBRUK - GOTHENBURG 39
FIGURE 11 ENVIRONMENTAL EFFECTS, ÅKERS STYCKEBRUK - GERMANY 40
FIGURE 12 ENVIRONMENTAL EFFECTS, NORTH AMERICA 41
FIGURE 13 ENVIRONMENTAL EFFECTS, BERLAIMONT - CUSTOMERS 42
FIGURE 14 ENVIRONMENTAL EFFECTS, INDIA 43
FIGURE 15 ENVIRONMENTAL EFFECTS, GOTHENBURG - CUSTOMERS 44
FIGURE 16 ENVIRONMENTAL EFFECTS, ANTWERP - CUSTOMERS 45
FIGURE 17 ENVIRONMENTAL EFFECTS, ÅKERS STYCKEBRUK - GOTHENBURG 47
FIGURE 18 ENVIRONMENTAL EFFECTS, ÅKERS STYCKEBRUK - GERMANY 48
FIGURE 19 ENVIRONMENTAL EFFECTS, HATTINGEN - CUSTOMERS IN GERMANY 49
FIGURE 20 COMPARISON OF ENVIRONMENTAL EFFECTS, ÅKERS STYCKEBRUK -
GOTHENBURG 52
FIGURE 21 COMPARISON OF ENVIRONMENTAL EFFECTS, ÅKERS STYCKEBRUK -
GERMANY 53
Tables
TABLE 1 RAIL - EMISSIONS (G/TONNE-KM) 19
TABLE 2 ROAD - EMISSIONS (G/TONNE-KM) 19
TABLE 3 COMPARISON OF FREIGHT COST 50
Introduction
1
1 Introduction
The first chapter introduces the reader to the thesis. A background to the environmental situation in the world today is included. Furthermore, the purpose and goal as well as boundaries are included to give the reader information on what the thesis will discuss. The chapter concludes with an outline of the thesis.
As a part of the Bachelor of Science program Industrial Engineering and Management - Logistics and Management at School of Engineering in Jönköping, students are supposed to perform a thesis within the area of their studies. Due to the increased debate about environmental effects of transports it is interesting to investigate how different modes of transports effect the environment. Smart solutions and efficient flows can both be cost effective and better for the environment. It will become more and more important to deal with those issues in the future. This thesis will look into Åkers Sweden AB’s distribution to their customers. Both logistics costs as well as environmental effects will be reviewed.
1.1 Background
In the last decade discussions about environmental issues have increased rapidly. Climate change is already happening and is probably the biggest threat that needs to be dealt with today (European Commission [EC], 2009a). The increase of temperature is widespread over the entire globe but is greater in northern latitudes. This has a huge
Introduction
2
impact on climate. Arctic ices are melting, the temperature is rising and biological systems are being affected (Intergovernmental Panel on Climate Change [IPCC], 2007a).The global warming has occurred in two phases in the last century (figure 1). From the 1910s to the 1940s global mean temperature has increased by 0.35 ºC and from the 1970s to the present it has increased even more by approximately 0.55 ºC. Over the last 25 years an increasing rate of global warming has taken place. In 2007, 11 of 12 warmest years had occurred in the last 12 years (IPCC, 2007b).
In 1997 an international agreement of 37 industrialised countries was made in Kyoto, Japan. The Kyoto Protocol sets targets for these countries as well as for the European Community for reducing GHG emissions. In average these countries should reduce the emissions of GHG with 5 % compared to their values in 1990. This should be made during a five-year-period between 2008 and 2012. 14th of January 2009, 183 countries and the European Economic Community (EEC) accepted or approved the agreement (United Nations Framework Convention on Climate Change [UNFCCC], 2009). EEC has set an even higher target on reducing emissions of GHG to 8 %. In March 2007, European Union (EU) leaders committed to reduce its GHG emissions by 30 % of 1990s levels by 2020, provided that other developed countries commit to make comparable reductions under a global agreement (EC, 2009a).
The combustion of fossil fuel in the transport sector contributes to emissions of GHG. Due to a developing economy the past decade, the need for freight transport has increased. Between year 1995 and 2006 goods transport growth was about 2.8 % per year. As shown in figure 2, the transport sector was the only one with steadily increasing rate of GHG emissions between 1990 and 2005. The level of 1990s GHG emissions have index = 1, in the diagram (EC, 2008).
Total Transport Total Households Energy Industries Services, etc. Industry
Other e.g. Waste
To offset this growth in the transport sector it will be significant to improve its energy efficiency to reduce emissions of GHG. Effective flows and smart solutions for goods transports can both reduce costs as well as the negative influence on the environment. Most environmental initiatives are expensive, even those which will save money in
Figure 2 GHG Emissions by Sector – EU-27 Million tonnes CO2 equivalent (EC, 2008, p.186)
Introduction
3
the long term. Due to present recession, there is a risk that these initiatives will be set aside. But there are still some key pressures that force companies to look into environmental initiatives. Most important is the desire to be a thought leader for environmental sustainability, which can lead to competitive advantages. Also, rising cost of fuel and energy is an important issue to consider.
Åkers Sweden AB is a world leading roll maker situated in Åkers Styckebruk in the midst of Sweden. The assignment of this thesis is to take control and calculate the environmental effect of their distribution of rolls to customers and to the production facility in Berlaimont, France. A suggestion of a new alternative will be presented. The new alternative will be compared to present situation and the authors’ expectation is that the new alternative will be more cost effective and environmental friendly. In addition to this a suggestion on how to evaluate distributors will be developed. Due to the heavy products of Åkers Sweden AB, not all modes of transportation can be considered. The focus will be on road, rail and sea transports.
1.2 Purpose and goal
The purpose and goal of this thesis work is to:
1. Make a description of the present situation of Åkers Sweden AB’s outflow distribution and to investigate and analyse other solutions to reduce cost and environmental effects.
2. An investigation of how Åkers Sweden AB’s distributors can be evaluated according to environmental effects will be examined.
3. Also, this thesis should give deeper knowledge about different modes of freight transport and fuels and the environmental effects of them.
1.3 Question formulations
The thesis work aims to answer the following questions:
1. What are the environmental effects of the different modes of freight transports that are used in the case of Åkers Sweden AB? Are there any environmental improvements possible to establish without increasing costs?
Introduction
4
1.4 Delimitations
This thesis contains the outbound logistics of Åkers Sweden AB’s finished goods to customers and blank rolls to the production facility in Berlaimont, France. The analysis will focus on emissions, capital cost of goods in transit and transport costs. Though, handling and transhipment costs in harbours will not be analysed due to Åkers Sweden AB’s varied procurements of transports and difficulties to separate handling costs from total costs. Furthermore, the authors have not calculated with the dimensions of rolls, only the weight is considered during transport.
The outbound logistics will be analysed according to Incoterms negotiated with Åkers Sweden AB’s customers. Incoterms divide responsibility of distribution between manufacturer and customer. Therefore, environmental effects and costs will be analysed to the point where responsibility turn to the customer. Åkers Sweden AB’s has customers all over the world but this thesis will focus on their largest markets because they make the largest impact, both on cost and environment. The largest markets are China, Egypt, Germany, India and North America.
Method
5
2 Method
The method chapter presents the thesis methodology. Theory and the authors' choice of methodological approach are presented. The expectation is that problem formulation and purpose made by the authors will be understood through the scientific choices. The working process is presented at the end of the chapter.
2.1 Scientific approach
In the performance of a thesis it is important to consider the scientific approach to understand the aim, purpose and methodology. Two well-known and separated approaches are hermeneutics and positivism. Differences between them are interpretation and explanation (Andersson, 1979).
2.1.1 Positivism
Basic of positivism is scientific rationality and that a statement is true only if it is agreed with reality. The methods should give reliable knowledge and it should be considered from measurements instead of estimations and judgements. The knowledge should be measured in terms of reliability and validity (Wallén, 1996). Both the human observer and technique used in a study should be neutral. The scientist should not involve personal feelings in the research. The most important thing is objectivity in terms of positivism (Denscombe, 2002). The knowledge that originates from positivism leads to universal causes and effects (Andersen, 1994).
2.1.2 Hermeneutics
Hermeneutics is about interpretation of the meaning in a broad sense and can be translated as “learning through interpretation” (Wallén, 1996). According to Andersson (1979) hermeneutics has no causality and is not about explanations but rather for understanding. The method is based on the understanding of a text where the reader is making a subjective reconstruction of the meaning (Andersen, 1994). Interpretation can consist of all kinds of things, for example conventions or symbols with defined significance to the understandings of messages despite disturbances and misinterpretations. Hermeneutics can also be used in a combination between psychological and other theories to understand a human being in a deeper level (Wallén, 1996).
2.1.3 Choice of scientific approach
As this thesis includes objective calculations of costs and environmental effects of Åkers Sweden AB’s distribution the scientific approach can be seen as positivism. A hermeneutic approach is more of interpreting the result in a subjective way. Calculations of environmental effects will be done by using a model invented by
Method
6
NTM. The result will be interpreted and compared to underlying theory about how different transport modes contribute to GHG emissions. The aim is to compare different transport modes and logistics solutions.
2.2 Scientific assault approach
The most essential methods of collecting and developing knowledge are deduction and induction (Andersen, 1994). Deduction is based on logic conclusions. Induction is systematised experience and is based on observations and leads to generalised conclusions (Sohlberg, 2002).
2.2.1 Deduction
The word deduction comes from the Latin word “deducere” and means “leads away from” (Andersen, 1994). In deduction you start from fundamental principles and make your conclusion from logic rather than observations. General principles are being taken for granted and scientists then make logical derivation from these principles (Sohlberg, 2002).
2.2.2 Induction
Induction is an empirical perspective where you collect data and it gives a general and theoretical description of the reality (Sohlberg, 2002). The data acquisition should be unbiased. There has been strong criticism against an inductive approach because the theory include nothing else than the data acquisition and that the observations is limited to some degree. General laws cannot be drawn from limited observations (Wallén, 1996).
2.2.3 Choice of scientific assault approach
Åkers Sweden AB contributed with secondary data. The data provided has been compiled and classified to make it transparent. The data collected from Åkers Sweden AB contained a backlog of orders from year 2008. This data include customers, country, article type, weight, terms of delivery, delivery date and article value. Theory, hypothesis and delimitations were then created. Set hypothesis imply that Åkers Sweden AB’s distribution today can be more environmental friendly without getting more expensive. Calculations of costs and environmental effects will show the correctitude of this hypothesis. Then, chosen calculation model selected what type of data that needed to be collected from the distributors. This data contained delivery distance and transport time. The discussion reflects hypothesis, theory and result. The method used can be seen as a combination of a deductive and an inductive method.
Method
7
2.3 Data acquisition
2.3.1 Research methods - quantitative or qualitative
The characteristics of quantitative research methodologies are that measurement is conducted through numbers. Quantitative research demonstrates cause-effect relationships and every research project starts by setting a hypothesis (Gunter, 2002). The goal for the quantitative method is to reveal a large number of data that relatively well represent the central subject studied. It is important to know from the beginning which data to look for (Eneroth, 1984). This type of research has three characteristic phases: secure knowledge of different variables for the concept studied, find out how to use them in the study and then measure these variables (Grix, 2004). The aim for qualitative research is to practice as many aspects as possible of the issue studied, not to look for fixed data. Qualitative methods proceed from a theory about the studied subject. The following step is to examine the alignment between reality and theory (Eneroth, 1984). Methods for data collection in qualitative research are for example focused interviews and observations. Then, the scientist interprets collected data and examine if it is in line with theory or not (Jensen, 2002a). The scientist analyses cases in their cultural and social context over a specific period of time (Grix, 2004).
2.3.2 Choice of research method
The research method in this thesis will be based on a quantitative research method. A large number of data will represent average emissions of GHG from Åkers Sweden AB’s freight transports during the year 2008. The model used for calculation of environmental effects is NTMcalc version 1.9.9. Also cost of freight transports will be represented with a large number of data. Logistics costs will be calculated by a model presented by de Jong and Ben-Akiva (2007).
2.3.3 Data acquisition - primary data and secondary data
Data can be both primary and secondary. Secondary data are collected by other people or from other studies. Mostly it is less time consuming than gathering primary data. Primary data are collected by the researcher to match the specific research question (Ahmadi & Simmering, 2006). The risk of collecting secondary data is that the person who has gathered the data has interpreted it in a personal perspective (Eneroth, 1984).
2.3.4 Choice of data acquisition
Secondary data from both Åkers Sweden AB and their distributors will be used in this thesis. As presented earlier in this thesis the data from Åkers Sweden contained of a backlog of orders from year 2008 including customers, country, article type, weight, term of delivery, delivery date and article value. The data from the suppliers contained
Method
8
delivery distance, transport time and in some cases costs. The calculation model NTMcalc version 1.9.9 is programmed with values of emissions from different modes of transports.
2.4 Method review
2.4.1 Validity and reliability
In the end of a research project it is important to control the quality of the work (Jensen, 2002b). In quantitative research methods it is important to consider reliability and validity. Reliability means that the measurements are done in a correct way. An important principle is that many different researchers that use the same method should end up with the same result. If this is the case the research has high reliability (Thurén, 1991). Validity implies that the research actually consists of what was intended to investigate and nothing else (Jensen, 2002b; Thurén, 1991).
2.4.2 Validity and reliability of this thesis
Data collected from distributors, Åkers Sweden AB and other sources earns high reliability in this thesis. However, the method of calculating environmental effects requires specific information about the different modes of transport. Some assumptions have been made due to difficulties in collecting this information. Therefore, it is hard to perform overall high reliability. The thesis consists of transport cost, environmental effects caused by transportation and a transport supplier evaluation which was intended. This implies high validity.
2.5 Working process
Work began in February of year 2009 with an exploratory visit to Åkers Styckebruk. During this meeting, guidelines for the upcoming work were formed and ideas and expectations of both Åkers Sweden AB and authors were reflected. The day-long visit included a guided tour of the facilities to create an understanding of the products manufactured as well as the production process. After the meeting, information was supplied in form of a backlog of orders from year 2008 and of a business presentation. The work started with processing the backlog of orders in order to obtain the information needed. After email correspondence with the supervisor, boundaries and scope of work were determined. Collected basic literature was reviewed to receive basic knowledge about the subject. Later, the introductory chapter including background, purpose of the thesis, delimitations and method was finalised.
Next stage of the work was literature studies. This was made in late March and early April of year 2009. Areas analysed was transport trends, modes of transportation, fuels and emissions, transport supplier evaluation, how to calculate transport costs and
Method
9
Incoterms. The result can be found in the theory chapter. In this stage the emissions calculation model NTMcalc version 1.9.9 was chosen to be used. At the same time the company description in chapter 4 was finalised. The company description is based on interviews with Anders Sundström, Quality Manager at Åkers Sweden AB and Ulrika Scherberg, Logistics Manager at Åkers Sweden AB.
A collection of data from Åkers Sweden AB’s transport suppliers started parallel to the literature studies. This data contained distances, transport times and transport costs for analysed routes. This was mainly done by email correspondence, and sometimes by phone. Complementary data as internal rate of return was collected from Åkers Sweden AB.
Data have been collected from:
Christel Johansson, Environmental/Quality Manager, DSV Road AB Christer Jakobsson, Sales Executive, DSV Air & Sea AB
Mats Möllersten, Business Area Manager Germany/Switzerland, DSV Road AB Mats Nilsson, Forwarding Department, Railog AB
Mikael Andersson, Master Planner, Åkers Sweden AB Thomas Edström, Sales & Logistics, LBC Varberg
Collected data have been used to calculate emissions, capital cost of goods during transit and transport costs for both current routes and new alternative routes. The result of these calculations is presented in the result chapter and is detailed in appendices. In the discussion chapter, transport modes are compared and discussed. Also strengths and weaknesses of used calculation model, present situation, new alternatives and goal achievement are discussed. Suggestion on further investigation is presented as well.
Theoretical background
10
3 Theoretical background
The theory chapter provides basic knowledge of transports and environment. The chapter presents the theory required for the calculation and understanding of environmental effects and logistical costs associated with outbound logistics. Some examples of transport supplier evaluations are also presented. Some parts of the theory are not fully analysed in this thesis. These parts are presented for the understanding of the subject.
3.1 Transport trends
3.1.1 Globalisation
Over the last 50 years there has been an emerging trend for globalisation. This leads to a deeper integration between countries regarding production and exchange. It has become easier to exchange, for example, goods, labour and services. Cheap transports and development in communications have made this possible and political and economical crises will only slow down the process. However, the trend of increased exchange will not be stopped completely. It will only be temporarily slowed down. Further progress in communication and transport technologies and that the economic catching-up countries such as China and India wants this trend to continue, makes it even more difficult to slow down. The international trade first started among neighbouring regions and countries and then expanded to all over the world, especially between the western countries and the new emerging economies, BRIC (Brazil, Russia, India and China). There is an urge for a more specialised and wider product range and in combination with low barriers to trade and low transport costs the transportation has increased between long-distance countries. In terms of foreign markets, companies have been aware of the importance to locate the production close to that market. Due to this, they do not lose that market as a consequence of local producers producing the same products without transportation costs. The new subsidiaries firms lead to additional transport flows due to the high tendency to trade with the mother firm (EC, 2009b).
3.1.2 Infrastructure
Transport in the world is projected to grow and the infrastructure will become scarce in the near future. Public authorities have to reflect which way they are going to fund infrastructure, because when the public resource is scarce the transport is neglected. They can apply the polluter-pays-principle and also use public funds to maintain and develop infrastructure. Despite these efforts, infrastructure will not meet transport demand and therefore the private sector has to provide financial support. Private
Theoretical background
11
operators have to be stimulated to invest in infrastructure and given the possibility to share the risk with other operators (EC, 2009b).
Design of future infrastructure should stimulate the use of environmentally friendly energy resources. The infrastructure could be stimulated in many ways and some examples are uninterrupted electrification for railways major corridors and highways could develop long green distances with uninterrupted availability of bio fuels. For short distance transport, development of charging stations of electrical or plug-in hybrid cars should be available at strategic locations along the road (ibid).
Driving in town with large lorries is very difficult because accessibility is poor and there is often hard to find the destination right away. Also, emissions are larger in city traffic than it is on main roads. Therefore, new warehouses should be located in the outskirt of a city to make deliveries to and from cities more efficient and environmentally friendly (ibid).
3.1.3 Research and Technological Development (RTD)
It is a demanding task solving present transportation problems. There has to be increased funds for research concerning energy solutions and Intelligent Transportation Systems (ITS) and also the development of door-to-door intermodal transport. Scientists have to think about both short term effectiveness and futuristic concepts to be able to deal with both present and future issues. Projects of this kind are very expensive and therefore financial support is required to demonstrate the different projects before the actual introduction. Maybe, technical development will not be sufficient to meet environmental challenges. A complement to technological development should be less energy intensive means of transport and less energy intensive logistic solutions. Information and education campaigns are an important factor to reduce energy consumptions and emissions (EC, 2009b).
There are a lot of ideas and concepts nowadays and the resources are scattered between them. A comparison has to be executed between the different concepts to find out best practices and thereby focus the resources on this specific concept. Although, if the best concept is found it is also important to allow development of several alternative solutions to be prepared for all kind of problems both in short- and long-term (ibid).
3.2 Modes of transportation
Freight concept involves transport services between two geographically separate locations. The term excludes internal transports which tend to occur in various types of internal movements. There are several logistics solutions to movement of goods. There are four basic ways to transport goods; air, sea, rail and road transport. Several different modes of transport included in a shipment are called intermodal transport. In
Theoretical background
12
most cases, it is not the transport itself, which determines the type of transportation to be used. It is more common that existing infrastructure sets restrictions in the area where the transportation is executed (Jonsson & Mattsson, 2005).
3.2.1 Rail
It requires only seven times as little force to make freight by rail compared with a lorry on road due to its design with steel against steel and small interface. Also, rail can carry almost all types of cargo, both in large quantities and over long distances. This is the major competitiveness with rail (Lumsden, 2006). Short transport distances are often negative for the economy and time regarding rail transport. It is common with many transhipments and shunting which are negative in terms of efficiency. The railway can only operate between terminals, which also contribute to increasing costs with transports in short distances (Pewe, 2002).
Rail transport is also environmentally friendly, because of the large amount of cargo that can be transported far without any direct emissions of carbon dioxide (CO2). A prerequisite for this is that the locomotive is driven by electricity. By contrast, a disadvantage is that the operation sometimes can be long with the result that valuable goods creates a high level of tied-up capital. This is negative for rail transports and can be a reason to opt out rail compared to other transport options. The rail network is not as highly developed as the road network, which makes road transport more flexible than rail transport. It is often common for freight shipped by rail to be transported to a terminal and then re-moved by lorry to reach its final destination (Johnsson & Mattson, 2005). The potential use of rail transport is determined by where the customers are located. Proximity to the terminals is also important. The expansion of infrastructure in the region is also an important factor and the duration of the shipment (Pewe, 2002).
3.2.2 Road
The use of road transportation is growing strongly and this is based on two main explanations. The basic reason is that lorries have evolved significantly (width, volume, weight and different models). Also, road transportation is relatively fast and efficient, which is the other explanation (Lumsden, 2006). These benefits go hand in hand with today's demand for shorter lead times and more flexible transports (Pewe, 2002).
Road transport is the only mode of transport that has the ability to deliver to customer's facility. This leads to that goods do not have to be reloaded before delivery. The use of the road network in distribution provides flexibility. This makes it possible to transport almost everything. Road transport can also deliver anywhere geographically (as long as there is a road connection). The largest negative
Theoretical background
13
consequences are mainly environmental such as noise and emissions (Johnsson & Mattson, 2005).
Road transports with lorry and trailer coach are mostly used in Sweden. The dimensions of a turnout are limited by various laws and regulations. Another option is to use a trailer. A trailer is a lorry, which moves cargo carriers. The advantage of this cause is that different lorries can carry different trailers, to and from different terminals (ibid).
3.2.3 Sea
Sea transport is the slowest mode of transport. Transports between the ports leading to that the shipment in most cases do not occur between supplier and customer premises. Maritime transport provides a low transport cost due to its possibility to carry a large amount of goods. Flexibility in transportation can also be seen as strength. A vessel is only bound to the transport routes on seas. In addition to these advantages, it is cheap to maintain the infrastructure required for shipping, fairways and waterways is normally free. In comparison with the other modes of transport, vessels are most competitive with loads of low-value bulk cargo (Jonsson & Mattson, 2005).
It is more common among vessels that they are designed specifically for their work compared with other modes of transport. Examples of specialised vessels are container vessels carrying containers and Ro-Ro vessels (roll-on roll-off) where the load is on a rolling unit which can be rolled on and off during loading/unloading. Bulk and tankers are designed to transport dry and liquid bulk cargo. An advantage with vessels is their short loading/unloading time (ibid).
Demand for shipping in recent years has varied widely. Currently, loads of 3,600 million tonnes are shipped in the world annually. The reason why shipping has been reduced is the rising price of vessel fuel that is bunker oil (Lumsden, 2006).
3.2.4 Comparison of different transport modes
In this comparison rail, road and sea transport will be treated, because aviation transport is not included in Åkers Sweden AB’s distribution (U. Scherberg, personal communication, 2Feb, 2009).
The modes of transport are different suitable to carry a certain type of goods. Sea transportation is suitable for transporting large consignment sizes, after sea transport, rail is best suited for large consignments. Road, however, are not equally suited for this purpose. Transport costs are lowest at sea, followed by rail and road transport, which ultimately is the most expensive option of the three examined. Tied-up capital is greatest at sea, because of the long transport time. The railway also has a relatively high rate of up capital while road transportation has a relatively low rate of
tied-Theoretical background
14
up capital. Shipping has a low delivery service due to long transportation times. Railway has a higher delivery service than shipping but road transportation has the best delivery service of the modes examined. A summary of the comparison can be seen in figure 3 below (Jonsson & Mattsson, 2005).
Figure 3 Comparison between four traditional modes of transport (Jonsson & Mattsson, 2005, p.91)
3.2.5 Intermodal transport
Intermodal transport includes a combination of two or more modes of transport. An intermodal transport usually contains five steps. The first step consists of transport from the supplier to a terminal and this is mostly performed by lorries. The second step is the transhipment between the modes. The transportation between the terminals is the third step. Upon arrival to final terminal reaches the fourth step when the goods again are reloaded. Final step involves the final shipment to the customer (Lumsden, 2006).
Benefits of intermodal transport are the fact that it brings out the best of each mode of transportation used, which streamlines the supply chain. The disadvantage that may rise is that it usually requires more time and leads to slightly higher costs due to the various transhipments that must take part. In order to minimise that procedure, standardised carriers are used in the handling (Jonsson & Mattson, 2005). An intermodal solution can lead to reduced environmental impact. As far as possible road traffic should be changed to rail and container cargo should be transported by sea. Road transport only intends to be used in local services because of the environmental impact of road transportation (Lumsden, 2006).
3.2.5.1 Unit Carrier
In cases of transport where goods must be transferred between different modes of transport, it is necessary to create a rational transfer between the modes. For these reasons, unit carriers have been developed. This means that the handling of each freight unit can be avoided. Instead, the cargo unit is loaded in the unit carrier and the carrier is in itself a device for handling during transhipment. The introduction of
Theoretical background
15
standardised unit loads means that the transhipment between different modes of transport has become more simple, faster and cheaper. This is because the goods themselves are not handled during transhipment. Also, it only requires one type of handling equipment at the operation of transhipment (Lumsden, 2006).
According to Lumsden (2006) most common unit carriers are: • Containers
• Trailers • Swaps
3.3 Fuels and Emissions
3.3.1 Fuels
The transport sector almost exclusively uses petroleum fuels. Approximately two thirds of our oil resources are concentrated to the Middle East and therefore a lot of countries rely on their work to produce oil for their transportation. A serious problem of petroleum is the emissions and the fact that emission is increasing at a higher rate than the emissions from other sectors. Choice of fuel is important due to today’s severe emission problems. New technologies, such as fuel efficiency improvement, exhaust reduction and transport management are a vital subject for reducing the environmental impact of transportation (Hensher & Button, 2003).
A lot of combinations between transportation fuels and vehicle technologies can be used in future transportation systems (figure 4). The environmental quality depends mainly on the choice of primary energy resource (e.g. oil, coal, biomass) but also on the chosen energy carrier (e.g. gasoline, methanol, electricity) and vehicle technology (ibid).
Theoretical background
16
Figure 4 Possible pathways for energy from primary resource to final end use (Hensher & Button, 2003, p.142).
Key: ICEV = internal combustion engine vehicle HEV = hybrid electric vehicle
FCEV = fuel cell electric vehicle
BPEV = battery powered electric vehicle Conventional fuels in ICEVs
A list of conventional fuels in ICEVs (Hensher & Button, 2003): • Petrol • Diesel • Biogas/natural gas • Alcohol 3.3.1.1 Rail transport Diesel
Diesel locomotives have been used since the beginning of 20th century (Railway Gazette International, 2005). The main parts of rail transports in Sweden are using electrical power, but still a small part uses diesel fuel. CO2 emissions from diesel trains have decreased with 59 % in Sweden year 2005 compared to the levels of 1990. Emissions of sulphur have been entirely removed since year 1995 and emissions of nitrogen oxide and hydrocarbons have both been reduced with approximately 40 % (Banverket, 2009).
Electricity
Rail is increasingly turning to electrical power instead of using diesel power units. The carbon footprint of rail depends on how the electricity is generated (European Environmental Agency [EEA], 2008). Another advantage of investing in electrical power trains compared to the use of diesel trains is that it will protect the railway
Theoretical background
17
industry from getting too dependent on a certain fuel (Professional Engineering, 2007).
Bio fuel
By using bio fuel you can avoid increasing oil prices, but it is not obvious to claim that it is a low-carbon transport. Concerning fertilizer production and drying out of soil when producing bio fuels, reductions of GHG is quite small relative to the fossil fuels they replace. By the production and combustion of maize-based ethanol the reduction is only 12 % and by using soya bean biodiesel it is 41 %. In worst cases bio fuels actually can be responsible for more GHG than the oil-based fuels they replace. Environmentally-responsible bio fuel production is similar to green electricity. It is important to consider fuels original source (Kemp, 2008).
Hydrogen
Hydrogen-fuel-cell propulsion for rail transportation is under development. Due to increasing fuel costs the railroad industry is very interested to look for alternatives to diesel (Jones, 2006). During year 2010 a pan-European consortium aims to start test running a hydrogen fuel cell powered passenger train in Denmark. There are also experimental proceedings done in both Japan and in the US (Lustig, 2009).
3.3.1.2 Road transport
Diesel
The dominated fuel among heavy trucks is diesel (Vägverket, 2004). The primary reason why heavy range vehicles choose diesel engines is the high thermal efficiency. Road vehicles use automotive gas oil or high speed diesel despite their low output both per litre and kilogram. Diesel engines offer a lower overall operational cost (Hensher & Button, 2003).
Methane gas
Can be produced both from fossil and renewable energy sources. Natural gas is the fossil alternative, but it is only used in a minor extent in the transportation sector. Biogas can be produced by for example collecting gas from landfills and makes in this way a contribution to solve waste treatment. The emissions from this kind of fuel can be very low, almost no particulate emission (ibid).
Biodiesel
The simplest way to produce biodiesel is to extract oil from rapeseed, soybeans or sunflowers. A good thing is that it can be used directly in diesel engines. Biodiesel increases nitrogen oxide emissions but could decrease emissions of hydrocarbons (HC) and particulates. The differences in emissions could be explained by the use of engines not designed for these kinds of fuel or impropriate measurement methods (ibid).
Theoretical background
18
Ethanol
Ethanol is widely used in Brazil, US and Europe. Ethanol is made of sugar cane, maize or cereals. Ethanol is particularly suitable for Otto engines but it can also be used efficiently in diesel engines with ignition additives. Ethanol fuel has lower emissions compared with gasoline and diesel in almost all pollutant areas (ibid).
Methanol and dimethyl ether (DME)
The feedstock for producing methanol and DME is natural gas. DME is a typical diesel fuel but both methanol and DME has lower emissions than diesel (ibid).
Hydrogen
In the future, hydrogen has potential to be the cleanest fuel. Production and storage are two major problems that have to be solved before success. Hydrogen is not a fossil fuel and has to be manufactured. Today, manufacturing and storage of hydrogen are very expensive. Another factor that has to be taken serious is the explosive danger of hydrogen due to its highly flammable gas (ibid).
Electricity
An advantage with vehicles driven by electricity is that emission levels are equal to zero if not regarding production of electricity. Battery electrical cars can only be used for short trips and therefore HEV (hybrid electric vehicle) are being developed to make the trips longer (ibid).
3.3.1.3 Sea transport
Heavy oil
Waterborne freight transport is one of the most important modes of transport. It can also be considered to be one of the most efficient cargo transport modes, evinced when calculating and comparing emitted grams CO2 per ton kilometre. An exception is emissions of sulphur where waterborne shipping is by far the worst. The emissions of CO2 from ships are directly related to the consumption of bunker fuel oil (EEA, 2008). Heavy oil from most large ships emits highly dangerous exhaust fumes. The year of 2002 totally 60,000 people got killed in coast areas of sickness related to the unhealthy fuel. This number is assumed to increase (Abrahamson, 2007a). In a couple of years both the US and Europe are expected to raise their demands on emissions from waterborne transport. The heavy oil that ships use will not manage these demands and both fuel and engines needs to be renewed (Abrahamson, 2007b).
3.3.2 Emissions
3.3.2.1 Rail transport
Environmental effect from rail transport depends on efficient use of energy. Comparison with other modes of transport is often considered and often with its main competitor which is road transport. If you compare these two, based on average values in a simple comparison by a given quantity of energy, you will receive following
Theoretical background
19
results; 1 kilogram of oil equivalent produces: 57.6 tonne-km in a loaded 25 tonne lorry and 128.2 tonne-km in a full-loaded train. The results indicate that rail transport is at least twice as efficient as road transport (Hensher & Button, 2003).
The approximate energy use and emissions per freight-kilometre for long-distance travel with electrical trains and diesel trains, with a loading rate of 33 %, are illustrated below (table 1):
Energy use (MJ/tonne-km) CO2 NOX Volatile organic compounds SO2 Electrical train 0.83 38 0.07 0.00 0.21 Diesel train 0.95 69 1.22 0.07 0.08
Table 1 Rail - Emissions (g/tonne-km) (Dings & Dijkstra, 1997)
The electricity in Sweden is produced from renewable resources such as water power and wind power. Diesel trains are rarely being used. Since year 1990 Sweden has been able to reduce CO2 emissions from diesel trains with 60 % and present emission is 18 gram per tonne-km. Also, since year 1995 they have reduced nitrogen oxide with almost 50 %. The reduction is made through cleaner diesel engines and increased fill rate. In Sweden, emissions from electrical trains are minimal due to the use of renewable resources in the production of electricity (Järnvägsforum, 2009).
3.3.2.2 Road transport
Heavy duty vehicles are responsible for 70 % of total pollutant emissions from transport in Europe (European Federation for Transport and Environment [T&E], 2008).
The approximate energy use and emissions per freight-kilometre with lorries that weigh 35 tonnes gvw (gross vehicle weight) and 20 tonnes gvw, with a loading rate of 55 % and 45 %, for long distance travel are presented in table 2.
Energy use (MJ/tonne-km) CO2 NOX Volatile organic compounds SO2 35 tonnes gvw 1.34 100 1.20 0.05 0.03 20 tonnes gvw 2.77 200 2.26 0.10 0.05
Table 2 Road - Emissions (g/tonne-km) (Dings & Dijkstra, 1997)
3.3.2.3 Sea transport
Environment is affected by ships in many ways. Except for air pollution, damaged vessels tend to cause large amounts of spill oil which has a negative impact on e.g. fisheries and birds. Also, vessel ballast water can be harmful to the environment by its indigenous aquatic life interfering with the indigenous aquatic life where it is
Theoretical background
20
discharged. Focus will be on air pollution and the emissions that can be harmful from vessels (Hensher & Button, 2003).
Commercial vessels are a significant source of ocean air pollution despite its low account (2 %) to world’s consumption of fossil fuels. Vessel engines are reckoned to be the dirtiest combustion source per ton of fuel consumed. The engines produce 14 % of the world’s nitrogen emissions from fossil fuels and 16 % of all sulphur emissions from petroleum. (Spice, 1999) In busy shipping lines of the North Atlantic and North Pacific Oceans gases from vessel power plants accounts for 60 % of the sulphur dioxide (SO2). Most of vessel emissions (70 %) occur within 400 km of land (Capaldo et. al, 1999).
The estimation of CO2 emissions from vessels for year 2007 is 843 million tonnes and it is 2.7 % of global CO2 emissions. The estimation for year 2007 emissions in the year 2000 from International Maritime Organisation (IMO) was 1.8 %. IMO is an organisation whose main task is to develop and maintain a framework for shipping and the responsibility today includes for example environmental concerns, maritime security and the efficiency of shipping (International Maritime Organisation, 2008).
3.3.3 Environmental impact
3.3.3.1 Carbon dioxide (CO2)
Carbon dioxide emerges from combustion of carbonaceous fuels and decomposition of organic matter. Each time we exhale, we deliver CO2 to the air. The emissions are then exhumed by plants using coal to build up their biomass, which means that oxygen is released back into the air. There is constantly a small quantity of CO2 (approximately 0.0035 %) in the air. This kind of emission is completely harmless to humans and animals in these small amounts. However, it is a precondition for growth on earth. CO2 acts as a greenhouse gas and this means that it absorbs and reflects the sun's heat rays back to Earth, which increases the global average temperature. Without CO2 in our atmosphere, the Earth would be a frozen planet. This emission is formed and consumed in a cycle and the amount in the atmosphere has remained relatively constant during a long period of time (millions of years). The reason why the use of fossil fuels can upset this balance is that these fuels were formed over millions of years and we now use them in a relatively short period of time. This rapid use can upset the balance and increase the proportion of CO2 in our atmosphere (Kågeson et al, 2008).
3.3.3.2 Nitrogen oxides (NOX)
NOX are generated by a reaction between air, nitrogen and oxygen during high temperature. A high combustion temperature results in a high amount of NOX in the exhaust gas. Though, a higher combustion temperature results in better fuel economy
Theoretical background
21
and lower carbon monoxide (CO) emissions. High levels of NOX may provide regional environmental problems such as acidification and forest decay (Shell, 2009).
3.3.3.3 Hydrocarbon (HC)
HC is coming from unburned fuel. Either from the exhaust system at incomplete combustion or are evaporated directly from the fuel tank. HC can cause smog and ozone and certain health effects which are not fully investigated yet. Stricter rules for how the petrol evaporates have reduced the problem with the fuel tank problem. Engine manufacturers have also installed carbon filters on the air venting which significantly reduce the amount of HC discharged from the fuel tanks (ibid).
3.3.3.4 Methane (CH4
)
Methane is the lightest of HCs. It is a good and high-octane fuel for spark ignition engines. The gas may be of fossil origin called natural gas and from different renewable sources often called biogas. In theory, the combustion of CH4 produces CO2 and water. In practice, some emissions of other substances are emitted, most NOX. Usually these emissions are in lower amounts than in the use of liquid fuels. Emissions of unburned CH4 in the atmosphere are very dangerous for the ecological system because CH4 is an up to 20 times stronger GHG than CO2 (ibid).
3.3.3.5 Carbon monoxide (CO)
CO arises from incomplete combustion when carbon in fuel has not burned clearly and formed CO2. This can in large quantities cause CO poisoning (ibid).
3.3.3.6 Particulate matter (PM)
PM results from certain incineration. There are divided thoughts if it is the particles themselves or by the particles transported substances that are harmful. When new engines are certified, a total particulate mass emitted during a given cycle time is measured. To get a better understanding in particle impact, new ways to measure particles have been used. The total mass of particles and also the number of particles are measured. Research is an ongoing process to investigate if there are large or small (or both) particles that are harmful (Näringslivets ekonomifakta AB, 2009).
3.3.3.7 Sulphur oxides (SOX
), including sulphur dioxide (SO
2)
The amount of sulphur oxides in the exhaust gas is directly proportional to the amount of sulphur in the fuel. In high concentrations sulphur oxides will give irritation of the respiratory. Sulphur oxides are acidifying which leads to weathering of buildings. Also, sulphur has a negative impact on vehicles emission device control (ibid).
3.3.4 NTMcalc version 1.9.9
NTM was initiated in Sweden 1993 with the aim to establish a calculation method to calculate environmental performance for various modes of transport with a common base of values. The calculation is primarily developed for buyers and sellers of
Theoretical background
22
transports in order to evaluate their environmental impact. The objective is to promote and develop the environmental work in the transport sector. Their belief is that their calculation will be a common and accepted method for emission measures (NTM, 2009).
In order to make a comparison between the different modes of transport you have to describe the transport system in a similar way for the different modes. Failing to accomplish this makes it difficult to compare the different modes of transport. NTM is describing the transport system in a similar way and try to earn credibility towards customers and the surrounding world with their calculation. To create a joint vision between the different modes of transport environmental impact, NTM has worked according to this method:
• A compilation of the environmental effects caused by transports and the choice of central parameters to accomplish greater depth in the study
• An inventory of existing information and methods to describe the environmental effects caused by emissions
• Create a joint compilation of methods through discussions which describes the environmental performance for today’s goods transportations in Sweden The information presented is no new information but it has and is being treated over time to describe reality (ibid).
3.3.4.1 The organisations behind the calculation method (ibid):
SJ Vägverket DFDS Transport AB
LRF Volvo Lastvagnar Svenska Åkeriförbundet
FFA Luftfartsverket Svenska Naturskyddsföreningen SIK Göteborgs Hamn AB Svenskt Papper
CPM Naturvårdsverket Sveriges Redareförening
Trätek Nordisk Transport Sveriges Transportindustriförbundet BTL AB Scania CV AB TFK - Institutet för transportforskning ASG AB AB Åkerikonsult Dalaåkarnas Service AB
Schenker Servera R&S AB Bilindustriföreningen Fraktarna AB Dynamo Ecology Poståkeriet Sverige AB
Frans Maas Sjöfartsverket Miljöförvaltningen i Stockholm Gävle Hamn Stena Line AB Institutet för Livsmedel och Bioteknik TRB Miljö AB Tor Line AB Institutionen för transportteknik - CTH Ultralux AB
Theoretical background
23 3.3.4.2 Method of emissions calculation
The reviewed modes of transport in this thesis that are road, rail and sea includes three methods to calculate emissions (appendix 1):
• Simplified estimation – this calculation is a rough estimation and is not suitable to select a specific transporter but to measure changes in goods flows. The calculations of NTMcalc should be based on a couple of assumptions. • Emissions calculation based on vehicle type – this calculation can be
calculated with a good degree of accuracy due to the calculation of the fuel consumption with a complement of all sub-results.
• Emissions calculation based on road/train/vessel identity and consignment – NTMcalc is not applicable to this calculation due to its presumption of a company-specific computer support. This calculation follows up all relevant parameters, e.g. exactly which vehicle that performs the transport work.
3.3.4.3 Relevant environmental issues and environmental parameters
selected
The environmental effects which occur by transportation and the production of fuel and electricity are linked to following parameters:
• Needs of energy
• Air emissions (CO2, NOX, SO2, HC, PM, CO) • Noise
• Barrier effects
• Land and water emissions
• Unregulated emissions (N2O, aldehydes, CH4, etc) • Use of land
• Infrastructure • Accidents
The selected environmental parameters for this calculation method are needs of energy and air emissions. Due to this, you can only obtain an indication of the potential environmental effect. Further research and investigations is demanded to understand the real environmental effects of the different modes of transport (NTM, 2009).
3.3.4.4 Energy
Needs of energy is the amount of energy that transforms in a specific process to, for example, driving a lorry for a certain distance. Energy is being transformed into different shapes and cannot be consumed. The transformation is often causing environmental disturbance. The energy carriers that are treated in this calculation are petrol, diesel oil, jet fuel, bunker oils and electricity. The result of the needs of energy
Theoretical background
24
is shown in three different groups; renewable energy, uranium energy and fossil energy. For lorry, vessel and aeroplane this information is only presented as conventional fuels that is fossil energy. For trains driven by electricity are all three groups included:
• Renewable energy – water- and wind power together with electricity produced from bio fuel
• Uranium energy – nuclear electricity • Fossil energy – fossil fuel
The calculation also includes the energy that will be needed in production of the energy carrier. For lorry and vessel includes crude oil extraction, refining, all intermediary transportation and end usage of each fuel. For trains driven by electricity the result shows the total needs of energy through fuel extraction, fuel refinement, electricity transformation, treatment of decay products, intermediary transportation and loss of electricity during transfer (NTM, 2009).
3.3.4.5 Energy source comparison
The most common energy units are kilowatt-hour (kWh) and mega joule (MJ). These units present an incomplete picture of what should be described. For example, kinetic wind energy and diesel with 5 kWh each has different value in terms of used system. The same energy in different forms has different possibilities to make good use. Therefore, it is difficult to compare the same value in kWh between wind turbine and crude oil energy. The grouping of the energy in three groups makes the differences of these energy sources clear and prevents incorrect comparison. Despite the grouping it is not possible to make direct comparison between energy sources (NTM, 2009). 3.3.4.6 Emissions
The calculation presents both vehicle emissions and emissions from fuel production. Information from these emissions gives, at best, an indication of the environmental impact caused by the actual mode of transport. It is difficult to make a comparison between the modes of transport only focusing on emissions magnitude. Emissions does not affect environment until pollution appear in system of nature. Therefore, it is important to notice where the emission occurs and to follow its path into the system of nature. CO2 is shown as total quantity and quantity of origin fossil in this calculation (NTM, 2009).
3.3.4.7 Source of information: electricity and fuel production
• Information about electricity is gathered from Vattenfall’s life cycle inventory for Vattenfall’s production system. This information is comparable to other plants in Scandinavia.